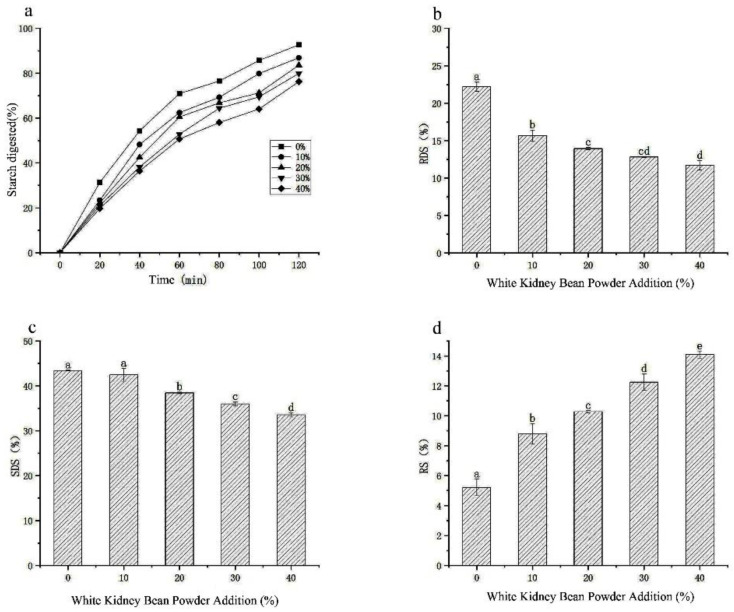
Figure 5.
Digestion diagram of white kidney bean flour noodles with different additions: (a) starch hydrolysis rate; (b) fast digestible starch content (RDS represents fast digestible starch); (c) slowly digesting starch content (SDS represents slowly digestible starch); (d) resistant starch content. Duncan’s statistical methods were used. Different letters within the same group denote significant difference (p < 0.05).

