Figure 2.
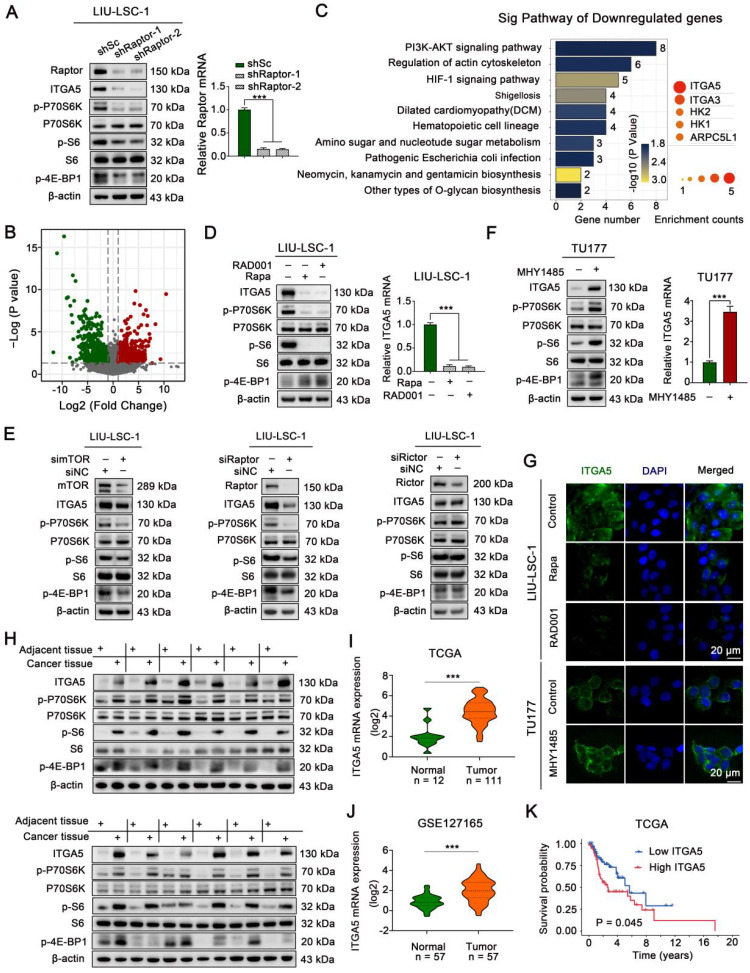
mTORC1 positively regulates ITGA5 expression in LSCC. (A) LIU-LSC-1 cells were stably expressing shRNAs targeting Raptor (shRaptor) or a control shRNA (shSc), western blotting and qRT-PCR were used to measure protein and mRNA levels. (B-C) RNA-sequencing analysis of shRaptor-1 LIU-LSC-1 cells and the controls cells (shSc LIU-LSC-1 cells) identified 224 upregulated and 221 downregulated DEGs, respectively. Volcano plot (B) of downregulated (green) and upregulated DEGs (red). KEGG pathway analysis showing top 10 enriched pathways of downregulated DEGs (left panel of C) and five genes that appeared more than twice in these pathways (right panel of C). The size of the circle represents the frequency of occurrence. (D) LIU-LSC-1 cells were treated with 20 nM Rapa or 50 nM RAD001 for 24 h. (E) LIU-LSC-1 cells were transfected with siRNA targeting mTOR (simTOR), Raptor (siRaptor), Rictor (siRictor) or the control (siNC) for 48 h. (F) TU177 cells were treated with 10µM MHY1485 for 24 h. (D-F) The samples were subjected to western blotting (E, left panels of D and F) and qRT-PCR (right panels of D and F) analyses. (G) The treated cells were subjected to IF assay. Scale bars, 20 µm. (H) ITGA5, p-P70S6K, p-4E-BP1 and p-S6 protein levels were measured by western blot using the paired ANM tissues and LSCC tissues (n = 12). (I-J) Expression analysis of ITGA5 in LSCC and normal tissues using TCGA (I) and GSE127165 (J). (K) Kaplan-Meier plot for overall survival of LSCC patients in TCGA dataset based on ITGA5 expression. High (n = 55) and low (n = 56) ITGA5 expression were stratified by the median expression level. The error bars represent the mean ± SD of triplicate technical replicates. ***P < 0.001.

