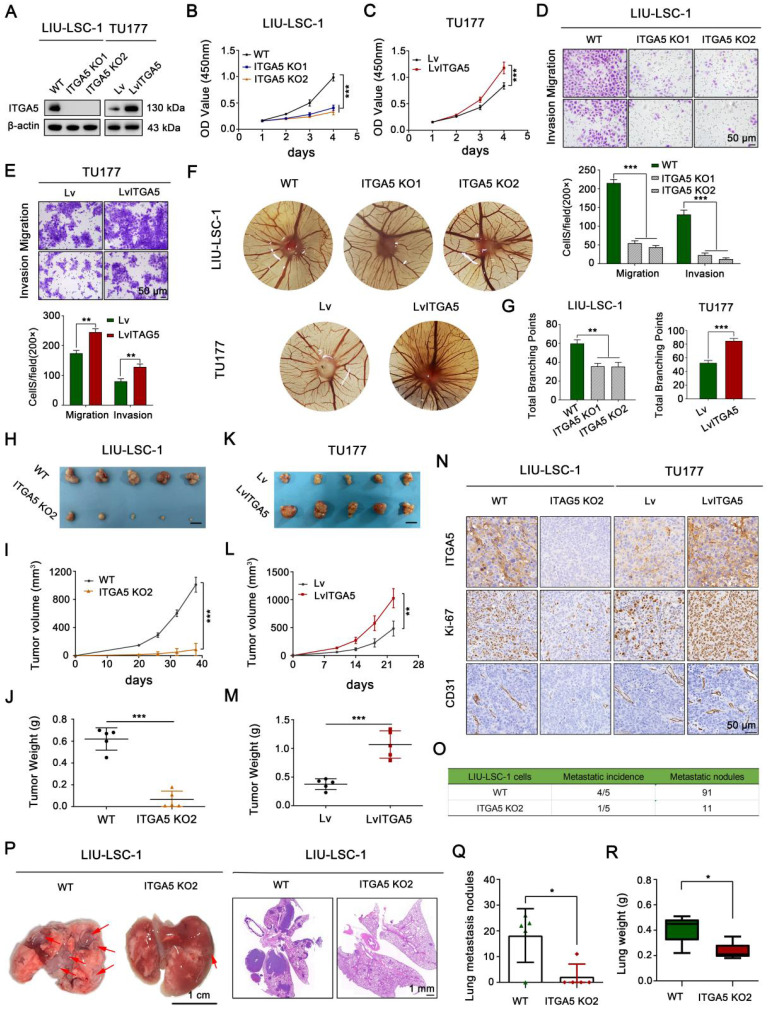
Figure 3.
The tumor-promoting effects of ITGA5 in LSCC cells. (A) ITGA5 knockout LIU-LSC-1 cell lines were constructed using a CRISPR/Cas9 approach (left panel). TU177 cells were infected with control lentiviruses or lentiviruses expressing ITGA5 (right panel). The expression of ITGA5 was assessed by western blot. (B-C) CCK-8 assays were performed to evaluate cell growth rates of the indicated cells. (D-E) Cell migration and invasion abilities of the indicated cells were measured by transwell assays (upper panel: representative images; lower panel: statistical analysis). (B-E) The error bars represent the mean ± SD of triplicate technical replicates. **P < 0.01; ***P < 0.001. (F-G) On EDD 8, sterile gelatin sponge mixed with the indicated cells suspension was planted on chicken chorioallantoic membrane. Representative images (F) and statistical analysis (G) on EDD 15 are shown. Error bars represent mean ± SD (n = 6 per group). **P < 0.01; ***P < 0.001. (H-N) The indicated cells were inoculated subcutaneously into nude mice, following by monitoring for tumor growth. Tumor images (H, K), tumor volumes at the indicated times (I, L), tumor weight (J, M), and representative IHC images of ITGA5, Ki-67, and CD31 staining from subcutaneous xenograft tissues (N). Scale bars, 1 cm (H, K), 50 µm (N). (O-R) The indicated LIU-LSC-1 cells were injected into nude mice via the tail vein (n = 5 mice/group). The number of metastatic lung nodules was summarized (O). Representative images of the lung (left panel of P, scale bar, 1 cm) and H&E-stained lung sections (right panel of P, scale bar, 1 mm) showing metastatic lesions generated from the indicated cells after tail vein injections. The red arrowheads point to the metastatic lung nodules. The lung metastatic nodules (Q) and lung weights (R) of all animals were summarized. Error bars indicate mean ± SD (n = 5 mice/group). *P < 0.05.

