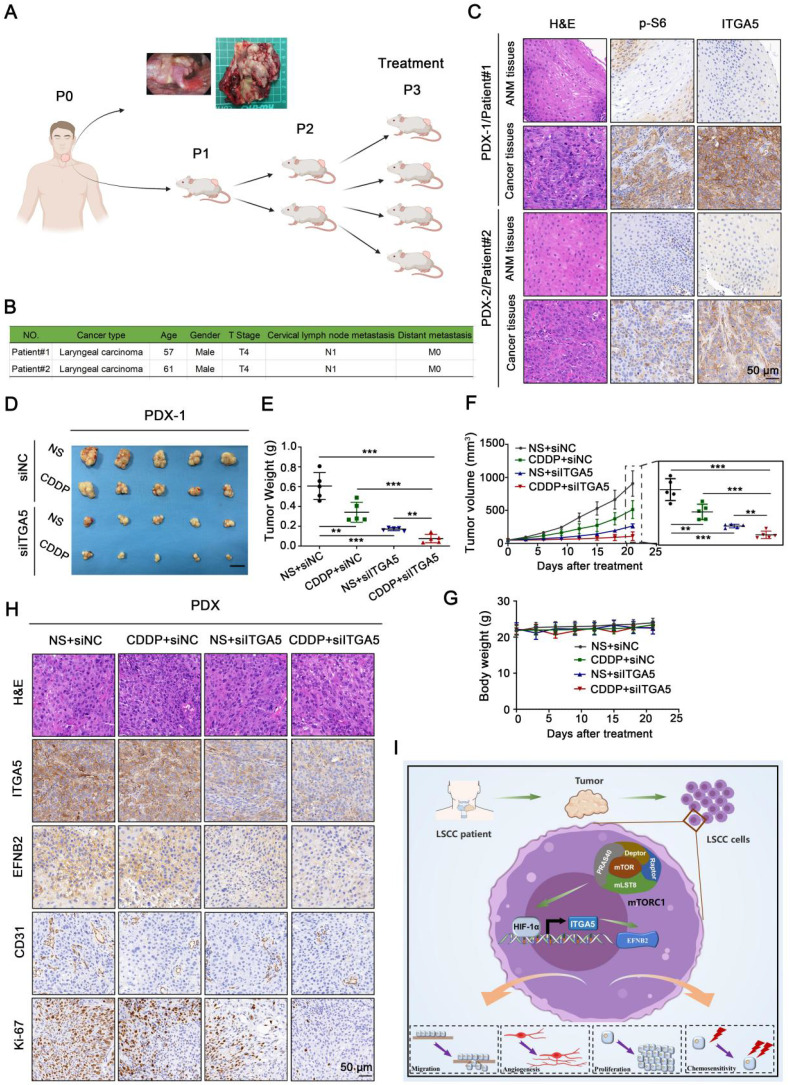
Figure 8.
Knockdown of ITGA5 increases chemosensitivity to CDDP in LSCC PDX models. (A) Graphic illustration of the generation of LSCC PDX mouse models (Image partly made by BioRender.com.) (B) Clinical characteristics of donor patients. (C) Representative H&E images and IHC images of ITGA5 and p-S6 staining from ANM or tumor tissues of donor patients. Scale bar, 50 µm. (D-F) Tumor images (D), tumor weight (E), and tumor volume (F) of PDX model tumors with the indicated treatment. Scale bars, 1 cm (D). (G) Body weight of the mice. Error bars, mean ± SD (n = 5 mice/group). **P < 0.01; ***P < 0.001. (H) Representative IHC images of ITGA5, EFNB2, CD31, and Ki-67 staining from the indicated PDX model tumors. Scale bar, 50 µm. (I) Schematic illustration of the activated ITGA5-EFNB2 axis is critical for mTORC1-mediated tumor proliferation, angiogenesis, and metastasis of LSCC.

