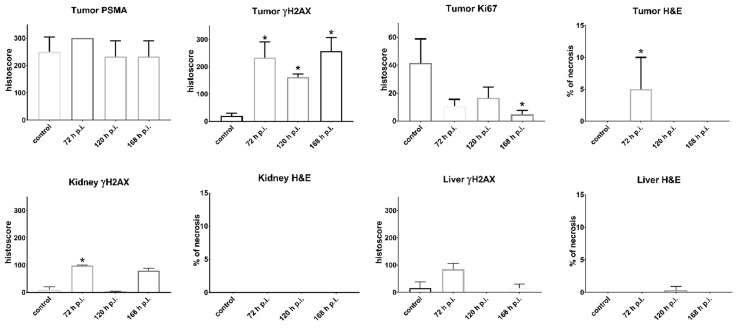
Figure 5.
Histological assessment of organ sections. The graphs in the first row describe quantification of the corresponding Immunohistochemical (IHC) staining of the tumor tissue from the control group (untreated) and from groups injected with [225Ac]Ac-mcp-D-alb-PSMA. IHC staining confirmed high PSMA expression, γH2AX showed high DNA damage in the tumor tissue, while Ki67 displayed decrease in the tumor cell proliferation and H&E staining revealed necrotic lesions in the group 72 h p.i. Values are expressed as mean with standard deviations. P-values p < 0.05 are indicated with *. n = 6 for control groups and n= 3 for [225Ac]Ac-mcp-D-alb-PSMA treated groups.

