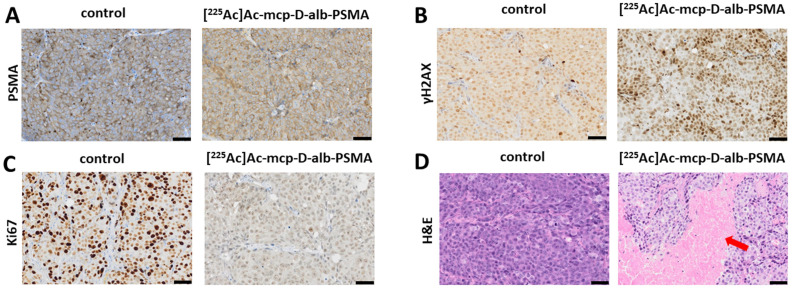
Figure 6.
Representative histological images of tumor sections. (A) Untreated control tumor and [225Ac]Ac-mcp-D-alb-PSMA treated tumor (168 h p.i.) sections were stained with anti-PSMA, (B) anti-γH2AX showing DNA damage (represented by various intensity of the brown staining) in untreated control and in [225Ac]Ac-mcp-D-alb-PSMA treated (168 h p.i.) tumor, (C) anti-Ki67 staining indication proliferation status of untreated control and [225Ac]Ac-mcp-D-alb-PSMA treated (168 h p.i.) tumor and (D) H&E stain of untreated control and [225Ac]Ac-mcp-D-alb-PSMA treated (72 h p.i.) tumor depicting necrotic region (indicated with red arrow) in treated tumor. All images were acquired at 200× magnification. Scale bars represent 50 μm for all panels.

