

Abstract
The Gastroparesis Clinical Research Consortium (GpCRC) is a multicenter coalition created and funded by the National Institutes of Diabetes and Digestive and Kidney Disorders (NIDDK), with a mission to advance understanding of the pathophysiology of gastroparesis and develop an effective treatment for patients with symptomatic gastroparesis. In this review, we summarize the results of the published GpCRC studies as a ready and convenient resource for gastroenterologists and others to provide a clear understanding of the consortium’s experience and perspective on gastroparesis and related disorders.
Keywords: Gastroparesis, Functional Dyspepsia, Motility Disorders, Clinical Trials
Introduction
The Gastroparesis Clinical Research Consortium (GpCRC) is a coalition of academic centers funded by the National Institutes of Diabetes and Digestive and Kidney Disorders (NIDDK) to advance the understanding and treatment of gastroparesis (see supplement for list of investigators and criteria for eligibility). We have enrolled approximately 1400 participants to date, with both delayed and normal emptying, in an approximately 3:1 ratio. Because of the tertiary nature of the practices in the consortium, extrapolation to patients in the community should be made with caution.
Clinical characterization and outcome studies
Idiopathic gastroparesis (IG) accounts for nearly two-thirds of all cases in our registries, with the rest being approximately equally split between Type 1 and Type 2 diabetes mellitus (DG); this distribution is similar to that reported by other referral centers but different than community-based studies, where the ratio is reversed. Nearly 90% of patients with IG are female, a proportion that is significantly higher than in the DG group; the average age is 40 years although T2DM patients were older, around 53 years.1 Average percentage gastric retention in the gastroparesis cohort is 65 and 32 at 2 and 4 hours, respectively.2 The majority (61%) of patients had moderate (compensated) disease; severe illness (requiring non-oral nutritional support) was seen in about 22%, with the rest having mild symptoms. Total hospitalizations at baseline averaged 1.8 per year with about 7% receiving total parenteral nutrition and 6% had an implanted gastric electrical stimulator.
Clinical symptoms
Nausea is the most common symptom (more than 95% of patients) but is the predominant symptom prompting evaluation in only about 30%. Upper abdominal pain is next as a predominant symptom (22%) followed by vomiting (15%).3 IG and DG are generally similar with only minor differences in terms of presenting symptoms. Abdominal pain, early satiety, and postprandial fullness are somewhat more prominent in IG, whereas patients with DG report more severe retching and vomiting; gastric emptying is most markedly delayed in type 1 DM.4 About 40% of patients reported using opioids with abdominal pain being the indication in 60%. Patients on opioids had more gastric retention and worse quality of life scores, more hospitalizations and use of antiemetic or pain modulator medications as compared with non-users.5
Table 1 summarizes the main features of the cardinal symptoms of gastroparesis.6–10 In addition, about 25% of patients with gastroparesis have moderate to severe symptoms of gastroesophageal reflux disease (GERD)11 which is reported as the main symptom in close to 10%.3 About two-thirds of patients meet Rome III criteria for irritable bowel syndrome (IBS) with a mixed bowel pattern seen in over half of these patients.3 Between 50-60% of patients with gastroparesis complained of moderate or severe/very severe constipation, which was reported to be the main symptom by about 5% of patients. On multivariable analysis, increasing severity of constipation was associated with increasing symptoms of gastroparesis. Other co-morbidities that are also common, particularly in IG include endometriosis (16%), migraine (41%) and cholelithiasis/gallbladder disease (35%).4
Table 1.
Major symptoms in gastroparesis and their characteristics
| Major symptom | Prevalence | Aggravating factors | Predictive factor for severe symptoms | Reference |
|---|---|---|---|---|
| Nausea | • >95% (similar in IG and DG) • Moderate or severe in two-thirds |
• Eating (two-thirds) • Hunger (one quarter) • Motion (one quarter) |
Positive: Satiety/fullness score (odds ratio, OR = 2.83), Negative: age (OR = 0.94), SF-36 mental (OR = 0.95) and SF-36 physical (OR = 0.96) |
6 |
| Vomiting | • DG: 80%; IG:57% • Severe in a third |
Meals (three-quarters) |
Positive: Satiety (OR = 2.17) and GERD (OR = 1.77) scores Negative: White race (OR = 0.2) and bloating scores (OR = 0.62) |
|
| Abdominal pain | • 90% (both IG and DG) • Severe or very severe in a third with daily pain in half • Interfering with sleep in about a third • 80% have acute episodes more than half the month • Most commonly in epigastrium, followed by periumblical region |
Half report worsening after a meal and about a quarter report improvement after eating |
Positive: GCSI (OR = 2.1), Beck Depression Inventory (OR = 1) scores Negative: Age (OR = 0.9, per 5-year increase) and white race (OR = 0.4). |
7, 8 |
| Early satiety | • Two-thirds • Severe or very severe in 50% |
Positive: Bloating (OR = 1.98), upper abdominal pain (OR = 1.55) scores; gastric retention at 4 hours (OR = 1.03). Negative: BMI (OR = 0.91) and female gender (OR = 0.29) |
9 | |
| Fullness | • Two-thirds • Severe or very severe in 60% |
Positive: Stomach visibly larger (OR = 1.62), upper abdominal pain (OR = 1.68) scores Negative: BMI (OR = 0.94), retching (OR = 0.52) scores |
||
| Bloating | • Three-quarters • Severe in 40% |
Positive: constipation (OR = 1.15) and lower abdominal pain (OR = 1.37) scores BMI (OR = 1.61). female gender (OR = 2.81) Negative: PAGI-QOL scores (OR = 0.39) and norepinephrine reuptake inhibitors |
10 |
Temporal and longitudinal patterns
An acute onset of symptoms was reported in about half of the patients in both IG and DG with an initial prodrome (food poisoning, gastroenteritis, respiratory symptoms) reported in 15% of cases.4 At the time of enrollment, only 5% of patients reported some improvement over time. A third of the patients described their symptoms as chronic with periodic exacerbations, and about the same proportion had progressive worsening.12 Other patterns reported were chronic but stable (21%) and cyclical, with periods of feeling well in between (13%).
Gastroparesis is an unremitting syndrome: only about a quarter (28%) of patients reported clinically meaningful symptomatic improvement (a change in GCSI score of 1 or more) in the first 48 weeks, a proportion that did not change for up to 4 years.11 Independent predictors of symptomatic improvement included age ≥ 50 years, an initial infectious prodrome, antidepressant use) and somewhat counter-intuitively, both a higher GCSI score and a 4-hour gastric retention > 20%. Negative predictors for improvement included cigarette smoking history, moderate to severe abdominal pain or neuromodulator use for pain, gastroesophageal reflux symptom severity, anxiolytic use and moderate to severe depression. These results emphasize the chronic nature of gastroparesis and potentially treatable factors that may improve outcomes.
Patients with IG and DG showed no significant differences in outcomes measured by PAGI-SYM scores;11 however, T1DM patients fared the worst, despite increased use of prokinetic, acid suppressant, anxiolytic, and gastric electrical stimulation therapy.13
Quality of life
Quality of life is significantly diminished in patients with gastroparesis, as shown in Table 2.12 These findings, which may be worse than other chronic GI conditions such as inflammatory bowel disease,11 attest to the high burden of disease and also indicate possible targets for intervention. Nearly half of patients also have moderate-to-severe depression scores, and considerably more than half have clinically significant anxiety scores.14 This level of psychological co-morbidity is not unexpected and likely is a consequence of considerable physical suffering. Nevertheless, only 40% of patients with significant depression received antidepressant medication and given that the severity of depression is associated with a worse quality of life, this represents a large unmet need that should be identified and addressed.
Table 2.
Effects of gastroparesis on quality of life by various measures and predictors of the same12
| Measure | Idiopathic | T1DM | T2DM | All | Contributing factors by multiple logistic analysis |
|---|---|---|---|---|---|
| SF-36 physical | • Increased nausea/vomiting subscore • Increased upper abdominal pain subscore • Higher total number of comorbidities • Use of narcotic pain medications • Acute onset of symptom • IBS by Rome III criteria • Older age |
||||
| Total | 33.9 (10.5) | 32.7 (10.9) | 32.0 (10.2) | 33.3 (10.5) | |
| Score <30 | 39% | 42% | 44% | 41% | |
| SF-36 mental | • Diabetic etiology • Beck Depression Inventory score • State Anxiety score |
||||
| Total | 39.7 (12.8) | 36.3 (12.7) | 38.7 (13.6) | 38.9 (13.0) | |
| Score <30 | 23% | 35% | 29% | 26% | |
| PAGI-QOL | • Higher fullness subscore • Higher bloating subscore • Higher upper abdominal pain subscore • Increased depression score • Increased Trait anxiety score Smoking cigarettes • Need for nutritional support • Chronic symptoms with progressive worsening • Periodic exacerbations • Some improvement over time |
||||
| Total | 2.6 (1.1) | 2.5 (1.2) | 2.7 (1.2) | 2.6 (1.1) | |
| Score <2.6 | 51% | 52% | 44% | 50% | |
Nutrition
As expected, the symptoms of gastroparesis interfere with the ability to eat the average USDA recommended diet; overall caloric intake is reduced, averaging only 1168 kcal/day, representing 58% of daily total energy requirements.15 The average number of daily meals was only 1.4 with small food portions reported in about a third. Carbohydrates represented nearly 50% of daily calories while proteins were at 16%; fat intake was surprisingly high (37% of total calories with only 10% of patients reporting a low-fat diet) given the association with worse nausea, but may represent an attempt to maximize calories with the smallest volume of food. Based on intake questionnaires, many vitamin and mineral deficits were inferred, particularly for vitamins C (49%), D (61%), E (80%), and K (56%), folate (68%), calcium (70%), iron (69%), magnesium (72%), and potassium (86%). In nearly two-thirds of patients, the reported diet was estimated to be calorically deficient (<60% of daily total energy requirements or TEE). The average body mass index (BMI) of these patients was similar to those with non-deficient caloric intake suggesting that either the patients were underreporting their intake or had a higher premorbid weight than their counterparts. On multiple logistic regression only bloating and constipation were positively associated with an energy deficient diet.
Surprisingly, only about a third of all patients (and only a quarter of idiopathic cases) had received a nutritional consultation after the onset of gastroparesis. Patients receiving nutritional consultation were 1.5 times more likely to have their daily caloric intake reach 85% or more of TEE, although this difference did not quite reach statistical significance (P = .08).
The paradox of excessive weight
Despite the above, only about 10% of patients with IG are underweight (BMI <18.5), whereas 10% are overweight (BMI:25-30) and nearly 30% are obese (BMI: >30); the rest (about 40%) have BMIs in the normal range.16 Further, about half of patients had a stable body weight in the six months before enrollment, while the others reported either losing or gaining weight in roughly equal proportions. Although there were no significant changes in the overall GCSI score by baseline BMI category, a lesser proportion of overweight patients showed clinical improvement (as defined by a decrease of 1 or more in the GCSI) at 48 weeks. When followed prospectively, about half the patients in the cohort maintained their weight (within 5% of baseline) while 30% gained weight and roughly 20% lost weight over the next 48 weeks. Independent predictors of weight gain included caloric consumption, constipation, and having “lower” abdominal pain less often, with early satiety appearing to be an independent negative predictor. Patients who gained weight consumed more calories, used opioids less often and somewhat paradoxically, had greater gastric retention (an association that remains unexplained).
Gender and ethnicity
Etiologies, symptom severity, and treatments vary among races, ethnicities, and sexes.17 A significantly higher proportion of women had IG (69% versus 46% in men). Gastric retention rates were not different between gender groups. By logistic regression women had more severe symptoms based on total GCSI with significant differences seen in bloating and postprandial fullness subscores but not in nausea subscores. However, a lower proportion of women are hospitalized as compared to men (39% versus 53%). Premenopausal women had a lower BMI on average but higher nausea subscores as compared with postmenopausal patients.
Gastric emptying was similar amongst racial/ethnic groups.17 DG was more common in both non-Hispanic blacks and Hispanics (about 60%) as compared with non-Hispanic whites (28%). Amongst diabetic patients, Hispanics had the highest HbA1c levels (8.8), followed by blacks (8.2) and non-Hispanic whites (7.8). On average, black patients were the youngest by age but also had the highest BMI (30.3, compared to 27.7 and 27 in Hispanics and whites, respectively) and the highest hospitalization rates within the past year (66%, compared to 48% and 38% in Hispanics and whites, respectively). Consistent with this, black patients also had the highest rates of PICC line insertion and TPN use.
It is not entirely clear whether any of these findings reflect cultural biases, socio-economic issues and access to health care or true biological/genetic differences although some evidence is beginning to emerge. The gene HMOX1 encodes for the enzyme heme oxygenase 1 (HO1), loss of which leads to loss of interstitial cells of Cajal (ICC) in animal experiments. Allele length may correlate inversely with HMOX1 expression and allele lengths were longer in blacks compared to other racial groups with the presence of 1 or 2 long polyGT repeat alleles associated with more severe nausea symptoms.18
The pathophysiological basis of symptoms
Gastric emptying
We first examined this question in a study that was restricted to idiopathic gastroparesis in which 4-hour scintigraphic retention of a solid meal was classified as mild (< 20%), moderate (>20% to 35%) and severe (>35%) and correlated with symptoms in 243 patients.1 About half had mild delay while the others had moderate or severe delay in roughly equal proportions. Only vomiting, loss of appetite and total GCSI severity were different in the two groups by logistic regression analysis. Subsequent papers from the consortium combined diabetic and idiopathic groups and the correlations between gastric emptying and severity of symptoms are less clear or non-existent, as shown in Table 3. 6, 10 8, 12
Table 3.
Correlation between gastric emptying and symptoms emptying and symptoms
| Subcategories | Gastric retention at 2 hours | Gastric retention at 4 hours | Reference | |
|---|---|---|---|---|
| Nausea severity | None/very mild/mild | 63.6 (17.2) | 29.5 (19.8) | 6 |
| Moderate | 59.7 (15.6) | 23.5 (14.2) | ||
| Severe/very severe | 66.2 (18.0) | 34.6 (20.4) | ||
| p-value for trend | NS | NS | ||
| Vomiting severity | None | 64.8 (16.9) | 29.4 (19.4) | |
| Very mild/mild/moderate | 61.2 (16.5) | 26.6 (14.7) | ||
| Severe | 64.7 (20.1) | 39.8 (24.2) | ||
| p-value for trend | NS | NS | ||
| Bloating severity | Lowest (0-1.9) | 64.1 (59.7 – 68.5) | 34.7 (28.6 – 40.8) | 10 |
| Intermediate (2-3.9) | 64.1 (60.7 – 67.6) | 33.4 (29.5 – 37.4) | ||
| Highest (≥4.0) | 65.5 (62.6 – 68.5) | 30.9 (27.3 – 34.6) | ||
| p-value (ANOVA) | NS | NS | ||
| Upper abdominal pain severity | None | 66.3 (17.4) | 31.3 (22.0) | 8 |
| Very mild/mild/moderate | 65.6 (16.4) | 31.9 (22.0) | ||
| Severe | 65.4 (18.8) | 32.6 (21.3) | ||
| p-value (ANOVA) | NS | NS | ||
| SF-36 Physical | ≤30 | 64.3 (18.6) | 65.4 (17.6) | 12 |
| >30 | 33.6 (22.2) | 31.5 (21.9) | ||
| p-value (T-test) | NS | NS | ||
| SF-36 Mental | ≤30 | 65.1 (17.8) | 65.0 (18.1) | |
| >30 | 34.0 (20.9) | 31.7 (22.4) | ||
| p-value (T-test) | NS | NS | ||
| PAGI-QOL | <2.6 | 65.7 (18.0) | 64.3 (18.0) | |
| >2.6 | 33.1 (21.4) | 31.6 (22.6) | ||
| p-value (T-test) | NS | NS |
As a more powerful method to test this relationship, we also looked for temporal variations in emptying in individual patients and assessed corresponding changes in symptom severity, Gastric emptying and GCSI scores were examined at baseline and 48 weeks later in 101 patients with identical symptoms. Seventy-nine patients with delayed gastric emptying at baseline had normal gastric emptying at 48 weeks and 22 patients with normal emptying at baseline had delayed gastric emptying at 48 weeks. Regardless of the magnitude and direction of the change in gastric emptying, a corresponding change in symptom scores was not seen.2
A delay in gastric emptying may nevertheless serve as a biomarker of systemic complications in diabetes. Diabetic patients with delayed emptying (as compared with those with normal emptying) have an increased prevalence of retinopathy (36% vs 10%; P= .006) and number of diabetic triopathies (retinopathy, neuropathy and nephropathy; 1.0 vs 0.5; P= .009).19 The relationship between delayed gastric emptying and the clinical manifestations of gastroparesis is therefore more nuanced than what has traditionally been assumed. Severe delays in gastric emptying are more likely to be associated with vomiting but it appears that a delay in gastric emptying by itself cannot satisfactorily account for the entire spectrum of symptoms, their variance or quality of life.
Gastric accommodation
Water load satiety testing (WLST) measures the volume of water consumed until the patient reports a sense of being completely full and may be considered as a surrogate for gastric accommodation. Different grades of severity of early satiety and postprandial fullness correlated well with average maximum ingested volumes.9 To measure gastric accommodation more directly, we examined intragastric meal distribution (IMD) during routine scintigraphy as a simple measure that quantifies the distribution of the meal in the proximal versus distal gastric segments. In a study of 177 patients with symptoms of gastroparesis of which a quarter had normal emptying, low IMD (implying impaired fundal accommodation) was significantly associated with increased early satiety but not nausea, vomiting, postprandial fullness, or upper abdominal pain.20 These findings, while preliminary, indicate that scintigraphy can yield additional pathophysiological information beyond simple emptying time.
Gastric rhythm
Electrogastrography (EGG) revealed either increases in brady- or tachygastria activity or a failure to increase normal 3 cycles per minute (cpm) gastric myoelectrical activity (GMA) after ingestion of test meals.21, 22 Reproducible GMA responses were recorded at baseline and 48 weeks in patients with diabetic gastroparesis: 84% had gastric dysrhythmias and 16% had normal 3 cpm GMA.21
Autonomic function
Given the role of the autonomic nervous system (ANS) in the monitoring and regulation of gastrointestinal motility, we examined its function using power spectral analysis of heart rate variability in 242 subjects (nearly 75% IG) with typical symptoms of gastroparesis, including a subgroup with normal gastric emptying.23 Although diabetics exhibited greater global autonomic dysfunction, sympathetic withdrawal (low sympathetic response to a sympathetic challenge) was the most common abnormality found in both groups. Only 4 patients met formal criteria for postural tachycardia syndrome (POTS). Patients with delayed gastric emptying were more likely to have parasympathetic dysfunction than those with normal gastric emptying. Similarly, patients with more severe symptoms exhibited greater parasympathetic dysfunction compared to those with mild-moderate symptoms, who had more sympathetic hypofunction, supporting a possible pathophysiological role for autonomic dysfunction in gastroparesis.
Non-gastric motility
In a study of nearly 200 patients with typical symptoms of gastroparesis wireless motility capsule (WMC) testing showed that about a third of patients had impaired colonic transit and about 15% had delayed small bowel transit; slow transit was seen in both small and large bowel regions in 25% of patients.24 These numbers were similar regardless of delayed gastric emptying. Gastric emptying by WMC did not correlate with upper gastrointestinal symptoms (similar to scintigraphic assessment of emptying) but other regional abnormalities appeared to fare better. Constipation scores were higher in patients with delayed colonic transit; conversely, diarrhea scores were lower in patients with delayed small bowel as well as in those with delayed colonic transit. Patients in the upper half of the range of colon contraction numbers on WMC had more severe constipation and interestingly also higher upper and lower abdominal pain scores, as compared with those in the lower half of the range. This study suggests that extra-gastric dysmotility may be relatively common in gastroparesis and could indicate a more generalized problem with the enteric nervous system. Further, it suggests that treatment that is directed at other regions of the gut may be important to mitigate at least some of their symptoms.
Pathological and molecular changes
Studying the pathological basis of this syndrome has been one of the foremost priorities of the GpCRC, using carefully collected full-thickness gastric tissue from patients undergoing elective surgery for placement of the gastric neurostimulation system or other interventions. Controls are collected from surgical patients undergoing bariatric surgery (BMI of 44 or less) at the Mayo Clinic. A caveat to accompany the interpretation of these results is that the samples were usually obtained from patients with refractory symptoms and thus may not reflect the changes in patients with milder or earlier stages of the illness.
Neuronal changes.
By light microscopy, significant neuronal changes were only found in a subset of patients (Figure 1).25 However, these numbers may underestimate neuronal damage as revealed by electron microscopy which shows neuronal injury in additional IG patients (damaged cell bodies, mitochondria and nerve endings).26 Neuronal changes were less prominent in DG where they seemed to primarily affect the nerve endings, sparing nerve bodies. Neuronal subtypes (neuronal nitric oxide synthase/nNOS, substance P/SP, vasoactive intestinal peptide/VIP, tyrosine hydroxylase/TH) as analyzed by quantitative immunohistochemistry did not reveal any significant differences when the IG, DG and control groups were compared together.25
Figure 1:
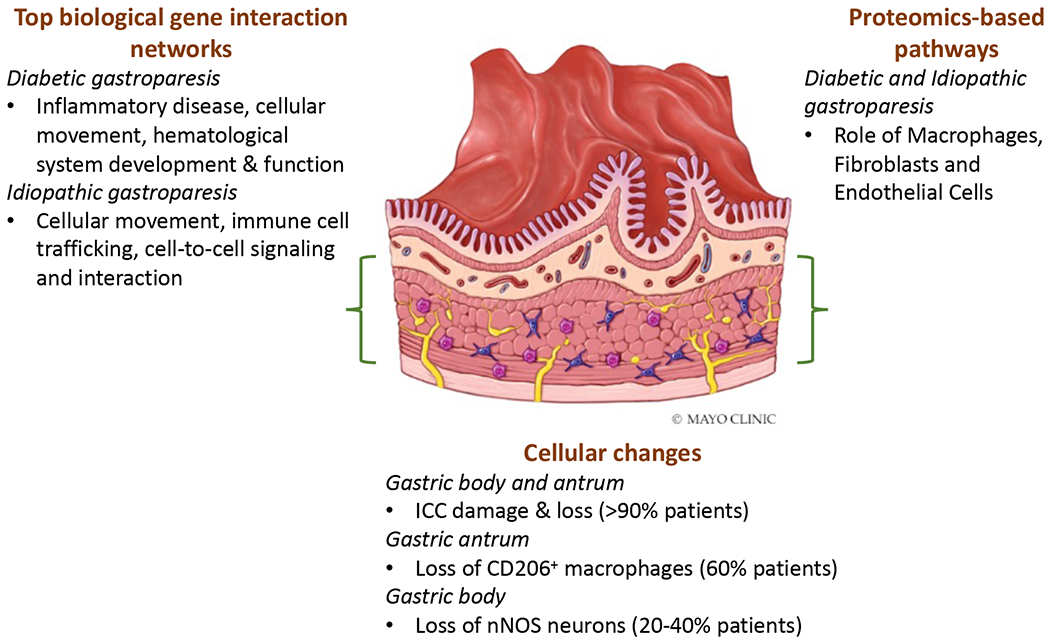
Summary of cellular, transcriptomic, and proteomic analysis of full thickness gastric tissue conducted by the GpCRC.
Changes in interstitial cells of Cajal (ICC).
Loss of ICC appears to be the most obvious and dominant pathological feature in the gastric enteric nervous system (ENS) of patients with both DG and IG. Quantification of ICC number (cell bodies per microscopic field) showed significant overall differences between disease and controls gastric body specimens, with no difference between diabetic and idiopathic groups.25 Substantial (>50%) loss of ICC was found in 50% of patients in both groups. Electron microscopy revealed injury to ICC in almost all gastroparesis subjects.26 A striking feature was the loss of contact not only amongst the ICC themselves but also with nerves and muscle. Given the central role of ICC in generating the electrical rhythm and in mediating neuromuscular communication, such loss is expected to disrupt gastric motility. In a subsequent study, it was found that ICC loss was even more profound in the gastric antrum.27
We have also examined splice variants of Ano1, an ion channel thought to underlie classical Ca2+-activated Cl− currents in these cells. A novel variant, Ano1Δ1,2,3(5’), was identified from the gastric muscle of patients with DG.28 Expression of this variant in HEK cells produced a decreased density of Ca2+-activated Cl− currents that exhibit slower kinetics compared with the full-length Ano1. Expression of this variant was several-fold higher in diabetic as well as idiopathic gastroparesis, as compared with controls.
Muscular, glial and other changes.
Smooth muscle changes appear to be more subtle and of less certain significance.25 On ultrastructural examination the majority of smooth muscle cells appeared normal in both groups with the exception that there was continuous and marked thickening of the basal lamina, but this was almost exclusively seen in the diabetic group.26 Glial loss was seen in 10-15% of patients in both groups on visual assessment but ultrastructural abnormalities of glia were only observed in the idiopathic group. A prominent feature of both diabetic and idiopathic groups that was only revealed on electron microscopy was a marked increase in collagen fibrils in the connective tissue stroma, the true functional significance of which is open to speculation at this stage.26
Tissue macrophage responses.
In an early study, staining with CD68, a putative marker for macrophages and other phagocytic cells, suggested an increased number of these cells in the gastric body of patients with gastroparesis.25 In vitro, macrophages can be stimulated towards pro-inflammatory or anti-inflammatory types; the latter may be identified by staining for the marker CD206 (MRC1). In a subsequent study, which also included diabetic controls, loss of CD206 correlated with ICC loss, however, the CD206 cell count was not different between cases and controls.29 In contrast, in the gastric antrum (muscular and myenteric plexus layers), the CD206+ cells were significantly reduced in gastroparesis and correlated with ICC counts.27
We have also performed deep transcriptomic analysis of the gastric body and a more limited proteomic analysis of the gastric antrum.30, 31 A key observation was unique as well as overlapping protein changes for DG and IG. Functional annotation of these molecular changes confirmed that macrophage roles were amongst the top pathways, along with fibroblasts and endothelial cells. It was remarkable that a few molecules related to inflammation (such as prostaglandins, complement pathway proteins) did appear to correlate with gastric emptying delay.
Thus, while much more needs to be learned to validate these cellular and molecular changes, particularly in cohorts that capture the spectrum of disease severity, it appears reasonable to assume that an aberrant macrophage response in the gastric wall could be an important initiator of pathology. In support of this hypothesis, we examined variants in the HMOX-1, a gene that encodes heme oxygenase 1 (HO1) which is expressed in CD206+ alternatively activated macrophages in mice. Polymorphisms in HMOX1 have also been implicated in some human diseases and downregulation of HMOX1 expression has been shown to play a causal role in gastroparesis in animal models. We found that polyGT alleles of HMOX1 were longer in patients with gastroparesis compared to non-diabetic controls and longest in type 2 diabetics with gastroparesis.18
Physiological correlates of cellular changes
Putatively, pathological or molecular findings should correlate with some of the clinical or physiological phenotypes. An important observation was that loss of ICC correlates with the degree of delay in gastric emptying in diabetic gastroparesis patients.25 As stated before, ICC numbers in turn correlated with CD206+ macrophage numbers.29 We also found a few significant correlations between genetics (HMOX1) and specific proteins identified by proteomic analysis and gastric emptying or symptoms in subsets of patients.18, 30 However, these results should be considered preliminary and hypothesis-generating at best for several reasons. The number of patients/samples is small, many of the pathological measures are relatively gross and there is inherent (and unpredictable) variability in some of the measures used to phenotype patients (such as gastric emptying). Nevertheless, several intriguing associations have emerged that set the stage for larger validation studies.
The relationship between gastroparesis and functional dyspepsia
Gastric dysmotility commonly results in chronic nausea and vomiting and, when associated with delayed gastric emptying for solids in the absence of mechanical obstruction, is called gastroparesis. However, in one of the first GpCRC publications, we showed that patients with similar symptoms, but normal emptying are clinically indistinguishable from those with delayed gastric emptying or gastroparesis.32 Currently, there is no consensus on the best terminology to use when describing this group of patients. After application of ROME III criteria, several overlapping categories emerge: the majority (87%) are classified as functional dyspepsia (FD);32 further analysis of this group showed that 95% were in the postprandial distress subtype while 68% were in the epigastric pain subtype. Other relevant diagnoses within this group of patients revealed multiple overlapping categories (chronic idiopathic nausea, 43%; functional vomiting, 30%; cyclic vomiting syndrome, 36%).2 Thus there is no single satisfactory term to use and the similarity to gastroparesis questions the utility of additional attempts at nomenclature based on symptoms alone.
We subsequently collected and analyzed prospective data from a total of 981 patients enrolled over 12 years: 73% (720/981) of whom met criteria for gastroparesis on scintigraphy while 25% (224/944) had normal emptying and met the criteria for FD/PDS and 4% (37/981) were excluded from the study due to having normal emptying without being classified as FD/PDS.2 Our results, summarized in Figure 2, are notable in many ways: first, patients with functional dyspepsia and gastroparesis are very similar in terms of physical and mental scores, as well as other quality of life measures. Secondly, the clinical course over 48 weeks of patients with gastroparesis and FD is also similar, with little or no significant improvement in either group. Third, and most importantly, the neuropathology of the stomach in patients with functional dyspepsia is similar to that of gastroparesis, with loss of ICC and CD206+ macrophages seen in both. Given these findings we questioned the ability of gastric emptying as a true marker to distinguish these groups. Indeed, we found that the diagnosis of gastroparesis or functional dyspepsia based on gastric emptying is labile over time, can move in both directions and has no impact on change in symptoms. Since FD/PDS and gastroparesis share characteristic pathologic features, we propose that patients with chronic unexplained nausea along with other features of gastroparesis (early satiety, fullness, bloating and pain) be grouped together as gastric neuromuscular disorders (GND), regardless of their gastric emptying status. This will provide a new and more rational framework to approach these patients in terms of pathophysiology and treatment. Further studies can then be performed to determine if patients with gastric emptying abnormalities in this group are meaningfully different than those without.
Figure 2:

Summary of the relationship between gastroparesis and functional dyspepsia showing similar myenteric pathology, the lability of gastric emptying without a change in symptoms or Rome III classification.
Therapeutic Trials
Given the large clinical burden and the lack of adequate therapies, the GpCRC has prioritized trials of drugs for symptomatic relief.
The NORIG trial.
In this first adequately powered randomized clinical trial of a neuromodulator in IG, nortriptyline, compared to placebo (n = 65 in each group), did not improve overall symptoms over 15 weeks of the study as assessed by the primary outcome measure of a decrease in overall GCSI scores, or any of the PAGI-SYM subscales with the exception of an improvement in GCSI inability to finish a meal component (P = .05).33 Using alternative scoring systems, some improvements were seen in secondary outcomes such as GSRS (Global Symptom Rating Scale) abdominal pain score and CGPI (Clinical Global Patient Impression) scores. Notably for trials in motility disorders, the placebo response was very low (21%).
The APRON trial.
The neurokinin-1 receptor which recognizes substance P is expressed in brain stem centers regulating nausea and vomiting and has emerged as a major target for the treatment of chemotherapy and post-operative nausea. In a randomized multicenter, double-masked 4-week trial of aprepitant (125 mg daily by mouth) versus placebo, the primary endpoint using a daily visual analog scale, was not met.22 However, with the more disease targeted, validated gastroparesis-specific 0-5 GCSI scale, aprepitant resulted in significant improvement as compared with placebo in nausea, vomiting and retching. This was accompanied by a significant decline in the number of daily hours of nausea as well as an increase in the number of nausea-free days. Aprepitant treatment was also accompanied by a decrease in the severity of several other GSCI symptoms, including fullness, bloating, GERD and abdominal pain. Satiety test results showed a significant improvement in post-meal tachygastria in aprepitant, but maximum tolerated liquid caloric volumes remained the same between groups. While the APRON study (using aprepitant) failed its primary endpoint, the improvements in the secondary endpoints appeared to be clinically meaningful and other studies need to be done to confirm these.
The GLUMIT-DG trial.
Tight glycemic control in diabetic patients with gastroparesis has generally been avoided due to concerns over erratic caloric absorption and hypoglycemia. In a prospective open label study, we examined the effects of continuous subcutaneous insulin infusion (CSII) along with continuous glucose monitoring (CGM) in 45 diabetic gastroparesis patients (29% with Type 1) who were poorly controlled with HgbA1c>8%.34 Compared to the baseline period, CSII plus CGM appeared to be safe and effective. During the 24-week period of this trial, the time in hypoglycemia (<70 mg/dL) decreased, time in euglycemia increased, time in severe hyperglycemia (>300 mg/dL) decreased, and hemoglobin A1c decreased by slightly over 1 unit on average. GCSI symptom scores also decreased with lower nausea/vomiting, fullness/early satiety, and bloating/distention scores, accompanied by improvement in PAGI Quality-of-Life scores. Finally, volumes of liquid nutrient meals tolerated increased. This study supports the safety, feasibility, and potential benefits of improving glycemic control in DG and should change the previous paradigm of more conservative treatments.
Pragmatic Trials Conducted by the GpCRC
The consortium has performed meaningful observational studies on patients that are followed prospectively with validated instruments, using propensity score methods to control for imbalances in patient characteristics between comparison groups.
Gastric electric stimulation.
The effectiveness of gastric electrical stimulation (GES) for gastroparesis was studied in patients enrolled in the gastroparesis registry.35 The results from the prospectively collected database of GpR & GpR2 showed that GES patients (including both IG and DG) at enrollment were graded as clinically worse when compared with the non-GES patients. Their 48-week outcome data were compared with 238 patients not receiving GES. When adjusting for patient characteristics, global symptom scores were smaller and not statistically significant. However, nausea improved by ≥ 1 point (RR = 1.31; P = .04). These outcomes are similar to randomized controlled trials that have shown mixed results on global symptom reduction with electrical stimulation, with the most consistent effects on nausea.
Domperidone.
We studied the clinical course of patients who only initiated domperidone therapy during 96 weeks of enrollment in our registry (patients who had previously used the drug or were using the drug at enrollment were excluded).36 For controls we used patients who never used domperidone before or after enrollment. A total of 748 patients with delayed and normal emptying were included of which 63% had idiopathic gastroparesis; 24% (181) were in the domperidone group. After adjustment for 22 covariates, propensity analysis showed relatively small but significant declines from baseline in the domperidone group in GCSI total score, nausea, fullness, upper abdominal, GERD and PAGI-QOL scores. Participants had not experienced significant cardiovascular or other possible domperidone-related complications during follow-up. Although not a randomized trial, this is the largest study of domperidone in the US patient population and supports the global experience of its utility in patients with gastroparesis and related disorders.
Conclusions and Future Directions
As we have summarized here, the GpCRC has been a powerful tool to advance our understanding of gastroparesis. The consortium has provided a detailed understanding of symptomatology, the considerable burden of illness, its longitudinal course, physiological and pathological correlates. We have conducted trials of interventions that provide optimism for the development of more effective drugs and approaches. While much more needs to be learned about the pathological and molecular basis of gastroparesis, our results establish a firm foundation for testing multiple hypotheses and provided new insight into how the enteric nervous system and its associated macrophages may interact to produce disease, setting the stage for disease modifying therapeutics. Finally, we have shown that gastroparesis shares its clinico-pathological spectrum with patients who meet Rome (II and III) criteria for functional dyspepsia, thus impacting a much larger section of the population when seen through the unifying perspective of related gastric neuromuscular disorders (GND). Future studies proposed by the consortium will provide answers to additional questions, including the utility of gastric peroral endoscopic myotomy (GPOEM), the effects of macrophage-targeted therapies for gastroparesis, changes in the microbiome, additional proteomic and RNA-seq studies to further understand the pathogenesis of gastroparesis and develop novel biomarkers, the role of endoscopic full thickness biopsies, and the pathophysiology and clinical course of patients with FD/EPS (epigastric pain syndrome).
Supplementary Material
Acknowledgements
We would like to acknowledge the hard work and dedication of the GpCRC research coordinators: Robert Burns, Guillermo Barahona, Luisa Geovanna Villatoro De Barahona, Megan McKnight (Johns Hopkins University School of Medicine, Baltimore, MD), Amiya Palit, Paul J. Silver (Temple University, Philadelphia, PA), Natalia Vega, Denise Vasquez, Karina Espino (Texas Tech University, El Paso, TX), Heather Charron (Baylor College of Medicine, Houston, TX), April Mendez, Hannah Konkel, Andrew Bolender (Massachusetts General Hospital, Boston, MA), Margaret Breen-Lyles (Mayo Clinic, Rochester, MN), Olivia Henry, Karen Beatty, Ronna Howard, Tachisha Walls, Bridget Canno (University of Louisville, Louisville, KY), Anya Brown, Amirah Abdullah, Lynn Baxter, Paula Stuart (Wake Forest University, Winston-Salem, NC)
The Gastroparesis Clinical Research Consortium (GpCRC) is supported by the National Institute of Diabetes and Digestive and Kidney Diseases (NIDDK) at the National Institutes of Health (NIH) (grants U01DK112193, U01DK112194, U01DK073983, U01DK073975, U01DK074035, U01DK074007, U01DK073974, U01DK073983, U24DK074008) and the National Center for Advancing Translational Sciences (NCATS) (grants UL1TR000424, UL1TR000135).).
Footnotes
Publisher's Disclaimer: This is a PDF file of an unedited manuscript that has been accepted for publication. As a service to our customers we are providing this early version of the manuscript. The manuscript will undergo copyediting, typesetting, and review of the resulting proof before it is published in its final form. Please note that during the production process errors may be discovered which could affect the content, and all legal disclaimers that apply to the journal pertain.
Conflict of Interest. The authors declare that there are no conflict of interests in this study.
Contributor Information
Pankaj J. Pasricha, Johns Hopkins University School of Medicine, Baltimore, MD
Madhusudan Grover, Mayo Clinic, Rochester, MN.
Katherine P. Yates, Johns Hopkins University, Baltimore, MD)
Thomas L. Abell, University of Louisville, Louisville, KY
Kenneth L. Koch, Wake Forest University, Winston-Salem, NC
Richard W McCallum, Texas Tech University, El Paso, TX.
Irene Sarosiek, Texas Tech University, El Paso, TX.
Cheryl E. Bernard, Mayo Clinic, Rochester, MN
Braden Kuo, Massachusetts General Hospital, Boston, MA.
Robert Bulat, Johns Hopkins University School of Medicine, Baltimore, MD.
Robert Shulman, Baylor College of Medicine, Houston, TX.
Bruno P. Chumpitazi, Baylor College of Medicine, Houston, TX
James Tonascia, Johns Hopkins University, Baltimore, MD.
Laura A. Miriel, Johns Hopkins University, Baltimore, MD
Laura A. Wilson, Johns Hopkins University, Baltimore, MD
Mark L Van Natta, Johns Hopkins University, Baltimore, MD.
Emily Mitchell, Johns Hopkins University, Baltimore, MD.
Frank Hamilton, National Institute of Diabetes and Digestive and Kidney Diseases, Bethesda, MD.
Gianrico Farrugia, Mayo Clinic, Rochester, MN.
Henry P. Parkman, Temple University, Philadelphia, PA
References
- 1.Parkman HP, Yates K, Hasler WL, et al. Clinical features of idiopathic gastroparesis vary with sex, body mass, symptom onset, delay in gastric emptying, and gastroparesis severity. Gastroenterology 2011;140:101–15. [DOI] [PMC free article] [PubMed] [Google Scholar]
- 2.Pasricha PJ, Grover M, Yates KP, et al. Functional Dyspepsia and Gastroparesis in Tertiary Care are Interchangeable Syndromes With Common Clinical and Pathologic Features. Gastroenterology 2021;160:2006–2017. [DOI] [PMC free article] [PubMed] [Google Scholar]
- 3.Parkman HP, Sharkey E, McCallum RW, et al. Constipation in Patients With Symptoms of Gastroparesis: Analysis of Symptoms and Gastrointestinal Transit. Clin Gastroenterol Hepatol 2020. [DOI] [PMC free article] [PubMed] [Google Scholar]
- 4.Parkman HP, Yates K, Hasler WL, et al. Similarities and differences between diabetic and idiopathic gastroparesis. Clin Gastroenterol Hepatol 2011;9:1056–64; quiz e133-4. [DOI] [PMC free article] [PubMed] [Google Scholar]
- 5.Hasler WL, Wilson LA, Nguyen LA, et al. Opioid Use and Potency Are Associated With Clinical Features, Quality of Life, and Use of Resources in Patients With Gastroparesis. Clin Gastroenterol Hepatol 2019;17:1285–1294 e1. [DOI] [PMC free article] [PubMed] [Google Scholar]
- 6.Parkman HP, Hallinan EK, Hasler WL, et al. Nausea and vomiting in gastroparesis: similarities and differences in idiopathic and diabetic gastroparesis. Neurogastroenterol Motil 2016;28:1902–1914. [DOI] [PMC free article] [PubMed] [Google Scholar]
- 7.Hasler WL, Wilson LA, Parkman HP, et al. Factors related to abdominal pain in gastroparesis: contrast to patients with predominant nausea and vomiting. Neurogastroenterol Motil 2013;25:427–38, e300-1. [DOI] [PMC free article] [PubMed] [Google Scholar]
- 8.Parkman HP, Wilson LA, Hasler WL, et al. Abdominal Pain in Patients with Gastroparesis: Associations with Gastroparesis Symptoms, Etiology of Gastroparesis, Gastric Emptying, Somatization, and Quality of Life. Dig Dis Sci 2019;64:2242–2255. [DOI] [PMC free article] [PubMed] [Google Scholar]
- 9.Parkman HP, Hallinan EK, Hasler WL, et al. Early satiety and postprandial fullness in gastroparesis correlate with gastroparesis severity, gastric emptying, and water load testing. Neurogastroenterol Motil 2017;29. [DOI] [PMC free article] [PubMed] [Google Scholar]
- 10.Hasler WL, Wilson LA, Parkman HP, et al. Bloating in gastroparesis: severity, impact, and associated factors. Am J Gastroenterol 2011;106:1492–502. [DOI] [PMC free article] [PubMed] [Google Scholar]
- 11.Pasricha PJ, Yates KP, Nguyen L, et al. Outcomes and Factors Associated With Reduced Symptoms in Patients With Gastroparesis. Gastroenterology 2015;149:1762–1774 e4. [DOI] [PMC free article] [PubMed] [Google Scholar]
- 12.Parkman HP, Wilson LA, Yates KP, et al. Factors that contribute to the impairment of quality of life in gastroparesis. Neurogastroenterol Motil 2021:e14087. [DOI] [PMC free article] [PubMed] [Google Scholar]
- 13.Koch KL, Hasler WL, Yates KP, et al. Baseline features and differences in 48 week clinical outcomes in patients with gastroparesis and type 1 vs type 2 diabetes. Neurogastroenterol Motil 2016;28:1001–15. [DOI] [PMC free article] [PubMed] [Google Scholar]
- 14.Hasler WL, Parkman HP, Wilson LA, et al. Psychological dysfunction is associated with symptom severity but not disease etiology or degree of gastric retention in patients with gastroparesis. Am J Gastroenterol 2010;105:2357–67. [DOI] [PMC free article] [PubMed] [Google Scholar]
- 15.Parkman HP, Yates KP, Hasler WL, et al. Dietary intake and nutritional deficiencies in patients with diabetic or idiopathic gastroparesis. Gastroenterology 2011;141:486–98, 498 e1-7. [DOI] [PMC free article] [PubMed] [Google Scholar]
- 16.Parkman HP, Van Natta M, Yamada G, et al. Body weight in patients with idiopathic gastroparesis. Neurogastroenterol Motil 2021;33:e13974. [DOI] [PMC free article] [PubMed] [Google Scholar]
- 17.Parkman HP, Yamada G, Van Natta ML, et al. Ethnic, Racial, and Sex Differences in Etiology, Symptoms, Treatment, and Symptom Outcomes of Patients With Gastroparesis. Clin Gastroenterol Hepatol 2019;17:1489–1499 e8. [DOI] [PMC free article] [PubMed] [Google Scholar]
- 18.Gibbons SJ, Grover M, Choi KM, et al. Repeat polymorphisms in the Homo sapiens heme oxygenase-1 gene in diabetic and idiopathic gastroparesis. PLoS One 2017;12:e0187772. [DOI] [PMC free article] [PubMed] [Google Scholar]
- 19.Parkman HP, Wilson LA, Farrugia G, et al. Delayed Gastric Emptying Associates With Diabetic Complications in Diabetic Patients With Symptoms of Gastroparesis. Am J Gastroenterol 2019;114:1778–1794. [DOI] [PMC free article] [PubMed] [Google Scholar]
- 20.Orthey P, Yu D, Van Natta ML, et al. Intragastric Meal Distribution During Gastric Emptying Scintigraphy for Assessment of Fundic Accommodation: Correlation with Symptoms of Gastroparesis. J Nucl Med 2018;59:691–697. [DOI] [PMC free article] [PubMed] [Google Scholar]
- 21.Koch KL, Hasler WL, Van Natta M, et al. Satiety testing in diabetic gastroparesis: Effects of insulin pump therapy with continuous glucose monitoring on upper gastrointestinal symptoms and gastric myoelectrical activity. Neurogastroenterol Motil 2020;32:e13720. [DOI] [PMC free article] [PubMed] [Google Scholar]
- 22.Pasricha PJ, Yates KP, Sarosiek I, et al. Aprepitant Has Mixed Effects on Nausea and Reduces Other Symptoms in Patients With Gastroparesis and Related Disorders. Gastroenterology 2018;154:65–76 e11. [DOI] [PMC free article] [PubMed] [Google Scholar]
- 23.Nguyen L, Wilson LA, Miriel L, et al. Autonomic function in gastroparesis and chronic unexplained nausea and vomiting: Relationship with etiology, gastric emptying, and symptom severity. Neurogastroenterol Motil 2020;32:e13810. [DOI] [PMC free article] [PubMed] [Google Scholar]
- 24.Hasler WL, May KP, Wilson LA, et al. Relating gastric scintigraphy and symptoms to motility capsule transit and pressure findings in suspected gastroparesis. Neurogastroenterol Motil 2018;30. [DOI] [PMC free article] [PubMed] [Google Scholar]
- 25.Grover M, Farrugia G, Lurken MS, et al. Cellular changes in diabetic and idiopathic gastroparesis. Gastroenterology 2011;140:1575–85 e8. [DOI] [PMC free article] [PubMed] [Google Scholar]
- 26.Faussone-Pellegrini MS, Grover M, Pasricha PJ, et al. Ultrastructural differences between diabetic and idiopathic gastroparesis. J Cell Mol Med 2012;16:1573–81. [DOI] [PMC free article] [PubMed] [Google Scholar]
- 27.Grover M, Bernard CE, Pasricha PJ, et al. Diabetic and idiopathic gastroparesis is associated with loss of CD206-positive macrophages in the gastric antrum. Neurogastroenterol Motil 2017;29. [DOI] [PMC free article] [PubMed] [Google Scholar]
- 28.Mazzone A, Bernard CE, Strege PR, et al. Altered expression of Ano1 variants in human diabetic gastroparesis. J Biol Chem 2011;286:13393–403. [DOI] [PMC free article] [PubMed] [Google Scholar]
- 29.Bernard CE, Gibbons SJ, Mann IS, et al. Association of low numbers of CD206-positive cells with loss of ICC in the gastric body of patients with diabetic gastroparesis. Neurogastroenterol Motil 2014;26:1275–84. [DOI] [PMC free article] [PubMed] [Google Scholar]
- 30.Grover M, Dasari S, Bernard CE, et al. Proteomics in gastroparesis: Unique and overlapping protein signatures in diabetic and idiopathic gastroparesis. Am J Physiol Gastrointest Liver Physiol 2019. [DOI] [PMC free article] [PubMed] [Google Scholar]
- 31.Grover M, Gibbons SJ, Nair AA, et al. Transcriptomic signatures reveal immune dysregulation in human diabetic and idiopathic gastroparesis. BMC Med Genomics 2018;11:62. [DOI] [PMC free article] [PubMed] [Google Scholar]
- 32.Pasricha PJ, Colvin R, Yates K, et al. Characteristics of patients with chronic unexplained nausea and vomiting and normal gastric emptying. Clin Gastroenterol Hepatol 2011;9:567–76 e1-4. [DOI] [PMC free article] [PubMed] [Google Scholar]
- 33.Parkman HP, Van Natta ML, Abell TL, et al. Effect of nortriptyline on symptoms of idiopathic gastroparesis: the NORIG randomized clinical trial. JAMA 2013;310:2640–9. [DOI] [PMC free article] [PubMed] [Google Scholar]
- 34.Calles-Escandon J, Koch KL, Hasler WL, et al. Glucose sensor-augmented continuous subcutaneous insulin infusion in patients with diabetic gastroparesis: An open-label pilot prospective study. PLoS One 2018;13:e0194759. [DOI] [PMC free article] [PubMed] [Google Scholar]
- 35.Abell TL, Yamada G, McCallum RW, et al. Effectiveness of gastric electrical stimulation in gastroparesis: Results from a large prospectively collected database of national gastroparesis registries. Neurogastroenterol Motil 2019;31:e13714. [DOI] [PMC free article] [PubMed] [Google Scholar]
- 36.Sarosiek I, Van Natta M, Parkman HP, et al. Effect of Domperidone Therapy on Gastroparesis Symptoms: Results of a Dynamic Cohort Study by NIDDK Gastroparesis Consortium. Clin Gastroenterol Hepatol 2021. [DOI] [PMC free article] [PubMed] [Google Scholar]
Associated Data
This section collects any data citations, data availability statements, or supplementary materials included in this article.