

Abstract
Rationale & Objective:
Lower estimated glomerular filtration rate (eGFR) is associated with heart failure (HF) risk. However, eGFR based on cystatin C (eGFRcys) and creatinine (eGFRcr) may differ substantially within an individual. The clinical implications of these differences for risk of HF among persons with chronic kidney disease (CKD) are unknown.
Study Design:
Prospective cohort study.
Setting & Participants:
4,512 adults with CKD and without prevalent HF who enrolled in the Chronic Renal Insufficiency Cohort (CRIC) Study.
Exposure:
eGFRdiffcys-cr (eGFRcys minus eGFRcr).
Outcome:
Incident HF hospitalization.
Analytical Approach:
Fine-Gray proportional subhazards regression was used to investigate the associations of baseline, time-updated, and slope of eGFRdiffcys-cr with incident HF.
Results:
Of 4,512 participants, one-third had eGFRcys and eGFRcr values that differed by over 15 mL/min/1.73 m2. In multivariable-adjusted models, each 15 mL/min/1.73 m2 lower baseline eGFRdiffcys-cr was associated with higher risk of incident HF hospitalization (hazard ratio [HR]=1.20; 95% CI: 1.07-1.34). In time-updated analyses, those with eGFRdiffcys-cr < −15 had higher risk of incident HF hospitalization (HR=1.99; 95% CI: 1.39-2.86) and those with eGFRdiffcys-cr ≥15 had lower risk of incident HF hospitalization (HR=0.67; 95% CI: 0.49-0.91) compared to participants with similar eGFRcys and eGFRcr. Participants with faster declines in eGFRcys relative to eGFRcr had higher risk of incident HF (HR=1.49; 95% CI: 1.19-1.85) compared with those in whom eGFRcys and eGFRcr declined in parallel.
Limitations:
Entry into the CRIC Study was determined by eGFRcr, which constrained the range of baseline eGFRcr but not of eGFRcys values.
Conclusions:
Among persons with CKD who have large differences between eGFRcys and eGFRcr, risk for incident HF is more strongly associated with eGFRcys. Diverging slopes between eGFRcys and eGFRcr over time are also independently associated with risk of incident HF.
Keywords: chronic kidney disease, heart failure, cystatin C, creatinine, estimated glomerular filtration rate
Plain Language Summary:
Individuals with lower kidney function, as determined by estimated glomerular filtration rate (eGFR), have higher risk of developing heart failure (HF). Cystatin C and creatinine are both biomarkers used to determine eGFR. However, cystatin C-based eGFR (eGFRcys) may differ substantially from creatinine-based eGFR (eGFRcr) within one individual. When these differences, eGFRdiffcys-cr, are large, which eGFR measure is a more reliable indicator of HF risk is unclear. We analyzed the association of eGFRdiffcys-cr, with risk of incident HF among an ambulatory CKD cohort. Among participants who have large differences between eGFRcys and eGFRcr, eGFRcys was more strongly associated with risk of incident HF . Evaluating both eGFRcys, eGFRcr, and their difference can optimize HF risk assessment among persons with CKD.
Introduction
Patients with chronic kidney disease (CKD) are at particularly high risk for developing heart failure (HF). 1,2 Lower estimated glomerular filtration rate (eGFR) is strongly and independently associated with risk of HF events.3,4 Individual patients may have very different eGFR values depending on whether creatinine or cystatin C is used for the estimation.5–8 Although cystatin C has repeatedly been shown to have stronger and more linear associations with incident HF compared to creatinine,4,9–13 creatinine-based estimated glomerular filtration rate (eGFRcr) is far more widely used in clinical practice than cystatin C-based eGFR (eGFRcys).
Use of eGFRcr may lead to inaccurate estimates of kidney function because creatinine is heavily influenced by non-kidney factors, including physical activity, muscle mass, diet, and health status.14–19 This is a concern particularly among patients with CKD, who often experience sarcopenia and frailty.20,21 Recently, the National Kidney Foundation (NKF) and American Society of Nephrology (ASN) recommended increased use of cystatin C to estimate kidney function because cystatin C is less influenced than creatinine by these common non-kidney factors and is unaffected by race or genetic ancestry.22–24 As health systems increasingly adopt cystatin C, large, within-individual differences between eGFRcys and eGFRcr will become widely recognized, particularly when non-kidney factors disproportionately affect eGFRcr.5–8
Prior studies conducted among population-based cohorts or clinical trials have found associations of these differences, defined as eGFRdiffcys-cr = eGFRcys minus eGFRcr, with all-cause mortality, falls, hospitalizations, atherosclerotic cardiovascular disease (CVD) events, and end-stage kidney disease (ESKD).5,6,25,26 However, the associations of eGFRdiffcys-cr with HF hospitalizations have not been evaluated among a cohort with established CKD. Furthermore, few prior studies have investigated the clinical interpretation of changes in eGFRdiffcys-cr over time, which result from differing rates of eGFRcys versus eGFRcr decline during longitudinal follow-up.26 Elucidating the associations of eGFRdiffcys-cr with HF risk is an important area of investigation because HF is the most common cardiovascular complication among persons with reduced eGFR.10,27,28
We analyzed data from a large multi-center study of participants with mild to moderate CKD to answer three questions: 1) Among individuals without prevalent HF at baseline, is baseline eGFRdiffcys-cr independently associated with incident HF hospitalization?; 2) Does the inclusion of time-updated measures yield stronger associations between eGFRdiffcys-cr and incident HF?; and 3) Is widening or narrowing of eGFRdiffcys-cr over time independently associated with incident HF?
Methods
Study design and population
The Chronic Renal Insufficiency Cohort (CRIC) Study is a multicenter observational cohort study that enrolled 5,499 adults from seven clinical centers across the U.S., representing a broad range of age, race, ethnicity, diabetes status, and severity of kidney disease.29–31 Participants had eGFRcr of 20-70 mL/min/1.73 m2.32 Medical history, medication use, and clinical events were updated semi-annually. Laboratory testing was conducted annually. Additional details on study design, study population, and participant characteristics have been published previously.29–31 Participants provided written informed consent, and the study protocol was approved by the institutional review boards at each participating site. In the present analysis, we excluded 543 participants who did not have simultaneous serum cystatin C and creatinine measurements from at least two study visits within the first three years of follow-up. A further 444 participants with self-reported prevalent HF at baseline were excluded.
Data were obtained from the National Institute of Diabetes and Digestive and Kidney Diseases (NIDDK) repository in April 2021 This current study was determined to be exempt from review by the University of California, San Francisco IRB, as all data were de-identified.
Predictor
Our predictor of interest, eGFRdiffcys-cr, was defined as eGFRcys minus eGFRcr and analyzed as a baseline, time-updated, and longitudinal predictor. Serum cystatin C and creatinine levels were measured annually in the CRIC Study and applied to the 2012 and 2021 CKD Epidemiology Collaboration (CKD-EPI) race-free equations, respectively.22,33 Additional details regarding cystatin C and creatinine assays are in the Supplemental Methods.
Outcomes
The outcome was incident HF hospitalization, defined as first hospitalization for HF. At least two study physicians reviewed all possible HF events using medical records, adjudicating based on clinical symptoms, radiographic evidence of pulmonary congestion, physical examination, and when available, central venous hemodynamic monitoring data and echocardiographic imaging. HF was confirmed when both physician adjudicators agreed upon a “probable” or “definite” HF event based on modified clinical Framingham criteria.34 Hospitalizations for HF were adjudicated from study entry until administrative censoring in 2018. Additional details regarding adjudication of HF events are included in the Supplemental Methods.
Covariates
All covariates were obtained at the baseline study visit concurrently with serum cystatin C and creatinine. Demographic characteristics, medical history, and medication use were self-reported. Race or ethnicity was categorized as non-Hispanic White, non-Hispanic Black, Hispanic, or other. Specific covariate definitions are included in the Supplemental Methods.
Statistical analysis
We summarized baseline characteristics, overall and stratified by three eGFRdiffcys-cr categories: < −15 (eGFRcys lower than eGFRcr), −15 to 15 (eGFRcys similar to eGFRcr), and ≥15 mL/min/1.73 m2 (eGFRcys higher than eGFRcr). These eGFRdiffcys-cr cutoffs were chosen because 15 mL/min/1.73 m2 corresponds to approximately 1-standard deviation (SD) of baseline eGFRdiffcys-cr, represents a clinically meaningful difference in eGFR that defines CKD stages, and has been used in prior studies to categorize eGFRdiffcys-cr.5,6,35
To investigate the association between baseline eGFRdiffcys-cr and incident HF hospitalization, we applied Fine-Gray proportional subhazards regression, with death modeled as a competing risk.36 We analyzed eGFRdiffcys-cr separately as a continuous and categorical predictor; we scaled eGFRdiffcys-cr per 15 mL/min/1.73 m2 and compared eGFRdiffcys-cr categories to the reference group of eGFRdiffcys-cr between −15 to 15 mL/min/1.73 m2. We initially adjusted for age, sex, race or ethnicity, and baseline eGFRcr. We adjusted for eGFRcr to assess the prognostic value of eGFRdiffcys-cr independent of the most common measure of kidney function in current clinical practice. Our multivariable adjusted model included SBP; type 2 diabetes (DM2); CVD; current smoking; UPCR; BMI; and use of statins, angiotensin-converting enzyme inhibitors or angiotensin-receptor blockers (ACEIs/ARBs), diuretics, and beta-blockers. In exploratory analyses, we additionally adjusted for steroid use, serum albumin, hemoglobin, and C-reactive protein (CRP) concentrations to determine whether these markers of health status would attenuate the associations of eGFRdiffcys-cr with incident HF hospitalization. We log-transformed UPCR and CRP to correct their right-skewed distributions. We censored participants at time of ESKD since incident ESKD increases risk of hospitalization for fluid overload, which may be a result of inadequate fluid removal during dialysis rather than incident HF.
Next, we extended the baseline models by including time-updated eGFRdiffcys-cr values from the first three annual study visits and repeated the Fine-Gray analyses. The first three annual study visits were selected to provide a sufficient number of eGFRdiffcys-cr values for evaluation of time-updated eGFRdiffcys-cr, while limiting the potential impact of participant loss to follow-up. We adjusted for time-updated measures of kidney function, including eGFRcr and UPCR. Because time-updated SBP is associated with progression of CKD37 and weight loss becomes increasingly prevalent as CKD progresses,38 we also adjusted for time-updated SBP and BMI as important potential confounders.
During longitudinal follow-up, slopes of eGFRcys and eGFRcr may diverge; we represented this using slope of eGFRdiffcys-cr. To determine the association of eGFRdiffcys-cr slope with incident HF hospitalization, we used a joint model to simultaneously evaluate repeated measures of eGFRdiffcys-cr and time-to-event data.39 Through our joint models,26 we obtained within-subject estimates of longitudinal eGFRdiffcys-cr intercept and slope. We analyzed eGFRdiffcys-cr slope as a continuous variable and created tertiles of eGFRdiffcys-cr slope. In the first tertile, eGFRcys declined more quickly than eGFRcr over time, resulting in the most negative eGFRdiffcys-cr slopes. The second tertile served as the reference group and comprised individuals with eGFRcys and eGFRcr that declined approximately in parallel. In the third tertile, eGFRcr declined more quickly than eGFRcys, which is represented by the most positive eGFRdiffcys-cr slopes. We evaluated these tertiles as predictors of incident HF hospitalizations in Fine-Gray models.
We conducted secondary analyses to further understand the association of eGFRdiffcys-cr with incident HF. First, we individually modeled the associations of eGFRcys, eGFRcr, and eGFR using the combined creatinine and cystatin C equation (eGFRcombined)22 with incident HF. Next, we compared the associations of eGFRcys versus eGFRcr with incident HF by including both eGFR values in the same multivariable-adjusted model. We then modeled the association of slopes of eGFRcys and eGFRcr individually and jointly. We also explored whether associations between eGFRdiffcys-cr and outcomes differed by a select set of baseline characteristics through stratified analyses and tests for interactions of eGFRdiffcys-cr with each baseline characteristic. The a priori selected baseline characteristics included age < or ≥ 60 years, female or male sex, self-identified Black or non-Black race, eGFRcr < or ≥ 45 mL/min/1.73 m2, and albumin < or ≥ 3.5 g/dL. Lastly, we repeated our baseline, time-updated, and slope analyses adjusting for eGFRcys rather than eGFRcr.
In sensitivity analyses, we first excluded the participants who self-reported steroid use at the baseline visit and repeated our baseline, time-updated, and slope analyses. We then performed the same sensitivity analysis after excluding participants who experienced an incident HF hospitalization prior to their third annual study visit, the final study visit when eGFRdiffcys-cr was time-updated.
Examination of variance inflation factor and condition index diagnostics found no evidence of collinearity between covariates in our models. Proportional hazards assumptions were assessed using Schoenfeld residuals. All baseline variables had <2% missing except for UPCR (5%) and CRP (28%). We performed multiple imputation using SAS Proc MI. The Markov chain Monte Carlo method for arbitrary missing multivariate normal data was used to impute missing covariates, with 20 imputations to ensure ~95% relative efficiency. All tests were two-tailed with a statistical significance level of P <0.05. Statistical analyses were performed using SAS software, version 9.4 (SAS Institute Inc) and R, version 4.1.0 (R Foundation for Statistical Computing).
Results
Among 4,512 CRIC Study participants, 1981 (44%) were women, 1906 (42%) were non-Hispanic Black, and 447 (11%) were Hispanic. Mean age was 59.4 years, eGFRcys was 55 mL/min/1.73 m2, and eGFRcr was 49 mL/min/1.73 m2 (Table 1 and Figure 1). Baseline eGFRdiffcys-cr ranged from −52 to 65 mL/min/1.73 m2, with a mean of 6 and SD of 16. Approximately two-thirds of participants had a baseline eGFRdiffcys-cr between −15 and 15 mL/min/1.73 m2 (mid-range eGFRdiffcys-cr); 7% had an eGFRdiffcys-cr < −15 (negative eGFRdiffcys-cr) and 26% had an eGFRdiffcys-cr ≥15 (positive eGFRdiffcys-cr) (Table 1). Participants within the negative eGFRdiffcys-cr group were generally older and had the highest prevalence of diabetes and CVD compared with those in the other two eGFRdiffcys-cr groups; conversely, participants with positive eGFRdiffcys-cr were younger and had lower prevalence of baseline comorbidities and medication use.
Table 1.
Baseline characteristics of participants without prevalent heart failure at baseline, by category of baseline eGFRdiffcys – cr in the Chronic Renal Insufficiency Cohort Study
| Characteristics | Baseline eGFRdiffcys – cr (mL/min/1.73 m2) |
|||
|---|---|---|---|---|
| Negative < −15 (eGFRcys lower than eGFRcr) | Mid-range −15 to 15 (eGFRcys similar to eGFRcr) | Positive ≥ 15 (eGFRcys higher than eGFRcr) | Overall | |
| Sample size | 340 | 2,977 | 1,195 | 4,512 |
| Demographics | ||||
| Age, yr, mean (SD) | 62.9 (9.3) | 59.8 (10.7) | 57.4 (10.6) | 59.4 (10.7) |
| Female sex, n (%) | 130 (38.2) | 1325 (44.5) | 526 (44.0) | 1981 (43.9) |
| Race/Ethnicity | ||||
| White, Non-Hispanic, n (%) | 183 (53.8) | 1294 (43.5) | 487 (40.8) | 1964 (43.5) |
| Black, Non-Hispanic, n (%) | 111 (32.6) | 1184 (39.8) | 611 (51.1) | 1906 (42.4) |
| Hispanic, n (%) | 32 (9.2) | 390 (13.1) | 55 (4.6) | 447 (10.6) |
| Other, n (%) | 14 (4.1) | 109 (3.7) | 42 (3.5) | 165 (3.7) |
| Comorbidities | ||||
| Diabetes, n (%) | 199 (58.5) | 1570 (52.7) | 422 (35.3) | 2191 (48.6) |
| Hypertension, n (%) | 293 (86.4) | 2666 (89.6) | 900 (75.3) | 3859 (85.5) |
| Cardiovascular disease, n (%) | 106 (31.2) | 844 (28.4) | 231 (19.3) | 1181 (26.2) |
| Smoker, n (%) | 53 (15.6) | 382 (12.8) | 104 (8.7) | 539 (11.9) |
| Systolic blood pressure, mm Hg mean (SD) | 128.5 (19.0) | 128.8 (21.0) | 124.9 (20.2) | 127.8 (20.7) |
| BMI, kg/m2, mean (SD) | 33.7 (8.3) | 32.7 (7.7) | 30.4 (6.1) | 32.1 (7.4) |
| Medications, n (%) | ||||
| Statins | 204 (60.2) | 1758 (59.5) | 558 (47.0) | 2520 (56.3) |
| ACEI/ARB | 240 (70.8) | 2107 (71.3) | 696 (58.5) | 3043 (67.9) |
| Diuretics | 156 (46.0) | 1702 (57.6) | 517 (43.5) | 2375 (53.0) |
| Beta-blockers | 163 (48.1) | 1454 (49.2) | 442 (37.2) | 2059 (45.9) |
| Steroids | 65 (19.2) | 369 (12.5) | 129 (10.8) | 563 (12.6) |
| Laboratory values | ||||
| eGFRcys, mL/min/1.73 m2, mean (SD) | 37 (13) | 47 (16) | 81 (18) | 55 (23) |
| eGFRcr, mL/min/1.73 m2, mean (SD) | 61 (14) | 45 (15) | 55 (13) | 49 (16) |
| eGFRdiffcys-cr, mL/min/1.73 m2, mean (SD) | −24 (8) | 2 (7) | 26 (10) | 6 (16) |
| UPCR, g/g, median (IQR) | 0.20 (0.08 - 0.78) | 0.20 (0.06 - 0.86) | 0.07 (0.04 - 0.17) | 0.14 (0.06 – 0.62) |
| Albumin, g/dL, mean (SD) | 3.9 (0.5) | 3.9 (0.5) | 4.1 (0.4) | 4.0 (0.5) |
| Hemoglobin, g/dL, mean (SD) | 12.6 (1.8) | 12.6 (1.8) | 13.2 (1.6) | 12.8 (1.7) |
| High-sensitivity CRP, mg/L, median (IQR) | 4.6 (1.3 - 9.1) | 2.8 (1.1 – 6.8) | 1.7 (0.9 – 4.1) | 2.5 (1.0 – 6.1) |
Abbreviations: SD, standard deviation; IQR, interquartile range; eGFRdiffcys – cr, estimated glomerular filtration rate difference; BMI, body mass index; ACEI/ARB, angiotensin-converting enzyme inhibitor or angiotensin-receptor blocker; eGFRcys, cystatin C-based estimated glomerular filtration rate using the 2012 CKD-EPI equation; eGFRcr, creatinine-based estimated glomerular filtration rate using the 2021 CKD-EPI race-free equation; UPCR, urine protein-to-creatinine ratio; CRP, C-reactive protein.
Figure 1.
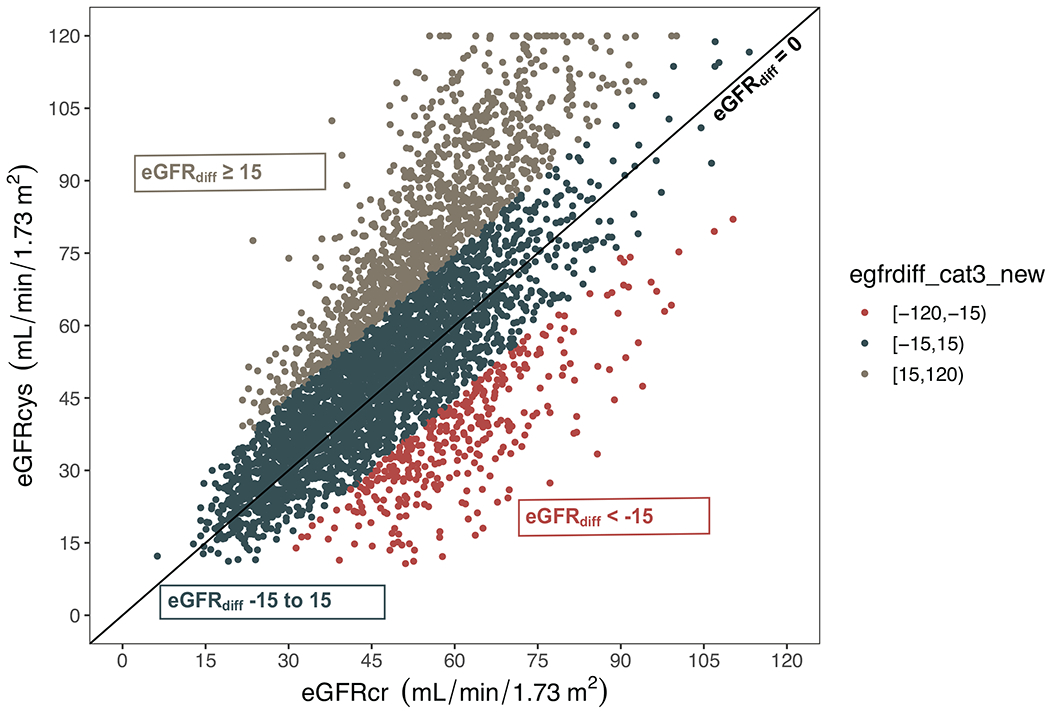
Scatterplot of the relation between eGFRcys, eGFRcr, and eGFRdiffcys – cr at baseline
Colors indicate estimated glomerular filtration rate difference (eGFRdiffcys – cr) category: red = eGFRdiffcys – cr < −15, dark blue = eGFRdiffcys – cr −15 to 15, grey = eGFRdiffcys – cr ≥ 15. Diagonal line represents eGFRdiffcys – cr of zero.
Abbreviations: eGFRcys, cystatin C-based estimated glomerular filtration rate; eGFRcr, creatinine-based estimated glomerular filtration rate
Association of baseline eGFRdiffcys-cr with incident HF
A total of 532 (12%) participants developed incident HF, with median time until incident HF hospitalization of 3.5 years (IQR: 1.5-7.1). After adjusting for demographic characteristics and eGFRcr, each 15 mL/min/1.73 m2 lower baseline eGFRdiffcys-cr was associated with 56% higher risk of incident HF (Table 2). Further multivariable adjustment attenuated this association to 20%. The crude rate of incident HF was highest among participants with negative eGFRdiffcys-cr and lowest among participants with positive eGFRdiffcys-cr (Figure 2A). Compared to the mid-range eGFRdiffcys-cr group, positive and negative eGFRdiffcys-cr categories were not statistically significantly associated with multivariable adjusted risk of incident HF (Table 2).
Table 2.
Associations of baseline, time-updated, and slope of eGFRdiffcys–cr with risk of incident heart failure (HF) hospitalization among participants without prevalent HF at baseline (n=4512)
| Subhazard ratio (95% CI) |
||
|---|---|---|
| Demographic adjusted | Multivariable adjusted | |
| Baseline measures | ||
| Continuous eGFRdiffcys – cr (per 15 mL/min/1.73 m2 lower) | 1.56 (1.42, 1.71), p<0.001 | 1.20 (1.07, 1.34), p=0.003 |
| Categorical eGFRdiffcys – cr (mL/min/1.73m2) | ||
| < −15 | 1.55 (1.06, 2.26), p=0.02 | 1.14 (0.77, 1.70), p=0.5 |
| −15 to 15 | Ref | Ref |
| ≥ 15 | 0.53 (0.42, 0.68), p<0.001 | 0.78 (0.61, 1.01), p=0.06 |
| Time-updated measures * | ||
| Continuous eGFRdiffcys – cr (per 15 mL/min/1.73 m2 lower) | 1.69 (1.52, 1.88), p<0.001 | 1.36 (1.18, 1.55), p<0.001 |
| Categorical eGFRdiffcys – cr (mL/min/1.73 m2) | ||
| <−15 | 2.71 (1.90, 3.88), p<0.001 | 1.99 (1.39, 2.86), p<0.001 |
| −15 to 15 | Ref | Ref |
| ≥ 15 | 0.47 (0.35, 0.63), p<0.001 | 0.67 (0.49, 0.91), p=0.01 |
| Slope of eGFRdiff † (mL/min/1.73 m2 per year) | ||
| Continuous slope of eGFRdiffcys – cr (per SD lower) | 1.45 (1.30, 1.59), p<0.001 | 1.37 (1.23, 1.52), p<0.001 |
| Tertile 1, −5.1 to −0.7 | 1.69 (1.37, 2.09), p<0.001 | 1.49 (1.19, 1.85), p<0.001 |
| Tertile 2, −0.7 to −0.06 | Ref | Ref |
| Tertile 3, −0.06 to 4.4 | 0.80 (0.62, 1.04), p=0.09 | 0.79 (0.61, 1.03), p=0.09 |
Demographic-adjusted models: adjusted for age, sex, race or ethnicity, and creatinine-based estimated glomerular filtration rate (eGFRcr)
Multivariable-adjusted models: adjusted for demographic-adjusted model and systolic blood pressure (SBP), type 2 diabetes, cardiovascular disease, current smoker, log(urine protein-to-creatinine ratio (UPCR)), body mass index (BMI), and use of statins, angiotensin-converting enzyme inhibitor or angiotensin-receptor blocker, diuretics, or beta-blockers
All covariates from baseline exam except eGFRcr, UPCR, BMI, SBP, and estimated glomerular filtration rate difference (eGFRdiffcys – cr), which were time-updated.
Within-subject slopes of eGFRdiffcys – cr were estimated from joint models of cystatin C-based estimated glomerular filtration rate (eGFRcys) and eGFRcr trajectory and survival, adjusted for baseline eGFRdiffcys – cr
Subhazard ratios for incident HF hospitalization were obtained using Fine and Gray proportional subhazards regression, modeling mortality as a competing risk.
Figure 2.

Crude incidence rates of incident heart failure (HF) by baseline and slope of eGFRdiffcys – cr category among participants without prevalent HF at baseline (n=4512)
Association of time-updated eGFRdiffcys-cr with incident HF
In multivariable adjusted models accounting for time-updated eGFRdiffcys-cr and covariates, each 15 mL/min/1.73 m2 lower baseline eGFRdiffcys-cr was associated with 36% higher risk of incident HF (Table 2). Compared to participants with mid-range eGFRdiffcys-cr, participants in the negative eGFRdiffcys-cr category had a higher adjusted risk of incident HF (sHR 1.99, 95% CI 1.39-2.86), and those in the positive eGFRdiffcys-cr group had a lower adjusted risk of incident HF (sHR 0.67, 95% CI 0.49-0.91) (Table 2). These results were only modestly attenuated by further adjustment for markers of nutritional status and inflammation (Table S1).
Association of eGFRdiffcys-cr slope with incident HF
Slopes of eGFRdiffcys-cr were derived using a median of four annual eGFRdiffcys-cr values (IQR: 3-4). The mean (SD) annual change in eGFRdiffcys-cr was −0.4 (0.9) mL/min/1.73 m2 per year. The correlation coefficient between baseline eGFRdiffcys-cr and eGFRdiffcys-cr slope was −0.15 (p<0.001). In multivariable models including adjustment for baseline eGFRdiffcys-cr, each SD lower eGFRdiffcys-cr slope was associated with 37% higher risk of incident HF (Table 2). Participants within the first tertile of eGFRdiffcys-cr slope had the steepest declines in eGFRcys relative to eGFRcr and had the highest crude rate of incident HF hospitalizations (Figure 2B). In multivariable adjusted models, risk of incident HF hospitalization was 49% higher among participants in the first tertile compared to the middle tertile of eGFRdiffcys-cr slope. Those in the third tertile had steeper declines in eGFRcr than eGFRcys and had 21% lower risk of incident HF hospitalization, although the finding did not reach statistical significance (Table 2). Despite this risk gradient across tertiles of eGFRdiffcys-cr slope, mean eGFRcr slope was similar in each tertile (range −1.9 and −1.5 mL/min/1.73 m2/year). Conversely, mean eGFRcys slope was substantially more negative in the lowest tertile of eGFRdiffcys-cr and more positive in the highest (range −3.2 and 0.4 mL/min/1.73 m2/year). Similar to the time-updated analyses, these eGFRdiffcys-cr slope analyses were unaffected by additional adjustment for potential confounders or mediators (Table S1).
Secondary analyses
All three eGFR measures, eGFRcys, eGFRcr, and eGFRcombined, were associated with incident HF when modeled individually in multivariable-adjusted models (Table S2). However, when eGFRcys and eGFRcr were both included in the same multivariable-adjusted model, only eGFRcys was associated with incident HF. (Table S2). Similarly, only slope of eGFRcys remained associated with the incident HF when the slopes of eGFRcys and eGFRcr were jointly modeled (Table S3).
There was no evidence of that age < or ≥ 60 years, female or male sex, self-identified Black or White race, eGFRcr < or ≥ 45, or serum albumin < or ≥ 3.5 g/dL modified the association between eGFRdiffcys-cr with incident HF hospitalization in time-updated subgroup analyses (Table S4). Adjusting for eGFRcys rather than eGFRcr in our multivariable models revealed that eGFRdiffcys-cr was no longer associated with incident HF in baseline and time-updated analyses; however, the slope of eGFRdiffcys-cr remained independently associated with incident HF even after adjustment for eGFRcys (Table S5). The results from our analyses were unaffected by the exclusion of 563 participants who reported steroid use at baseline (Table S6) nor by the exclusion of 220 participants who experienced incident HF hospitalization prior to the third annual study visit (Table S7).
Discussion
In this diverse, multicenter cohort of adults with CKD, we found that differences between eGFRcys and eGFRcr were associated with risk of incident HF hospitalization. At baseline, lower eGFRdiffcys-cr was associated with higher risk of incident HF in multivariable analyses including eGFRcr. In time-updated analyses, participants with a negative eGFRdiffcys-cr (eGFRcys lower than eGFRcr) had double the risk of incident HF hospitalization compared to those in whom eGFRcys and eGFRcr were similar. Conversely, those with positive eGFRdiffcys-cr (eGFRcys higher than eGFRcr) had 33% lower risk of incident HF hospitalization. Longitudinal slope analyses revealed that participants with eGFRcys that declined more quickly than eGFRcr had significantly higher risk of incident HF, even in adjusted analyses. Taken together, our study provides evidence that intra-individual differences between eGFRcys and eGFRcr at baseline and longitudinally provide important prognostic information regarding risk of incident HF among individuals with CKD. Furthermore, risk for incident HF appears to be driven by eGFRcys rather than by eGFRcr when the two are discrepant.
Impaired kidney function is a risk factor for incident HF.1,11,40 Our findings and that of previous studies show that eGFRcys is more strongly and linearly associated with incident HF compared to eGFRcr.1,4,9–13 However, prior studies compared the relative associations of eGFRcr and eGFRcys with incident HF at a population level rather than assessing the implications of different eGFR measurements in the same individual. We provide novel evidence that intra-individual differences between eGFRcys and eGFRcr and dynamic changes in these differences over time may inform an individual patient’s risk for incident HF hospitalization. Compared to prior studies, our study can better inform the clinical interpretation of highly discrepant eGFRcys and eGFRcr values within an individual patient. While creatinine is currently the most commonly used biomarker to estimate glomerular filtration rate (GFR), recent national efforts to provide race-agnostic assessment of kidney function will likely galvanize increased use of cystatin C.22–24 Where available, there is growing recognition that a large proportion of individuals have wide differences between eGFRcys and eGFRcr, and that such intra-individual differences have strong relationships with adverse clinical outcomes.5–7
Large differences between eGFRcys and eGFRcr may occur when non-GFR factors— including physical activity, sarcopenia, and nutrition— differentially influence cystatin C and creatinine levels. These non-GFR factors are particularly important to consider in the evaluation of patients with CKD, as worsening kidney function leads to accelerated declines in health status, physical function, and muscle mass, which affect creatinine more so than cystatin C.17 A few prior studies have assessed associations between baseline eGFRdiffcys-cr and clinical outcomes.5,6,25 One of these studies evaluated HF as an outcome among a CKD population but had a relatively low event rate and found no association between baseline eGFRdiffcys-cr and HF hospitalization.25 Our study comprised a greater number of incident HF events and found an association between baseline eGFRdiffcys-cr and incident HF when eGFRdiffcys-cr was evaluated as a continuous, but not categorical predictor. To better account for changes in health status that may differentially impact creatinine versus cystatin C during longitudinal follow-up, we modeled repeated measures of eGFRdiffcys-cr in both time-updated and slope analyses. We observed in time-updated analyses that eGFRdiffcys-cr categories clearly identified subgroups of individuals with CKD who are at lower or higher risk for incident HF. Analyses of eGFRdiffcys-cr slope revealed that diverging eGFRcys and eGFRcr values over time are also associated with incident HF. The associations elucidated by our time-updated and slope analyses would be missed by a single baseline assessment of eGFRdiffcys-cr, as one eGFRdiffcys-cr value appears to incompletely capture the compounding impact of non-GFR factors on eGFRcr values over time. While non-GFR determinants of cystatin C — such as obesity, steroid use, and possibly inflammation — also exist, their combined effects on serum cystatin C levels are smaller in magnitude than the non-GFR determinants on serum creatinine.41,42 As a result, our estimates remained robust and unchanged after controlling for BMI, steroid use, and CRP.
Our findings offer three major clinical implications. First, patients with CKD may commonly have large eGFRdiffcys-cr; in these individuals, eGFRcr alone is likely not adequately capturing risk for HF, which is the most common cardiovascular outcome associated with CKD. A large eGFRdiffcys-cr should prompt clinicians to carefully consider whether creatinine may be biased by common factors unrelated to kidney function and to use eGFRcys as a more reliable indicator of HF risk. Although cystatin C might be the biased marker in some cases, our results indicate that clinical risk generally aligns more with cystatin C than creatinine. Second, the consistently stronger associations of time-updated and longitudinal eGFRdiffcys-cr with incident HF, relative to the associations of baseline eGFRdiffcys-cr , demonstrate that repeating cystatin C annually may improve clinical risk assessment in patients with CKD. Third, our findings support reporting eGFRcys and eGFRcr separately because the difference between their values at baseline and during longitudinal follow-up provides important prognostic information that may be obscured if the eGFRcombined equation were to be used.33
The strengths of this study include repeated assessments of eGFRdiffcys-cr among a large, national CKD cohort with carefully adjudicated HF hospitalizations. We also acknowledge important limitations. First, entry into the CRIC Study was determined by eGFRcr, which constrained the range of eGFRcr but not of eGFRcys. This likely excluded a preponderance of participants who would have been categorized into the negative eGFRdiffcys-cr groups relative to the number in the positive group at baseline. Second, we chose to use the absolute rather than relative difference between eGFRcys and eGFRcr because in our clinical experience, clinicians intuitively understand and can calculate the absolute difference between two eGFR values. We acknowledge that using absolute difference constrains the range of eGFRdiffcys-cr at lower eGFR values. Third, cystatin C was not calibrated to a traceable international standard. The CRIC Study internally calibrated cystatin C measures to correct for drift over time caused by using different calibrator and reagent lots. We expect that potential imprecision due to measurement error would be non-differential among eGFRdiffcys-cr categories or between individual participants, and any error would diminished the strength of our associations. Fourth, we did not have sufficient data on ejection fraction at the time of HF hospitalization to stratify outcomes by HF sub-types. Fifth, HF exacerbations that might have been diagnosed in the ambulatory care setting were not evaluated by the CRIC Study and thus would have been missed in our analyses. Sixth, we used a joint model to obtain within-subject estimates of eGFRdiffcys-cr slope.39 While these are slope estimates with confidence intervals rather than actual eGFRdiffcys-cr slopes, the joint modeling approach reduces bias, accounts for informative censoring, and improves precision relative to more traditional survival analyses.43–47 Furthermore, any measurement error in estimating slopes would be non-differential among eGFRdiffcys-cr categories or between individual participants and variance would tend to limit our ability to find associations. Lastly, our results may not generalize to persons without CKD or populations outside of the United States.
Our study showed that large differences between eGFRcys and eGFRcr convey important prognostic information regarding risk of incident HF hospitalization. During longitudinal follow-up, steeper declines in eGFRcys than eGFRcr portend higher risk of HF events. Thus, in patients with CKD, annual measures of serum creatinine and cystatin C and separate reporting of both eGFRcys and eGFRcr would optimize the assessment of HF risk.
Supplementary Material
Item S1. Supplementary Methods
Table S1. Associations of eGFRdiffcys – cr with incident heart failure (HF) hospitalization in exploratory analyses adding adjustment for steroid use, serum albumin, hemoglobin, and C-reactive protein among participants without prevalent HF at baseline (n=4512)
Table S2: Individually- and Jointly-modeled associations of eGFRcys, eGFRcr, and eGFRcombined with incident heart failure (HF) hospitalization among participants without prevalent HF at baseline (N = 4512)
Table S3: Individually- and Jointly-modeled associations of eGFRcys slope and eGFRcr slope with incident heart failure (HF) hospitalization among participants without prevalent HF at baseline (N = 4512)
Table S4. Associations of time-updated eGFRdiffcys – cr with incident heart failure (HF) hospitalizations among participants without baseline prevalent HF (n=4512), stratified by subgroup.
Table S5. Associations of eGFRdiffcys–cr with risk of incident heart failure (HF) hospitalization among participants without prevalent HF at baseline (n=4512), adjusting for eGFRcys
Table S6. Associations of eGFRdiffcys – cr with incident heart failure (HF) hospitalization in sensitivity analyses excluding 563 participants who self-reported steroid use at baseline visit
Table S7. Associations of eGFRdiffcys – cr with incident heart failure (HF) hospitalization in sensitivity analyses excluding 220 participants who experienced incident HF hospitalization prior to the third annual study visit
Support:
The CRIC Study is funded under cooperative agreements from the National Institute of Diabetes and Digestive and Kidney Diseases (NIDDK). DCC is supported by NIH/NIDDK grant F32DK130543. MGS and MME are supported by SD- 20-387 from the Department of Veterans Affairs. AP is supported by American Kidney Fund Clinical Scientist in Nephrology Fellow program, Akebia Therapeutics, Inc, and NIH/NIDDK grant K23DK128604. DER is supported by VA Merit Award HSR&D IIR 15-369. ANM is supported by the University of California, San Francisco, Dean’s Diversity award, R01DK114014 diversity supplement and NIH/NIDDK grant K23DK119562. CyH is supported by NIH/NIDDK grant K24DK92291 and U01 K60902. The funders had no role in study design, data collection, analysis, reporting, or the decision to submit for publication.
Financial Disclosure:
MME and MGS receive research funding from Bayer, Inc. MME has received an honorarium from Boehringer-Ingelheim, Inc. MGS reports honoraria from Bayer, Inc., Boeringer Ingelheim, and AstraZeneca, and served as a consultant to Cricket Health and Intercept Pharmaceuticals MGS previous served as an adviser to and held stock in TAI Diagnostics. JHI receives research funding from Baxter International and is a member of the Data Safety Monitoring Board for Sanifit International and the Advisory Board for Jnana Pharmaceuticals, Ardelyx Inc., AstraZeneca. The remaining authors declare that they have no relevant financial interests.
Footnotes
Publisher's Disclaimer: This is a PDF file of an unedited manuscript that has been accepted for publication. As a service to our customers we are providing this early version of the manuscript. The manuscript will undergo copyediting, typesetting, and review of the resulting proof before it is published in its final form. Please note that during the production process errors may be discovered which could affect the content, and all legal disclaimers that apply to the journal pertain.
Publisher's Disclaimer: Disclaimer: The CRIC Study was conducted by the CRIC Investigators and supported by the NIDDK. The data from the CRIC Study reported here were supplied by the NIDDK Central Repositories. This manuscript was not prepared in collaboration with investigators of the CRIC Study and does not necessarily reflect the opinions or views of the CRIC Investigators, the NIDDK Central Repositories, or the NIDDK.
Prior Presentation: Previously presented as a poster at the National Kidney Foundation 2022 Spring Clinical Meeting, April 6-10, 2022. Chen DC, Shlipak MG, Scherzer R et al. 172: Intra-individual Differences in Creatinine Versus Cystatin C-Based Estimated Glomerular Filtration Rate and Risk of Incident Heart Failure. American Journal of Kidney Diseases. 2022;79(4 supp 2): S53. doi: 10.1053/j.ajkd.2022.01.177
References
- 1.Kottgen A, Russell SD, Loehr LR, et al. Reduced kidney function as a risk factor for incident heart failure: the atherosclerosis risk in communities (ARIC) study. J Am Soc Nephrol. Apr 2007;18(4):1307–15. doi: 10.1681/asn.2006101159 [DOI] [PubMed] [Google Scholar]
- 2.Dhingra R, Gaziano JM, Djoussé L. Chronic kidney disease and the risk of heart failure in men. Circ Heart Fail. Mar 2011;4(2):138–44. doi: 10.1161/circheartfailure.109.899070 [DOI] [PMC free article] [PubMed] [Google Scholar]
- 3.Go AS, Chertow GM, Fan D, McCulloch CE, Hsu CY. Chronic kidney disease and the risks of death, cardiovascular events, and hospitalization. N Engl J Med. Sep 23 2004;351(13):1296–305. doi: 10.1056/NEJMoa041031 [DOI] [PubMed] [Google Scholar]
- 4.He J, Shlipak M, Anderson A, et al. Risk Factors for Heart Failure in Patients With Chronic Kidney Disease: The CRIC (Chronic Renal Insufficiency Cohort) Study. J Am Heart Assoc. May 17 2017;6(5)doi: 10.1161/jaha.116.005336 [DOI] [PMC free article] [PubMed] [Google Scholar]
- 5.Potok OA, Katz R, Bansal N, et al. The Difference Between Cystatin C- and Creatinine-Based Estimated GFR and Incident Frailty: An Analysis of the Cardiovascular Health Study (CHS). Am J Kidney Dis. Dec 2020;76(6):896–898. doi: 10.1053/j.ajkd.2020.05.018 [DOI] [PMC free article] [PubMed] [Google Scholar]
- 6.Potok OA, Ix JH, Shlipak MG, et al. The Difference Between Cystatin C- and Creatinine-Based Estimated GFR and Associations With Frailty and Adverse Outcomes: A Cohort Analysis of the Systolic Blood Pressure Intervention Trial (SPRINT). Am J Kidney Dis. Dec 2020;76(6):765–774. doi: 10.1053/j.ajkd.2020.05.017 [DOI] [PMC free article] [PubMed] [Google Scholar]
- 7.Kang E, Han SS, Kim J, et al. Discrepant glomerular filtration rate trends from creatinine and cystatin C in patients with chronic kidney disease: results from the KNOW-CKD cohort. BMC Nephrol. Jul 16 2020;21(1):280. doi: 10.1186/sl2882-020-01932-4 [DOI] [PMC free article] [PubMed] [Google Scholar]
- 8.Legrand H, Werner K, Christensson A, Pihlsgård M, Elmståhl S. Prevalence and determinants of differences in cystatin C and creatinine-based estimated glomerular filtration rate in community-dwelling older adults: a cross-sectional study. BMC nephrology. 2017;18(1):350–350. doi: 10.1186/sl2882-017-0759-3 [DOI] [PMC free article] [PubMed] [Google Scholar]
- 9.Nowak C, Ärnlöv J. Kidney Disease Biomarkers Improve Heart Failure Risk Prediction in the General Population. Circ Heart Fail. Aug 2020;13(8):e006904. doi: 10.1161/circheartfailure.120.006904 [DOI] [PubMed] [Google Scholar]
- 10.Ix JH, Shlipak MG, Chertow GM, Whooley MA. Association of cystatin C with mortality, cardiovascular events, and incident heart failure among persons with coronary heart disease: data from the Heart and Soul Study. Circulation. Jan 16 2007;115(2):173–9. doi: 10.1161/circulationaha.106.644286 [DOI] [PMC free article] [PubMed] [Google Scholar]
- 11.Sarnak MJ, Katz R, Stehman-Breen CO, et al. Cystatin C concentration as a risk factor for heart failure in older adults. Ann Intern Med. Apr 5 2005;142(7):497–505. doi: 10.7326/0003-4819-142-7-200504050-00008 [DOI] [PubMed] [Google Scholar]
- 12.Peralta CA, Katz R, Sarnak MJ, et al. Cystatin C identifies chronic kidney disease patients at higher risk for complications. J Am Soc Nephrol. Jan 2011;22(1):147–55. doi: 10.1681/ASN.2010050483 [DOI] [PMC free article] [PubMed] [Google Scholar]
- 13.Shlipak MG, Katz R, Sarnak MJ, et al. Cystatin C and prognosis for cardiovascular and kidney outcomes in elderly persons without chronic kidney disease. Ann Intern Med. Aug 15 2006;145(4):237–46. doi: 10.7326/0003-4819-145-4-200608150-00003 [DOI] [PubMed] [Google Scholar]
- 14.Nair S, O’Brien SV, Hayden K, et al. Effect of a Cooked Meat Meal on Serum Creatinine and Estimated Glomerular Filtration Rate in Diabetes-Related Kidney Disease. Diabetes Care. 2014;37(2):483–487. doi: 10.2337/dcl3-1770 [DOI] [PubMed] [Google Scholar]
- 15.Hart A, Paudel ML, Taylor BC, et al. Cystatin C and frailty in older men. J Am Geriatr Soc. Sep 2013;61(9):1530–6. doi: 10.1111/jgs.l2413 [DOI] [PMC free article] [PubMed] [Google Scholar]
- 16.Ensrud KE, Parimi N, Fink HA, et al. Estimated GFR and risk of hip fracture in older men: comparison of associations using cystatin C and creatinine. Am J Kidney Dis. Jan 2014;63(1):31–9. doi: 10.1053/j.ajkd.2013.05.022 [DOI] [PMC free article] [PubMed] [Google Scholar]
- 17.Dalrymple LS, Katz R, Rifkin DE, et al. Kidney function and prevalent and incident frailty. Clin J Am Soc Nephrol. Dec 2013;8(12):2091–9. doi: 10.2215/cjn.02870313 [DOI] [PMC free article] [PubMed] [Google Scholar]
- 18.Beddhu S, Samore MH, Roberts MS, Stoddard GJ, Pappas LM, Cheung AK. Creatinine production, nutrition, and glomerular filtration rate estimation. J Am Soc Nephrol. Apr 2003;14(4):1000–5. doi: 10.1097/01.asn.0000057856.88335.dd [DOI] [PubMed] [Google Scholar]
- 19.Ballew SH, Chen Y, Daya NR, et al. Frailty, Kidney Function, and Polypharmacy: The Atherosclerosis Risk in Communities (ARIC) Study. Am J Kidney Dis. Feb 2017;69(2):228–236. doi: 10.1053/j.ajkd.2016.08.034 [DOI] [PMC free article] [PubMed] [Google Scholar]
- 20.Pandey A, Kitzman D, Reeves G. Frailty Is Intertwined With Heart Failure: Mechanisms, Prevalence, Prognosis, Assessment, and Management. JACC Heart Fail. Dec 2019;7(12):1001–1011. doi: 10.1016/j.jchf.2019.10.005 [DOI] [PMC free article] [PubMed] [Google Scholar]
- 21.Foley RN, Wang C, Ishani A, Collins AJ, Murray AM. Kidney function and sarcopenia in the United States general population: NHANES III. Am J Nephrol. 2007;27(3):279–86. doi: 10.1159/000101827 [DOI] [PubMed] [Google Scholar]
- 22.Inker LA, Eneanya ND, Coresh J, et al. New Creatinine- and Cystatin C–Based Equations to Estimate GFR without Race. New England Journal of Medicine. 2021;doi: 10.1056/NEJMoa2102953 [DOI] [PMC free article] [PubMed] [Google Scholar]
- 23.Hsu C-y, Yang W, Parikh RV, et al. Race, Genetic Ancestry, and Estimating Kidney Function in CKD. New England Journal of Medicine. 2021;doi: 10.1056/NEJMoa2103753 [DOI] [PMC free article] [PubMed] [Google Scholar]
- 24.Delgado C, Baweja M, Crews D, et al. A Unifying Approach for GFR Estimation: Recommendations of the NKF-ASN Task Force on Reassessing the Inclusion of Race in Diagnosing Kidney Disease. Journal of the American Society of Nephrology. 2021:ASN.2021070988. doi: 10.1681/asn.2021070988 [DOI] [PMC free article] [PubMed] [Google Scholar]
- 25.Kim H, Park JT, Lee J, et al. The difference between cystatin C- and creatinine-based eGFR is associated with adverse cardiovascular outcome in patients with chronic kidney disease. Atherosclerosis. Aug 27 2021;335:53–61. doi: 10.1016/j.atherosclerosis.2021.08.036 [DOI] [PubMed] [Google Scholar]
- 26.Chen DC, Shlipak MG, Scherzer R, et al. Association of Intraindividual Difference in Estimated Glomerular Filtration Rate by Creatinine vs Cystatin C and End-stage Kidney Disease and Mortality. JAMA Netw Open. Feb 1 2022;5(2):e2148940. doi: 10.1001/jamanetworkopen.2021.48940 [DOI] [PMC free article] [PubMed] [Google Scholar]
- 27.Fried LF, Shlipak MG, Crump C, et al. Renal insufficiency as a predictor of cardiovascular outcomes and mortality in elderly individuals. J Am Coll Cardiol. Apr 16 2003;41(8):1364–72. doi: 10.1016/s0735-1097(03)00163-3 [DOI] [PubMed] [Google Scholar]
- 28.Schefold JC, Filippatos G, Hasenfuss G, Anker SD, von Haehling S. Heart failure and kidney dysfunction: epidemiology, mechanisms and management. Nat Rev Nephrol. Oct 2016;12(10):610–23. doi: 10.1038/nrneph.2016.113 [DOI] [PubMed] [Google Scholar]
- 29.Feldman HI, Appel LJ, Chertow GM, et al. The Chronic Renal Insufficiency Cohort (CRIC) Study: Design and Methods. J Am Soc Nephrol. Jul 2003;14(7 Suppl 2):S148–53. doi: 10.1097/01.asn.0000070149.78399.ce [DOI] [PubMed] [Google Scholar]
- 30.Lash JP, Go AS, Appel LJ, et al. Chronic Renal Insufficiency Cohort (CRIC) Study: baseline characteristics and associations with kidney function. Clin J Am Soc Nephrol. Aug 2009;4(8):1302–11. doi: 10.2215/CJN.00070109 [DOI] [PMC free article] [PubMed] [Google Scholar]
- 31.Fischer MJ, Go AS, Lora CM, et al. CKD in Hispanics: Baseline characteristics from the CRIC (Chronic Renal Insufficiency Cohort) and Hispanic-CRIC Studies. Am J Kidney Dis. Aug 2011;58(2):214–27. doi: 10.1053/j.ajkd.2011.05.010 [DOI] [PMC free article] [PubMed] [Google Scholar]
- 32.Levey AS, Bosch JP, Lewis JB, Greene T, Rogers N, Roth D. A more accurate method to estimate glomerular filtration rate from serum creatinine: a new prediction equation. Modification of Diet in Renal Disease Study Group. Ann Intern Med. Mar 16 1999;130(6):461–70. doi: 10.7326/0003-4819-130-6-199903160-00002 [DOI] [PubMed] [Google Scholar]
- 33.Inker LA, Schmid CH, Tighiouart H, et al. Estimating glomerular filtration rate from serum creatinine and cystatin C. N Engl J Med. Jul 5 2012;367(1):20–9. doi: 10.1056/NEJMoa1114248 [DOI] [PMC free article] [PubMed] [Google Scholar]
- 34.Ho KK, Anderson KM, Kannel WB, Grossman W, Levy D. Survival after the onset of congestive heart failure in Framingham Heart Study subjects. Circulation. Jul 1993;88(1):107–15. doi: 10.1161/01.cir.88.1.107 [DOI] [PubMed] [Google Scholar]
- 35.Group. KDIGOKCW. KDIGO 2012 clinical practice guideline for the evaluation and management of chronic kidney disease. Kidney Int Suppl. 2013;3:1–150. [DOI] [PubMed] [Google Scholar]
- 36.Fine JP, Gray RJ. A Proportional Hazards Model for the Subdistribution of a Competing Risk. Journal of the American Statistical Association. 1999/06/01 1999;94(446):496–509. doi: 10.1080/01621459.1999.10474144 [DOI] [Google Scholar]
- 37.Anderson AH, Yang W, Townsend RR, et al. Time-updated systolic blood pressure and the progression of chronic kidney disease: a cohort study. Annals of internal medicine. 2015;162(4):258–265. doi: 10.7326/M14-0488 [DOI] [PMC free article] [PubMed] [Google Scholar]
- 38.Ku E, Kopple JD, Johansen KL, et al. Longitudinal Weight Change During CKD Progression and Its Association With Subsequent Mortality. Am J Kidney Dis. May 2018;71(5):657–665. doi: 10.1053/j.ajkd.2017.09.015 [DOI] [PMC free article] [PubMed] [Google Scholar]
- 39.Garcia-Hernandez A, Rizopoulos D. %JM: A SAS Macro to Fit Jointly Generalized Mixed Models for Longitudinal Data and Time-to-Event Responses. SAS macro; joint modeling; time-to-event; longitudinal; generalized mixed models; shared parameter models; survival data. 2018. 2018-04-28 2018;84(12):29. doi: 10.18637/jss.v084.i12 [DOI] [Google Scholar]
- 40.Bibbins-Domingo K, Chertow GM, Fried LF, et al. Renal Function and Heart Failure Risk in Older Black and White Individuals: The Health, Aging, and Body Composition Study. Archives of Internal Medicine. 2006;166(13):1396–1402. doi: 10.1001/archinte.166.13.1396 [DOI] [PubMed] [Google Scholar]
- 41.Stevens LA, Schmid CH, Greene T, et al. Factors other than glomerular filtration rate affect serum cystatin C levels. Kidney Int. Mar 2009;75(6):652–60. doi: 10.1038/ki.2008.638 [DOI] [PMC free article] [PubMed] [Google Scholar]
- 42.Knight EL, Verhave JC, Spiegelman D, et al. Factors influencing serum cystatin C levels other than renal function and the impact on renal function measurement. Kidney Int. Apr 2004;65(4):1416–21. doi: 10.1111/j.1523-1755.2004.00517.x [DOI] [PubMed] [Google Scholar]
- 43.Wulfsohn MS, Tsiatis AA. A joint model for survival and longitudinal data measured with error. Biometrics. Mar 1997;53(1):330–9. [PubMed] [Google Scholar]
- 44.Pauler DK, Finkelstein DM. Predicting time to prostate cancer recurrence based on joint models for non-linear longitudinal biomarkers and event time outcomes. Stat Med. Dec 30 2002;21(24):3897–911. doi: 10.1002/sim.1392 [DOI] [PubMed] [Google Scholar]
- 45.Henderson R, Diggle P, Dobson A. Joint modelling of longitudinal measurements and event time data. Biostatistics. Dec 2000;1(4):465–80. doi: 10.1093/biostatistics/1.4.465 [DOI] [PubMed] [Google Scholar]
- 46.Chesnaye NC, Tripepi G, Dekker FW, Zoccali C, Zwinderman AH, Jager KJ. An introduction to joint models-applications in nephrology. Clin Kidney J. 2020;13(2):143–149. doi: 10.1093/ckj/sfaa024 [DOI] [PMC free article] [PubMed] [Google Scholar]
- 47.Rizopoulos D Dynamic predictions and prospective accuracy in joint models for longitudinal and time-to-event data. Biometrics. Sep 2011;67(3):819–29. doi: 10.1111/j.1541-0420.2010.01546.x [DOI] [PubMed] [Google Scholar]
Associated Data
This section collects any data citations, data availability statements, or supplementary materials included in this article.
Supplementary Materials
Item S1. Supplementary Methods
Table S1. Associations of eGFRdiffcys – cr with incident heart failure (HF) hospitalization in exploratory analyses adding adjustment for steroid use, serum albumin, hemoglobin, and C-reactive protein among participants without prevalent HF at baseline (n=4512)
Table S2: Individually- and Jointly-modeled associations of eGFRcys, eGFRcr, and eGFRcombined with incident heart failure (HF) hospitalization among participants without prevalent HF at baseline (N = 4512)
Table S3: Individually- and Jointly-modeled associations of eGFRcys slope and eGFRcr slope with incident heart failure (HF) hospitalization among participants without prevalent HF at baseline (N = 4512)
Table S4. Associations of time-updated eGFRdiffcys – cr with incident heart failure (HF) hospitalizations among participants without baseline prevalent HF (n=4512), stratified by subgroup.
Table S5. Associations of eGFRdiffcys–cr with risk of incident heart failure (HF) hospitalization among participants without prevalent HF at baseline (n=4512), adjusting for eGFRcys
Table S6. Associations of eGFRdiffcys – cr with incident heart failure (HF) hospitalization in sensitivity analyses excluding 563 participants who self-reported steroid use at baseline visit
Table S7. Associations of eGFRdiffcys – cr with incident heart failure (HF) hospitalization in sensitivity analyses excluding 220 participants who experienced incident HF hospitalization prior to the third annual study visit