

Abstract
Objective:
High body mass index (BMI) is associated with many comorbidities and mortality; however, we aimed to elucidate the overall clinical risk of obesity using a genome- and phenome-wide approach.
Methods:
We performed a phenome-wide association study (PheWAS) of BMI using a clinical cohort of 736,726 adults. This was followed by genetic association studies using 2 separate cohorts, one consisting of 65,174 adults in the eMERGE Network and another with 405,432 participants in the UK Biobank.
Results:
Class 3 obesity was associated with 433 phenotypes, representing 59.3% of all billing codes in individuals having severe obesity. A genome-wide polygenic risk score for BMI, accounting for 7.5% of variance in BMI, was associated with 296 clinical diseases, including strong associations with type 2 diabetes, sleep apnea, hypertension, and chronic liver disease. In all 3 cohorts, 199 phenotypes were associated with class 3 obesity and polygenic risk for obesity and included novel associations such as increased risk of renal failure, venous insufficiency, and gastroesophageal reflux, among others.
Conclusions:
This combined genomic and phenomic systematic approach demonstrated that obesity has a strong genetic predisposition and is associated with a considerable burden of disease across all disease classes.
Keywords: genetics, genetic susceptibility, obesity phenotypes
Introduction
Over two-thirds of the adult population in the United States have overweight or obese BMIs.(1) The prevalence of obesity, defined as having a body-mass index (BMI) of 30.0 kg/m2 or greater, has doubled in over 70 countries in the last 3 decades.(2, 3) Prospective large-scale observational studies have shown that BMI above the normal range (overweight, BMI ≥ 25.0 kg/m2) is associated with significant disease morbidity and increased overall mortality.(4–6) However, most prior studies focus on a single disease or a set of related diseases, leaving the overall disease burden associated with obesity unknown.
Obesity has a strong genetic predilection. It is known that rare genetic variants in MC4R(7) and LEP(8) and other genes are associated with early-onset obesity. However, for the large majority of individuals with obesity, their genetic risk stems from the cumulative effect of numerous more common genetic risk factors with fairly modest effect sizes.(9, 10) In 2015, a genome-wide association studies (GWAS) investigating the genetic basis of obesity by evaluating the relationship between 2.1 million common variants and BMI in 300,000 individuals found 97 single nucleotide polymorphisms (SNPs) associated with BMI, accounting for approximately 2.7% of the variation in BMI.(11) To date, the largest GWAS of BMI in approximately 700,000 individuals was performed by Yengo et al. in 2018 and identified 941 near-independent SNPs associated with BMI.(12)
Prior studies have suggested that obesity-risk SNPs are associated with ischemic heart disease,(13, 14) hypertension,(14) type 2 diabetes,(14) atrial fibrillation,(15) symptomatic cholelithiasis,(16) osteoarthritis,(17) and deep venous thrombosis,(18) among others.(19–25) Further evidence validates genomic risk for obesity is a causal factor for diabetes, myocardial infarction, and dyslipidemia.(26) These studies are limited by the use of either a single or limited number of genetic polymorphisms associated with BMI and evaluation for an association with a single comorbid phenotype. Genome-wide polygenic risk scores (PRS) have demonstrated the ability to predict disease occurrence and earlier onset of disease.(27) Khera et al. has shown that incorporation of 2.1 million common variants into a quantitative genome-wide PRS for BMI can identify individuals with genetic risk for obesity comparable to that of monogenic mutations in MC4R.(10) Further, they also found that those individuals with a high PRS were at increased risk for six common diseases, including coronary artery disease, diabetes mellitus, hypertension, congestive heart failure, ischemic stroke, and venous thromboembolism. Here, we aim to extend these prior studies by systematically evaluating the association of genetic risk for obesity with diseases in both a genome- and phenome-wide approach.
We leveraged a large electronic health record (EHR) population to perform a phenome-wide association study (PheWAS)(28, 29) to provide insights into patterns of disease associated with BMI. We then used genomic risk to predict BMI and obesity in two cohorts, using both known common genetic variants associated with obesity(11) and a genome-wide polygenic score (Figure 1).(10) These studies demonstrated that genetic risk for obesity is associated with increased risk for almost 200 diseases across the phenome, along with novel associations of genetically-determined BMI with diseases, including renal failure, venous insufficiency, gastroesophageal reflux, and rheumatoid arthritis, among others.
Figure 1. Clinical and Genomic Analysis Flow.
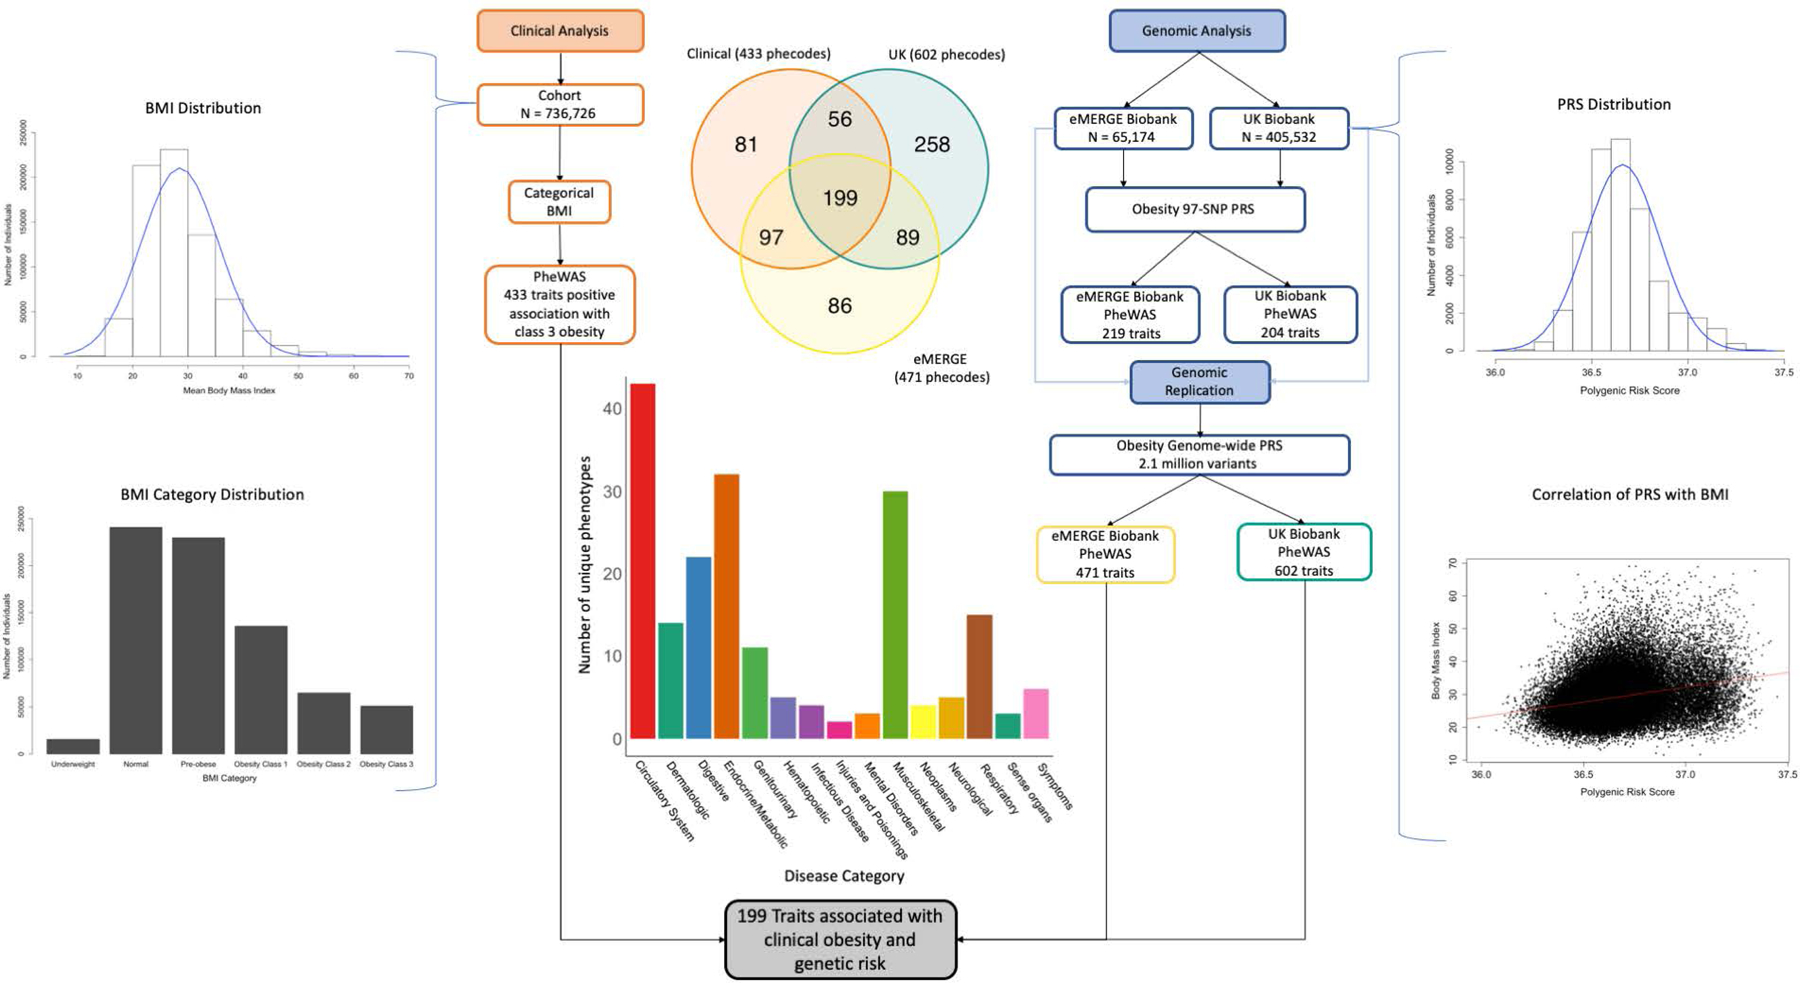
Clinical analysis performed with PheWAS using BMI against 1816 traits. Genomic analysis performed in 2 separate cohorts with PheWAS against a 97-SNP PRS and genome-wide PRS. BMI distribution in the clinical cohort is demonstrated. Genome-wide PRS distribution and correlation with BMI in the eMERGE cohort is demonstrated. 199 disease phenotypes across all disease categories were associated with class 3 obesity in the clinical cohort and the genome-wide PRS in the eMERGE and UK Biobank cohorts.
Methods
Clinical cohort
We conducted a retrospective observational study using the Vanderbilt University Medical Center (VUMC) Synthetic Derivative, a de-identified version of over 3 million VUMC patient health records dating back several decades, depending on data type.(30, 31) The primary site study population consisted of all adult individuals (≥18 years of age) with at least one documented BMI. The study protocol was designated as non-human subject research by the Institutional Review Board.
Body Mass Index (BMI) Extraction and Categorization
BMI was calculated as weight in kilograms divided by height in meters squared, where both weight and height were measured at a single encounter. All measured BMI values were extracted for each adult individual (9,573,624 BMI observations), with BMI data obtained during pregnancy (649,442 observations) or with clinically implausible values (less than 10 kg/m2 or greater than 70 kg/m2, 6316 observations) excluded. The median BMI for each individual was classified into one of 6 BMI categories, as defined by the Centers for Disease Control and Prevention (CDC) and the World Health Organization (WHO), including underweight (<18.5 kg/m2), normal (18.5–24.9 kg/m2), overweight (25.0–29.9 kg/m2), and obesity class 1 (30.0–34.9 kg/m2), class 2 (35.0–39.9 kg/m2), and class 3 ( ≥40.0 kg/m2).(32)
Clinical Cohort BMI Phenome-wide Association Study
All distinct International Classification of Diseases, Ninth Revision, Clinical Modification (ICD-9-CM) codes from each individuals’ record were captured and translated into PheWAS codes (phecodes), a hierarchical classification system for ICD-9-CM codes.(28, 33) A minimum of 2 instances of a matching ICD-9 code on separate days was required to be translated to a phecode using PheWAS code map version 1.2. For all PheWAS analyses in this study, as many phenotypes occur rarely, we analyzed only those that occurred in a minimum of 20 cases.
PheWAS was performed using logistic regression models adjusted for age at last BMI recorded, sex, and self-reported race to determine the association of BMI categories with phenotypes. Using categorical BMI, effect sizes are determined by comparison to those individuals with BMI in the normal range. We also used mean BMI as the predictor in the PheWAS model to calculate effect sizes per standard deviation (SD)-difference in BMI. All PheWAS analyses were performed using the PheWAS package for R statistical software, version 3.4.3(35) and using PheWAS code map version 1.2.(34) Two-sided p-value <5.6×10⁻⁶ was considered as statistically significant using Bonferroni correction for multiple comparisons.
Genomic Cohort Analyses
Data for the genomic analyses were derived from two separate cohorts, the first being the eMERGE Consortium, a national network organized and funded by the National Human Genome Research Institute (NHGRI).(36) eMERGE combines DNA biorepositories with EHRs for large scale, high-throughput genetic research. Both the genomic and phenomic data (ICD9 diagnosis codes and demographics) were coalesced into a central repository. Of the eMERGE cohort, 19,590 (30.1%) individuals were from Vanderbilt University Medical Center and also likely contributed data to the clinical cohort, although deidentification prevents the ability to confirm overlap. The second genomic cohort was derived from a maximal subset of unrelated UK Biobank participants with both genomic and phenomic data available.
Genotyping and Imputation in the eMERGE Mendelian Randomization Cohort
The eMERGE population in this study consisted of individuals from institutions contributing data to the eMERGE network phases I-III (Supplemental Table 1). Inclusion criteria were age ≥18 years with extant genome-wide genotyping data and ICD-9-CM codes. The eMERGE Consortium has unified genetic results from 12 different sites across 78 genotype array batches through imputation using the Michigan Imputation Server(37) and Haplotype Reference Consortium (HRC1.1).(38) This pipeline has resulted in an imputed genome wide set of approximately 40 million single nucleotide variant marker allele doses down to 0.1% minor allele frequency (MAF). Genotype array files were referenced to build 37 genome position using the forward genome strand. Quality control included filtering for sample missingness <2.0% and SNP missingness <2.0% in the preprocessing of the data before imputation. For duplicate samples on differing arrays, the sample with the most genotyped variants for that subject was selected for the merged dataset. Principal component analysis (PCA) using the first 10 principal components was performed to determine genetic ancestry using PLINK(39) with variants having >5% MAF. Single nucleotide variants with a missing rate >10% or not meeting the linkage disequilibrium threshold r2 < 0.7 were excluded in PCAs. We performed identity by descent (IBD) analysis to identify related individuals. One individual from suspected monozygotic twins or duplicates were excluded randomly. Subject relatedness was determined using probability of zero alleles IBD (Z0) < 0.83 and the probability of having one allele IBD (Z1) > 0.10 to capture first through third-degree relatives. The oldest family member from each family was included in the cohort analysis. Minimum mean imputation r2 was 0.83 with a mean r2 of 0.95 across imputed SNPs.
UK Biobank sample selection
A maximal subset of unrelated UK Biobank participants after application of quality control was selected as detailed in Bycroft, et al, Supplemental section 3.3.2.(40) Individuals in this subset where chosen to have no other related individuals within 3 degrees within the subset, to have genotyping missingness < 2%, to have no mismatch between genetically inferred and reported sex, and to not be outliers for heterozygosity or genotype missingness. We additionally removed individuals without a BMI measurement at the time of enrollment, as well as those who revoked consent after enrollment. This left 405,432 UK Biobank participants for analysis.
Construction of Obesity Polygenic Risk Scores (PRS)
The limited PRS in each genomic cohort was calculated from 97 SNPs (Supplemental Table 3) associated with BMI at genome-wide significance in a prior meta-analysis of genome-wide association studies conducted by the Genetic Investigation of ANthropometric Traits (GIANT) Consortium.(11) The 97-SNP polygenic score was computed for each participant by multiplying the effect estimate at each allele by the genetic dosage of the effect allele, summing the values across all SNPs for each participant. Within the eMERGE cohort, we also calculated a 941-SNP PRS using data from meta-analysis of 681,275 individuals from GWAS analyses in the GIANT consortium studies and the UK Biobank.(12)
The genome-wide PRS was computed for each participant with the same procedure, using the best performing LDPred-adjusted values—from a model built assuming that 3% of variants are causal, and constructed with 2,100,302 variants—as described previously.(10) In this approach, each variant’s posterior mean effect is calculated based on the prior effect estimate and a shrinkage based on the variant’s correlation structure with other variants from the reference population.(41) As all sets were imputed to the same reference standard, we were able to use all SNPs for calculation of the genome-wide PRS. The BMI variance explained (adjusted R2) by the associated SNPs was calculated with individual-level genotype and phenotype data using linear regression models adjusted for site, age, sex, and the first 10 principal components.
eMERGE PheWAS
To calculate effect estimates for genetically-determined BMI on disease phenotypes, PheWAS was performed as described above using logistic regression models, adjusted for site, age, sex, and the first 10 principal components. For phenotypes already passing a Bonferroni significance threshold for association with class 3 obesity in the primary cohort, a false discovery rate (FDR) significance threshold <0.05 was used to assess for replication of obesity associations with the genomic score.51 Effect estimates for the 97-SNP score are reported per standard deviation (SD) difference in BMI (derived from beta estimates and SD of 4.8 kg/m2 in a prior GIANT cohort of 449,472 individuals).
In the eMERGE cohort, we performed association analyses utilizing both the 97-SNP PRS and a 941-SNP PRS to demonstrate the improvement of association results with increasing quantities of SNPs included in the PRS. The 941-SNP PRS was scaled to a mean of 0 and SD of 1 prior to PheWAS analysis. This analysis was not performed in the UK Biobank cohort to reduce bias due to sample overlap.
We similarly performed PheWAS using the genome-wide PRS, which was scaled to a mean of 0 and SD of 1 prior to analysis. Effect estimates were compared using correlation coefficient analysis to determine the similarity between clinical and genomic effect sizes.
UK Biobank PheWAS
ICD10 codes for hospitalizations were reported by the UK Biobank. These were translated into phecodes using mappings described previously.(42) For each phecode, a logistic regression model was computed, predicting the presence or absence of a phecode as a function of the polygenic score, sex, age at enrollment, the UK Biobank genotyping array, and the first ten principal components of ancestry. For phenotypes already passing a Bonferroni significance threshold for association with class 3 obesity in the primary cohort as well as showing significant association in the eMERGE genomic cohort, an FDR significance threshold <0.05 was used to assess for replication of obesity associations with the risk score.(35) These models were computed separately for the 97-SNP score and the genome-wide polygenic score. PRS was scaled to a mean of 0 and SD of 1 prior to PheWAS analysis. Effect estimates between cohorts were compared using Pearson correlation analysis. We further completed the genome-wide analysis with exclusion of Phase 1 of the UK Biobank cohort to limit any overfitting of the model utilizing Ldpred calculated values.
Results
Phenotypes Across BMI Categories in Clinical Cohort
We first performed a PheWAS of BMI in 736,726 adults (age >18 years) in a clinical cohort (Table S1). Of these individuals, 434,266 (58.9%) were female and the majority reported race as White (553,368, 75.1%) in the EHR. A median of 5 BMI assessments (IQR 2–13) were available per individual with a median BMI of 27.3 kg/m2 (IQR 23.6–32.0). Individuals with overweight or obese BMIs comprised 65.2% of the population.
The PheWAS was performed using separate models with both mean BMI and categorical BMI as the predictor using Bonferroni significance thresholds. Mean BMI was associated with risk of 504 phenotypes in the clinical cohort. Obesity class 3 was associated with risk of 433 clinical phenotypes (23.8% of 1816 phenotypes included in the analysis; Figure 2A) across all broad disease categories compared to normal BMI; 170 phenotypes also demonstrated positive association with overweight and lesser obesity classes (Figure 3). With increasing overweight or obesity class, there was a nearly linear increase in the number of positively associated phenotypes along with an increase in the odds ratios of the association (Figure 3). The most significant associations of overweight and obesity classes with phenotypes of chronic diseases included essential hypertension (odds ratio [OR] 1.48 [95% CI 1.46–1.50) - 4.97 [4.94–5.00], p < 1.0 × 10−300), type 2 diabetes (OR 1.68 [1.65–1.71] - 8.28 [8.25–8.32], p<2.1×10−289), obstructive sleep apnea (OR 2.68 [2.62–2.74] - 27.36 [27.30–27.42], p<4.0×10−221), and polycystic ovarian disorder (OR 3.07 [2.94–3.19] - 23.18 [23.06–23.29], p<1.1×10−72). Across phenotypes, effect sizes were higher for increasing BMI (Table 1). 59.3% of all billed diagnosis codes in individuals with class 3 obesity corresponded to a disease associated with BMI.
Figure 2. A. Association of Class 3 Obesity with Diseases in PheWAS. B. Association of Obesity 97-SNP PRS with Diseases in PheWAS in eMERGE Cohort. C. Association of Genome-wide PRS with Diseases in PheWAS in eMERGE Cohort.


Blue horizontal lines represent p = 0.05. Red horizontal lines represent Bonferroni significance threshold (p = 5.6 × 10⁻⁶) for clinical analysis [A] and false discovery rate significance threshold = 0.05 for genomic analysis [B-C]). Point direction relates to directionality of odds ratio: upward triangles are associated with increased risk for patients while downward triangles are associated with decreased risk.
Figure 3. Trends of Odds Ratios in Phenotypes Significantly Associated with Class 3 Obesity in PheWAS.

All phenotypes with significance in class 3 obesity are visualized (433 phenotypes with OR >1.0). Gray represents non-significant findings. Increasing odds ratios are seen with higher BMI for many phenotypes.
Table 1.
Associations Between BMI Categories and Common Phenotypes a
| Phenotype | Underweight <18.5 kg/m2 OR (95% CI) |
Overweight 25.0–29.9 kg/m2 OR (95% CI) |
Obesity Class 1 30.0–34.9 kg/m2 OR (95% CI) |
Obesity Class 2 35.0–39.9 kg/m2 OR (95% CI) |
Obesity Class 3 ≥40.0 kg/m2 OR (95% CI) |
|---|---|---|---|---|---|
| Type 2 Diabetes Mellitus | 0.81 (0.71–0.91) | 1.68 (1.65–1.71) b | 3.06 (3.04–3.10) b | 5.24 (5.21–5.27) b | 8.28 (8.25–8.32) b |
| Polycystic Ovaries | 0.45 (−0.05–0.95) | 3.07 (2.94–3.19) b | 6.44 (6.32–6.56) b | 13.36 (13.24–13.48) b | 23.18 (23.06–23.29) b |
| Vitamin Deficiency | 1.26 (1.15–1.37) | 1.09 (1.05–1.13) b | 1.33 (1.29–1.37) b | 1.76 (1.71–1.81) b | 2.65 (2.61–2.70) b |
| Hyperlipidemia | 0.49 (0.40–0.57) b | 1.64 (1.62–1.67) b | 2.17 (2.15–2.19) b | 2.66 (2.63–2.69) b | 3.06 (3.03–3.09) b |
| Gout | 0.60 (0.28–0.92) | 1.80 (1.73–1.97) b | 2.84 (2.77–2.91) b | 4.01 (3.92–4.09) b | 5.38 (5.30–5.47) b |
| Obstructive Sleep Apnea | 0.68 (0.41–0.95) | 2.67 (2.62–2.74) b | 6.00 (5.94–6.06) b | 12.29 (12.23–12.36) b | 27.36 (27.30–27.42) b |
| Essential Hypertension | 0.89 (0.83–0.95) | 1.48 (1.46–1.50) b | 2.23 (2.21–2.25) b | 3.24 (3.22–3.26) b | 4.97 (4.94–5.00) b |
| Ischemic Heart Disease | 1.05 (0.97–1.13) | 1.24 (1.21–1.26) b | 1.60 (1.57–1.63) b | 1.95 (1.91–1.98) b | 2.19 (2.15–2.23) b |
| Heart Failure with Preserved EF | 1.17 (0.93–1.41) | 1.35 (1.27–1.43) b | 2.40 (2.32–2.49) b | 4.52 (4.44–4.62) b | 9.05 (8.95–9.14) b |
| GERD | 1.25 (1.18–1.33) b | 1.23 (1.20–1.26) b | 1.43 (1.40–1.45) b | 1.67 (1.63–1.70) b | 2.05 (2.02–2.09) b |
| Osteoarthrosis | 0.58 (0.48–0.69) b | 1.53 (1.50–1.56) b | 2.10 (2.07–2.13) b | 2.71 (2.67–2.74) b | 3.71 (3.67–3.75) b |
| Asthma | 1.27 (1.17–1.36) b | 1.11 (1.08–1.15) b | 1.33 (1.29–1.37) b | 1.64 (1.59–1.69) b | 2.29 (2.24–2.33) b |
| Nonalcoholic Liver Disease | 1.04 (0.87–1.20) | 1.27 (1.22–1.32) b | 1.73 (1.68–1.79) b | 2.44 (2.37–2.50) b | 3.23 (3.18–3.30) b |
| Atrial Fibrillation | 1.23 (1.13–1.33) | 1.08 (1.04–1.11) | 1.33 (1.29–1.36) b | 1.67 (1.62–1.72) b | 2.46 (2.41–2.51) b |
| Superficial Cellulitis/Abscess | 1.18 (1.08–1.28) | 1.00 (0.97–1.04) | 1.19 (1.15–1.23) b | 1.52 (1.47–1.57) b | 2.14 (2.10–2.19) b |
Abbreviations: BMI, body mass index (calculated as weight in kilograms divided by height in meters squared); EF, ejection fraction; OR, odds ratio; CI, confidence interval
a Information shown in the table includes the most significant associations to class 3 obesity (by p-value) with exclusion of phenotypes definitive for obesity. For redundant phenotypes, those with strongest OR are shown. Reference odds ratio 1.0 represents normal median BMI.
b Results significant to Bonferroni corrected p-value of p = 5.6 × 10⁻⁶ compared to individuals with normal range BMI
Genetic Risk Score for Obesity
For the genomic analysis, we used 2 separate cohorts (Table S1). The first consisted of 65,174 individuals from 12 institutions within the Electronic Medical Records and Genomics (eMERGE) network (Table S2). The second cohort consisted of 405,432 participants within the UK Biobank. Individuals with overweight or obesity BMIs comprised 67.9% of the eMERGE cohort and 66.7% of the UK Biobank. A majority of both cohorts were of European ancestry (81.0% of eMERGE and 96.3% of the UK Biobank).
To evaluate the difference using SNPs known to be associated with BMI compared to a genome-wide association score in the eMERGE cohort, we performed the PheWAS analyses using both a limited PRS of 97 SNPs (Table S3), a more inclusive but limited 941-SNP PRS, and a genome-wide PRS of 2.1 million SNPs (Figure 2B–C). In the eMERGE cohort, the 97-SNP PRS explained 1.92% [95% CI 1.67–2.17] of the variance in mean BMI (p<2.0×10⁻¹⁶) (Figure S1A) and the 941-SNP PRS explained 4.46% [95% CI 4.10–4.83] of the variance in mean BMI (p<2.0×10⁻¹⁶). The genome-wide PRS explained 7.47% [7.01–7.92] of the variance in mean BMI (p<2.0×10⁻¹⁶), 3.9 times the variance explained by the 97-SNP PRS (Figure S1B).
In the eMERGE cohort, the 97-SNP obesity PRS was significantly associated with 161 (37.2 %) of the phenotypes showing association with class 3 obesity in the clinical cohort (Table S4) with OR demonstrating positive direction of effect (i.e., risk with increasing BMI). Excluding phenotypes definitive for obesity (e.g., bariatric surgery, morbid obesity, and localized adiposity), some of the most significant associations were with type 2 diabetes (OR 1.99 [95% CI 1.87–2.11], p=7.35×10⁻³²), sleep apnea (OR 2.24 [2.10–2.38], p=2.59×10⁻³¹), and hypertension (OR 1.82 [1.70–1.94], p=1.46×10⁻²³). Some of the strongest gene-association effect sizes were seen for panniculitis (OR 4.30 [3.73–4.87], p=5.3×10⁻⁷), non-healing surgical wounds (OR 3.16 [2.71–3.61], p=9.7×10⁻⁷), and polycystic ovaries (OR 2.7 [2.17–3.23], p=2.4×10⁻⁴). Only 8 phenotypes positively associated with the obesity 97-SNP PRS were not clinically associated with class 3 obesity (Table S5).
In the UK Biobank cohort, the 97-SNP obesity PRS was positively associated with 124 (28.6 %) of the phenotypes showing association with class 3 obesity in the clinical cohort (Figure S2). We replicated 77 of the associations with both class 3 obesity and the 97-SNP obesity PRS in the eMERGE cohort using the UK Biobank cohort (Table S6).
The PheWAS analysis performed in the eMERGE cohort utilizing the 941-SNP PRS also showed a positive association with 235 (54.3%) of the phenotypes associated with class 3 obesity in the clinical cohort. Using the eMERGE cohort, the genome-wide PRS (Figure 2C) showed a positive association with 296 (68.4%) of the phenotypes associated with class 3 obesity in the clinical cohort (Table S7), replicating 135 more phenotype associations than the PRS with only 97 SNPs and 61 more phenotype associations that the 941-SNP PRS. PheWAS using the genome-wide PRS in the UK Biobank (Figure S3) replicated 255 of the phenotype associations seen in class 3 obesity, replicating 131 more phenotypes that then 97-SNP PRS.
There were 199 phenotype associations replicated in the clinical data set and both genomic data sets using the genome-wide PRS (Table S8) compared to 77 phenotypes replicated in all 3 cohorts using the 97-SNP PRS. Disease associations with obesity were replicated in all data sets (clinical, eMERGE, and UK Biobank) across all predefined PheWAS disease classes: infections (bacterial infection, septicemia), neoplastic (uterine and renal cancer), endocrine (diabetes, hypothyroidism), hematologic (anemia), psychiatric (major depressive disorder), cardiovascular (hypertension, ischemic heart disease, chronic venous insufficiency), respiratory (sleep apnea, pulmonary hypertension), digestive (cholelithiasis, esophagitis, gastroesophageal reflux, liver disease), urologic (renal failure), rheumatologic (rheumatoid arthritis, gout), musculoskeletal (osteoarthritis, lumbar disc displacement), and dermatologic (psoriasis, hidradenitis).
We performed the analysis with exclusion of individuals in Phase 1 of the UK Biobank cohort to confirm absence of overfitting. This resulted in exclusion of 171,871 individual (n = 233,561 participants remaining). The majority (141 phenotypes) remained significant in all 3 cohorts.
For the 199 phenotypes replicated in the 3 separate primary analyses, measured effect sizes for the genomic associations strongly correlated with observed BMI effect sizes in the clinical cohort (R2 = 0.54, p <2.2×10⁻¹⁶; Figure 4, Table S9). When observation and genomic effect sizes for all phenotypes, regardless of significance were compared, the correlation was inferior to the use of only phenotypes meeting significance thresholds (R2 = 0.32, p <2.2×10⁻¹⁶, Figure S4).
Figure 4. Clinically observed versus Genome-wide Obesity PRS PheWAS Effect Sizes.

Each dot represents a phenotype significantly associated with both class 3 obesity in clinical cohort and calculated genome-wide obesity polygenic risk score for obesity in eMERGE and UK biobank cohorts. 199 total phenotypes. The genome-wide PRS was scaled to a mean of 0 and SD of 1 prior to PheWAS analysis. Red line represents linear regression. Adjusted R2 = 0.544.
Discussion
Through a combined genome- and phenome- wide approach in both clinical and genomic cohorts, this study confirms that obesity is associated with a considerable burden of disease across all disease classes. Nearly one-quarter of disease phenotypes, across all major disease domains, were associated with class 3 obesity. The phenotypes associated with class 2 and 3 obesity resulted in over 50% of billed diagnosis codes in those individuals. Almost 200 phenotypes were associated with both class 3 obesity and genetic risk for obesity with a strong correlation between effect sizes for phenotype associations with genetic risk for obesity compared to phenotype associations with measured BMI.
The genome-wide approach in this study detected 2.5x the number of significant phenotype associations with genetic risk for obesity compared to the limited PRS. Thus, despite the conservative study methods requiring 3 cohorts and family-wise significance thresholds, the use of a phenome-wide approach coupled to a genome-wide PRS allowed this study to identify novel associations of genetically-determined BMI with diseases, including increased risk of renal failure, urinary calculus, bundle branch block, cardiomyopathy, venous insufficiency, gastroesophageal reflux, spinal stenosis, tendon rupture, and rheumatoid arthritis. Other interesting associations with little previous data were also supported by our study including asthma, cholelithiasis(16), postoperative complications, and major depression.
Resolution of obesity in some individuals can reduce disease burden for specific phenotypes. It is well-described that bariatric surgery can induce rapid reduction and cure of diabetes, hyperlipidemia, hypertension, and obstructive sleep apnea.(44) However, in individuals with obesity, many of the associated phenotypes will have already developed and are unlikely to be cured with weight-loss alone, and our analysis does not elucidate which diseases may regress with weight loss. For example, obesity was strongly associated with end-organ dysfunction, including cardiac, renal, or liver failure, evidence of long-standing effects from obesity. These data suggest that treatment of obesity may be a crucial component to ameliorate disease progression for a broader range of diseases than previously considered. The breadth of disease associated with obesity substantiates the principle that primary obesity prevention could have an enormous impact on healthcare, surpassing that of medical or surgical weight-loss alone.
This study has limitations. The method relies on BMI and billing codes recorded in the EHR; however, this measure may not fully capture the true impact for some phenotypes (e.g., lifetime exposure of obesity). For some individuals, their entrance into a tertiary care health system occurs following a change in their health state that may also have affected his or her presenting BMI, thus we were unable to fully assess the temporal relationship between observations and BMI. As for the phenotypes, for the clinical and eMERGE analyses, ICD10 codes were not yet available for use; however, they were minimally used at the time of this data collection. ICD10 codes were however used in the phenotype mapping in the analysis using data from the UK Biobank. The phenotype coding system also can have a significant amount of overlap as it is a hierarchical structure; however, we were able to confirm that at least 95 of the phenotype disease associations were clinically unique. Another limitation of this study is the potential lack of correlation to non-European populations. The majority of the 3 cohorts primarily consisted individuals of European descent, including 95% of the UK Biobank individuals. It has been well-established that the predictive power of many PRSs are improved in European populations, and as such our PRS may under or overestimate the associations of phenotypes with genetic risk for obesity in non-European populations.(45) Due to participant deidentification, there is a unquantifiable number of individuals that participate in both the Vanderbilt clinical cohort (up to 2.6%) and the eMERGE genomic cohort (up to 30%), which may cause the clinical and genomic effect sizes in these two cohorts to appear more similar than they would be in nonoverlapping populations. We are unable to confirm no sample overlap between the eMERGE cohort and the cohorts used for the GWAS meta-analysis performed by Locke et al; however, we believe it was likely minimal as none of the cohorts incorporated in the meta-analysis were from the eMERGE network. Lastly, while we found strong associations of genetic risk for obesity with almost 200 diseases, these methods do not prove causality.
This study is among the first and largest to demonstrate the significant role that genetic risk for obesity plays in a systematic spectrum of diseases and the overall healthcare burden imposed by obesity. This comprehensive evidence on disease risk associated with obesity emphasizes the major impact of obesity on the incidence of disease and also identified several novel associations of diseases with obesity, including renal failure, gastroesophageal reflux, and venous insufficiency. These extensive associations validate the importance of viewing obesity not as a single disease in clinical practice, but an indicator of other potentially less evident diseases. Given the strong genetic and environmental contributors to obesity, future studies should assess the influence that environmental modifications, such as diet and exercise starting at a young age, in the setting of strong polygenic risk for obesity could have on the development of subsequent comorbidities.
Supplementary Material
What is already known about this subject?
High body mass index (BMI) is associated with many comorbidities and mortality.
There are strong genetic risk factors for the development of obesity.
Genetic risk factors for obesity are also associated with increased risk for other associated diseases.
What are the new findings in your manuscript?
Almost one-quarter of disease phenotypes in all major areas of healthcare are associated with class 3 obesity.
A genome-wide approach to defining disease associations with genetic risk for obesity identified 200 disease phenotypes associated with genetic risk for obesity.
Identified novel associations of genetically-determined BMI with diseases, including increased risk of renal failure, venous insufficiency, gastroesophageal reflux, and rheumatoid arthritis, among others.
How might your results change the direction of research or the focus of clinical practice?
This study demonstrates the significant role that genetic risk for obesity plays in a systematic spectrum of diseases. This study emphasizes the importance of the use of polygenic risk scores and a genome-wide approach in association analyses to identify novel findings in future research studies. It also validates the importance of viewing obesity not as a single disease in clinical practice, but an indicator of other potentially less evident diseases.
ACKNOWLEDGEMENTS
JR Robinson received support by the 5T15LM007450 training grant from the National Library of Medicine. Support for the research and personnel was provided by the R01LM010685 grant from the National Library of Medicine and R01GM114128 from the National Institutes of Health. The eMERGE sites were funded through several series of grants from the National Human Genome Research Institute: U01HG8657, U01HG006375, U01HG004610 (Kaiser Permanente Washington/University of Washington); U01HG8685 (Brigham and Women’s Hospital); U01HG8672, U01HG006378, U01HG004608 (Vanderbilt University Medical Center); U01HG8666, U01HG006828 (Cincinnati Children’s Hospital Medical Center); U01HG6379, U01HG04599 (Mayo Clinic); U01HG8679, U01HG006382 (Geisinger Clinic); U01HG008680 (Columbia University Health Sciences); U01HG8684, U01HG006830 (Children’s Hospital of Philadelphia); U01HG8673, U01HG006388, U01HG004609 (Northwestern University); U01HG8676 (Partners Healthcare/Broad Institute); U01HG8664 (Baylor College of Medicine); U01HG006389 (Essentia Institute of Rural Health, Marshfield Clinic Research Foundation and Pennsylvania State University); U01HG006380 (Icahn School of Medicine at Mount Sinai); U01HG8701, U01HG006385, U01HG04603 (Vanderbilt University Medical Center serving as the Coordinating Center); eMERGE Genotyping Centers were also funded through U01HG004438 (CIDR) and U01HG004424 (the Broad Institute). Vanderbilt University Medical Center’s Synthetic Derivative and BioVU are supported by institutional funding and by the CTSA grant ULTR000445 from NCATS/NIH. AV Khera received support from grants 1K08HG010155 and 5UM1HG008895 from the National Human Genome Research Institute, a Hassenfeld Scholar Award from Massachusetts General Hospital, a Merkin Institute Fellowship from the Broad Institute of MIT and Harvard, and a sponsored research agreement from IBM Research. The vast majority of the JCD’s work for this project was while he was on faculty at Vanderbilt University before joining the NIH.
Footnotes
The authors have no conflicts of interest to disclose.
REFERENCES
- 1.Ogden CL, Carroll MD, Kit BK, Flegal KM. Prevalence of childhood and adult obesity in the United States, 2011–2012. JAMA 2014; 311:806–814. [DOI] [PMC free article] [PubMed] [Google Scholar]
- 2.GBD 2015 Obesity Collaborators, Afshin A, Forouzanfar MH, et al. Health Effects of Overweight and Obesity in 195 Countries over 25 Years. N Engl J Med 2017; 377:13–27. [DOI] [PMC free article] [PubMed] [Google Scholar]
- 3.NCD Risk Factor Collaboration (NCD-RisC). Trends in adult body-mass index in 200 countries from 1975 to 2014: a pooled analysis of 1698 population-based measurement studies with 19·2 million participants. Lancet Lond Engl 2016; 387:1377–1396. [DOI] [PMC free article] [PubMed] [Google Scholar]
- 4.Global BMI Mortality Collaboration null, Di Angelantonio E, Bhupathiraju S, et al. Body-mass index and all-cause mortality: individual-participant-data meta-analysis of 239 prospective studies in four continents. Lancet Lond Engl 2016; 388:776–786. [DOI] [PMC free article] [PubMed] [Google Scholar]
- 5.Prospective Studies Collaboration, Whitlock G, Lewington S, et al. Body-mass index and cause-specific mortality in 900 000 adults: collaborative analyses of 57 prospective studies. Lancet Lond Engl 2009; 373:1083–1096. [DOI] [PMC free article] [PubMed] [Google Scholar]
- 6.Emerging Risk Factors Collaboration, Wormser D, Kaptoge S, et al. Separate and combined associations of body-mass index and abdominal adiposity with cardiovascular disease: collaborative analysis of 58 prospective studies. Lancet Lond Engl 2011; 377:1085–1095. [DOI] [PMC free article] [PubMed] [Google Scholar]
- 7.Yeo GS, Farooqi IS, Aminian S, Halsall DJ, Stanhope RG, O’Rahilly S. A frameshift mutation in MC4R associated with dominantly inherited human obesity. Nat Genet 1998; 20:111–112. [DOI] [PubMed] [Google Scholar]
- 8.Montague CT, Farooqi IS, Whitehead JP, et al. Congenital leptin deficiency is associated with severe early-onset obesity in humans. Nature 1997; 387:903–908. [DOI] [PubMed] [Google Scholar]
- 9.O’Rahilly S Human genetics illuminates the paths to metabolic disease. Nature 2009; 462:307–314. [DOI] [PubMed] [Google Scholar]
- 10.Khera AV, Chaffin M, Wade KH, et al. Polygenic Prediction of Weight and Obesity Trajectories from Birth to Adulthood. Cell 2019; 177:587–596.e9. [DOI] [PMC free article] [PubMed] [Google Scholar]
- 11.Locke AE, Kahali B, Berndt SI, et al. Genetic studies of body mass index yield new insights for obesity biology. Nature 2015; 518:197–206. [DOI] [PMC free article] [PubMed] [Google Scholar]
- 12.Yengo L, Sidorenko J, Kemper KE, et al. Meta-analysis of genome-wide association studies for height and body mass index in ∼700000 individuals of European ancestry. Hum Mol Genet 2018; 27:3641–3649. [DOI] [PMC free article] [PubMed] [Google Scholar]
- 13.Nordestgaard BG, Palmer TM, Benn M, et al. The effect of elevated body mass index on ischemic heart disease risk: causal estimates from a Mendelian randomisation approach. PLoS Med 2012; 9:e1001212. [DOI] [PMC free article] [PubMed] [Google Scholar]
- 14.Lyall DM, Celis-Morales C, Ward J, et al. Association of Body Mass Index With Cardiometabolic Disease in the UK Biobank: A Mendelian Randomization Study. JAMA Cardiol 2017; 2:882–889. [DOI] [PMC free article] [PubMed] [Google Scholar]
- 15.Chatterjee NA, Giulianini F, Geelhoed B, et al. Genetic Obesity and the Risk of Atrial Fibrillation: Causal Estimates from Mendelian Randomization. Circulation 2017; 135:741–754. [DOI] [PMC free article] [PubMed] [Google Scholar]
- 16.Stender S, Nordestgaard BG, Tybjaerg-Hansen A. Elevated body mass index as a causal risk factor for symptomatic gallstone disease: a Mendelian randomization study. Hepatol Baltim Md 2013; 58:2133–2141. [DOI] [PubMed] [Google Scholar]
- 17.Panoutsopoulou K, Metrustry S, Doherty SA, et al. The effect of FTO variation on increased osteoarthritis risk is mediated through body mass index: a Mendelian randomisation study. Ann Rheum Dis 2014; 73:2082–2086. [DOI] [PMC free article] [PubMed] [Google Scholar]
- 18.Lindström S, Germain M, Crous-Bou M, et al. Assessing the causal relationship between obesity and venous thromboembolism through a Mendelian Randomization study. Hum Genet 2017; 136:897–902. [DOI] [PMC free article] [PubMed] [Google Scholar]
- 19.Huang Y, Xu M, Xie L, et al. Obesity and peripheral arterial disease: A Mendelian Randomization analysis. Atherosclerosis 2016; 247:218–224. [DOI] [PubMed] [Google Scholar]
- 20.Mokry LE, Ross S, Timpson NJ, Sawcer S, Davey Smith G, Richards JB. Obesity and Multiple Sclerosis: A Mendelian Randomization Study. PLoS Med 2016; 13:e1002053. [DOI] [PMC free article] [PubMed] [Google Scholar]
- 21.Gianfrancesco MA, Glymour MM, Walter S, et al. Causal Effect of Genetic Variants Associated With Body Mass Index on Multiple Sclerosis Susceptibility. Am J Epidemiol 2017; 185:162–171. [DOI] [PMC free article] [PubMed] [Google Scholar]
- 22.Thrift AP, Shaheen NJ, Gammon MD, et al. Obesity and risk of esophageal adenocarcinoma and Barrett’s esophagus: a Mendelian randomization study. J Natl Cancer Inst 2014; 106. [DOI] [PMC free article] [PubMed] [Google Scholar]
- 23.Jarvis D, Mitchell JS, Law PJ, et al. Mendelian randomisation analysis strongly implicates adiposity with risk of developing colorectal cancer. Br J Cancer 2016; 115:266–272. [DOI] [PMC free article] [PubMed] [Google Scholar]
- 24.Dixon SC, Nagle CM, Thrift AP, et al. Adult body mass index and risk of ovarian cancer by subtype: a Mendelian randomization study. Int J Epidemiol 2016; 45:884–895. [DOI] [PMC free article] [PubMed] [Google Scholar]
- 25.Millard LAC, Davies NM, Timpson NJ, Tilling K, Flach PA, Davey Smith G. MR-PheWAS: hypothesis prioritization among potential causal effects of body mass index on many outcomes, using Mendelian randomization. Sci Rep 2015; 5:16645. [DOI] [PMC free article] [PubMed] [Google Scholar]
- 26.He C, Zhang M, Li J, et al. Novel insights into the consequences of obesity: a phenotype-wide Mendelian randomization study. Eur J Hum Genet 2022. [DOI] [PMC free article] [PubMed]
- 27.Mars N, Koskela JT, Ripatti P, et al. Polygenic and clinical risk scores and their impact on age at onset and prediction of cardiometabolic diseases and common cancers. Nat Med 2020; 26:549–557. [DOI] [PubMed] [Google Scholar]
- 28.Denny JC, Ritchie MD, Basford MA, et al. PheWAS: demonstrating the feasibility of a phenome-wide scan to discover gene-disease associations. Bioinforma Oxf Engl 2010; 26:1205–1210. [DOI] [PMC free article] [PubMed] [Google Scholar]
- 29.Ritchie MD, Denny JC, Crawford DC, et al. Robust replication of genotype-phenotype associations across multiple diseases in an electronic medical record. Am J Hum Genet 2010; 86:560–572. [DOI] [PMC free article] [PubMed] [Google Scholar]
- 30.Roden DM, Pulley JM, Basford MA, et al. Development of a large-scale de-identified DNA biobank to enable personalized medicine. Clin Pharmacol Ther 2008; 84:362–369. [DOI] [PMC free article] [PubMed] [Google Scholar]
- 31.Robinson JR, Wei W-Q, Roden DM, Denny JC. Defining Phenotypes from Clinical Data to Drive Genomic Research. Annu Rev Biomed Data Sci 2018;In Publication. [DOI] [PMC free article] [PubMed]
- 32.Anon. (2017). Defining Adult Overweight and Obesity | Overweight & Obesity | CDC [WWW document]. URL https://www.cdc.gov/obesity/adult/defining.html
- 33.Wei W-Q, Bastarache LA, Carroll RJ, et al. Evaluating phecodes, clinical classification software, and ICD-9-CM codes for phenome-wide association studies in the electronic health record. PloS One 2017; 12:e0175508. [DOI] [PMC free article] [PubMed] [Google Scholar]
- 34.Carroll RJ, Bastarache L, Denny JC. R PheWAS: data analysis and plotting tools for phenome-wide association studies in the R environment. Bioinforma Oxf Engl 2014; 30:2375–2376. [DOI] [PMC free article] [PubMed] [Google Scholar]
- 35.Anon. (2017). R Core Team (2018). R: A language and environment for statistical computing R Foundation for Statistical Computing, Vienna, Austria. [WWW document]. URL https://www.r-project.org/ [Google Scholar]
- 36.Gottesman O, Kuivaniemi H, Tromp G, et al. The Electronic Medical Records and Genomics (eMERGE) Network: past, present, and future. Genet Med Off J Am Coll Med Genet 2013; 15:761–771. [DOI] [PMC free article] [PubMed] [Google Scholar]
- 37.Anon. (2018). Michigan Imputation Server [WWW document]. URL https://imputationserver.sph.umich.edu/index.html
- 38.McCarthy S, Das S, Kretzschmar W, et al. A reference panel of 64,976 haplotypes for genotype imputation. Nat Genet 2016; 48:1279–1283. [DOI] [PMC free article] [PubMed] [Google Scholar]
- 39.Purcell S, Neale B, Todd-Brown K, et al. PLINK: a tool set for whole-genome association and population-based linkage analyses. Am J Hum Genet 2007; 81:559–575. [DOI] [PMC free article] [PubMed] [Google Scholar]
- 40.Bycroft C, Freeman C, Petkova D, et al. The UK Biobank resource with deep phenotyping and genomic data. Nature 2018; 562:203–209. [DOI] [PMC free article] [PubMed] [Google Scholar]
- 41.Vilhjálmsson BJ, Yang J, Finucane HK, et al. Modeling Linkage Disequilibrium Increases Accuracy of Polygenic Risk Scores. Am J Hum Genet 2015; 97:576–592. [DOI] [PMC free article] [PubMed] [Google Scholar]
- 42.Wu P, Gifford A, Meng X, et al. Mapping ICD-10 and ICD-10-CM Codes to Phecodes: Workflow Development and Initial Evaluation. JMIR Med Inform 2019; 7:e14325. [DOI] [PMC free article] [PubMed] [Google Scholar]
- 43.Robinson JR, Carroll RJ, Bastarache L, et al. Association of Genetic Risk of Obesity with Postoperative Complications Using Mendelian Randomization. World J Surg 2020; 44:84–94. [DOI] [PMC free article] [PubMed] [Google Scholar]
- 44.Anon. (2018.) Bariatric surgery: a systematic review and meta-analysis. - PubMed - NCBI [WWW document]. URL https://www.ncbi.nlm.nih.gov/pubmed/15479938
- 45.Martin AR, Kanai M, Kamatani Y, Okada Y, Neale BM, Daly MJ. Clinical use of current polygenic risk scores may exacerbate health disparities. Nat Genet 2019; 51:584–591. [DOI] [PMC free article] [PubMed] [Google Scholar]
Associated Data
This section collects any data citations, data availability statements, or supplementary materials included in this article.