



SUMMARY
Food-handling offers unique yet largely unexplored opportunities to investigate how cortical activity relates to forelimb movements in a natural, ethologically essential, and kinematically rich form of manual dexterity. To determine these relationships, we recorded high speed (1000 fps) video and multi-channel electrophysiological cortical spiking activity while mice handled food. The high temporal resolution of the video allowed us to decompose active manipulation (‘oromanual’) events into characteristic submovements, enabling event-aligned analysis of cortical activity. Activity in forelimb M1 was strongly modulated during food-handling, generally higher during oromanual events and lower during holding intervals. Optogenetic silencing and stimulation of forelimb M1 neurons partially affected food-handling movements, exerting suppressive and activating effects, respectively. We also extended the analysis to forelimb S1 and lateral M1, finding broadly similar oromanual-related activity across all three areas. However, each area’s activity displayed a distinct timing and phasic/tonic temporal profile, which further analysis by non-negative matrix factorization demonstrated to be attributable to area-specific composition of activity classes. Current or future forelimb position could be accurately predicted from activity in all three regions, indicating that the cortical activity in these areas contains high information content about forelimb movements during food-handling. These results thus establish that cortical activity during food-handling is manipulation-specific, distributed, and broadly similar across multiple sensorimotor areas, while also exhibiting area- and submovement-specific relationships with the fast kinematic hallmarks of this natural form of complex, free-object-handling manual dexterity.
eTOC Blurb
Barrett et al. use high-speed video and multi-electrode recordings to investigate the neural basis of food-handling, an ethologically critical forelimb behavior in rodents, primates, and other manually dexterous animals. Multiple areas of mouse neocortex show activity changes that encode forelimb position during dexterous oromanual manipulation.
INTRODUCTION
Dexterity takes many forms1. For learned behaviors such as reach-to-grasp, manipulandum-based tasks, and skilled licking, knowledge is rapidly advancing about the associated neural circuits and systems2–4. However, the necessity of studying naturalistic behavior is also increasingly appreciated5–8. Food-handling is a natural, ethologically critical, dexterous behavior prominent in primates and rodents including mice9, 10. Food-handling entails tight interaction between motor output and sensory input as the morsel is manipulated and consumed, and has temporal structure on multiple time scales, from the millisecond-scale features of the fastest submovements of the hands up to the tens of seconds it takes to handle and consume larger food items. These properties make food-handling an attractive complement to skill-learning forms of manual dexterity. Rodent food-handling of morsels such as seeds and spaghetti9–11 has been characterized kinematically, and used to test forelimb function in rodent neurological studies12. However, the underlying neural basis of food-handling remains virtually unexplored (but see13). Hence, to establish a foundation for studying the neurobiology of food-handling we investigated sensorimotor cortical activity associated with food-handling in mice.
Forelimb motor cortex (M1) is involved in many forms of manual dexterity and thus presents a starting point for investigating cortical roles in food-handling. On the one hand, M1 involvement might be minimal: silencing it affects newly learned reach-to-grasp but not grooming-related forelimb movements14; it disengages over time on well-learned tasks15–18; and, brainstem stimulation alone can evoke food-handling-like movements19. Conversely, cortical stimulation in motor areas also evokes food-handling-like behaviors in primates20 and mice21, 22; motor cortical lesions impair food-handling in rats 9; and M1 neurons exhibit diverse movement-related activity23–26.
Here, we used multielectrode array recordings from forelimb M1 and related cortical regions, combined with high-speed (1000 fps) videography, to capture neuronal spiking and kinematics at high time resolution during food-handling. This approach enabled us to detect robust modulation of activity in forelimb M1 during active manipulation events, identify influences of forelimb M1 activity manipulation on specific submovements, and characterize manipulation-related activity in additional sensorimotor cortical regions.
RESULTS
Forelimb M1 activity during food-handling is associated with oromanual events
To investigate cortical activity during food-handling, we presented head-fixed mice with food items (sunflower seed kernels or grain pellets) and filmed close-up dual-angle kilohertz-rate video while recording spiking activity from all cortical layers on multi-channel linear electrode arrays (one shank/array, 32 channels/shank, 50-μm spacing) as they handled and consumed the morsels (Figure 1, Videos S1–2, STAR Methods). To capture kinematic and cortical activity on the extended time scale of sustained food-handling, recordings were made over tens of seconds (range: 11.7 to 97.5 sec).
Figure 1: Forelimb M1 activity during food-handling is associated with oromanual events.
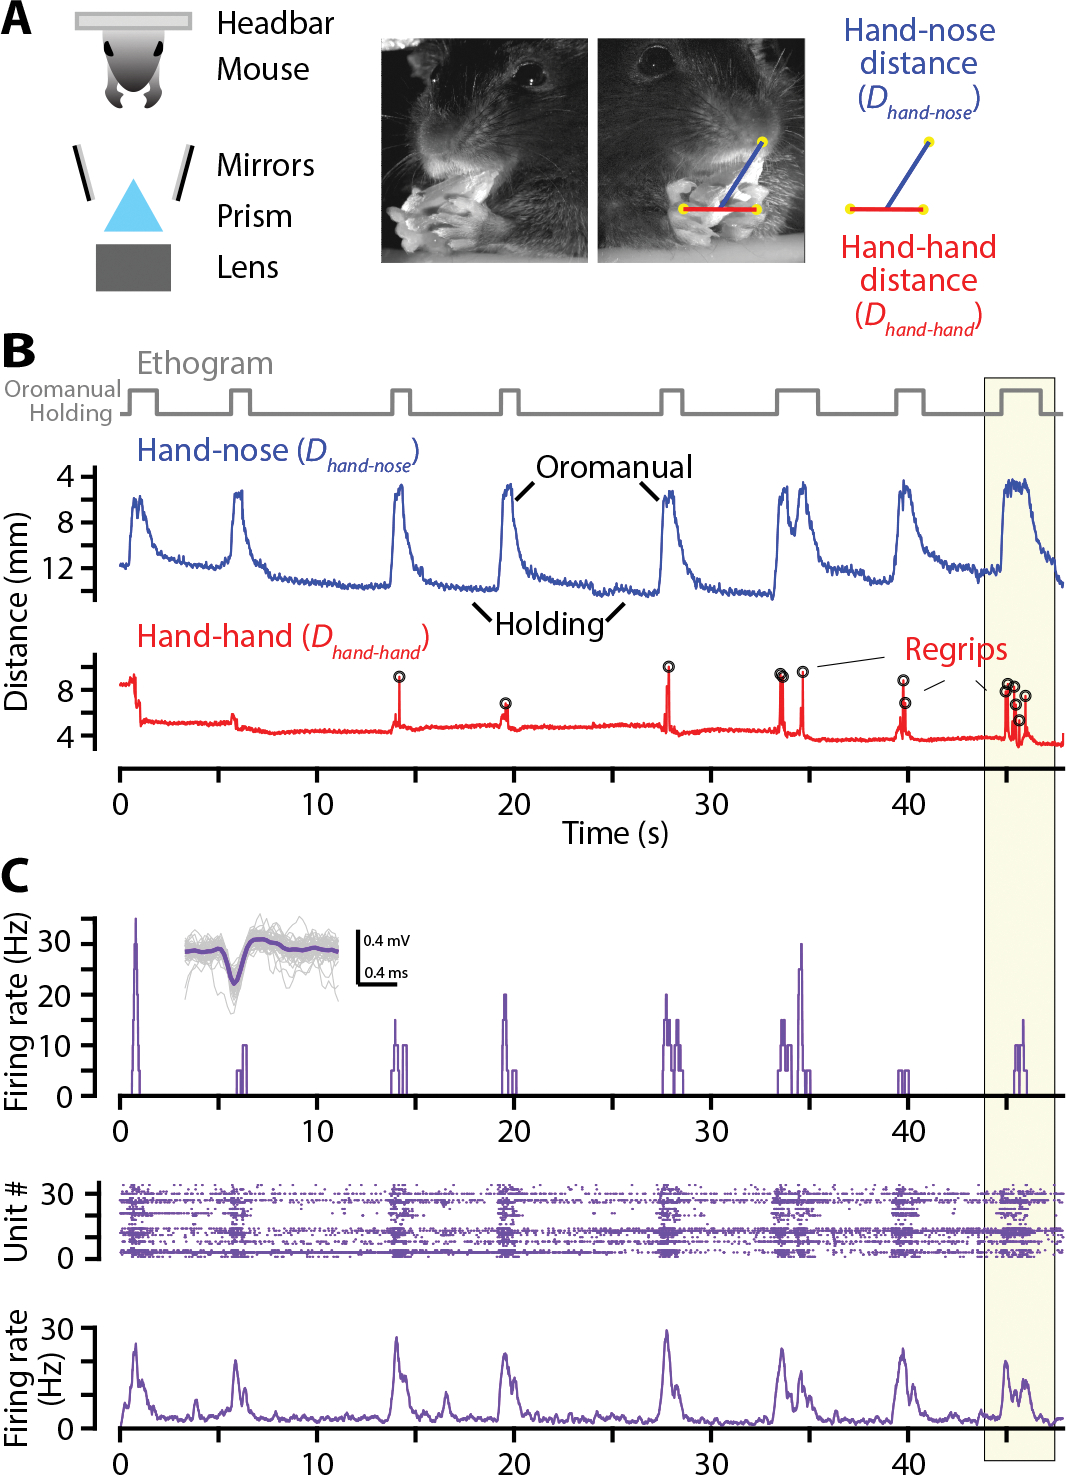
(A) Left: schematic of experimental set-up. Right: example video frames, with the hand-nose (Dhand-nose, blue) and hand-hand (Dhand-hand, red) distances annotated on the far right.
(B) Example Dhand-nose (blue, top, reverse Y axis) and Dhand-hand (right, bottom) traces. Peaks and troughs in Dhand-nose correspond to oromanual events and holding intervals, while regrips appear as spikes in Dhand-hand.
(C) Top: firing rate of a forelimb M1 single unit recorded simultaneously with the traces in (B). Inset: Example single unit. Middle: raster plot of spiking recorded on multiple channels on the same probe. Bottom: average firing rate across all units recorded on the same probe.
We tracked movements of the hands and nose, reconstructed 3D trajectories, and extracted kinematic parameters of interest (STAR Methods). We focused on the 3D Euclidean hand-nose (Dhand-nose) and hand-hand (Dhand-hand) distances (Figure 1A), which accounted for most of the kinematic variance (67 ± 15%, mean ± s.d.; n = 9 mice; Figure S1A, Table S1, STAR Methods). Plotting these parameters over time (with Dhand-nose on a reverse Y axis to reflect upward hand movements) showed characteristic features (Figure 1B), including broad peaks in Dhand-nose indicating “oromanual” events in which the hands brought the food item to the mouth, longer “holding” intervals in which the food item was held passively below the mouth, and fast spikes in Dhand-hand during oromanual events as the hands quickly readjusted their grip on the food (“regrips”).
Electrophysiological recordings from cortex were analyzed to extract single- and multi-unit spiking activity (Figure 1C, STAR Methods, 14 ± 12 single- and 32 ± 9 multi-units per recording, mean ± s.d., n = 15 recordings from all regions, Table S1). Single- and multi-units (“active units”) were included in all analyses of spiking activity. Plotting the firing rate of an example forelimb M1 recording showed bursts of activity aligned with oromanual events. Such patterns were apparent across recordings (Figure S2). Accordingly, we created oromanual/holding ethograms (STAR Methods) from the Dhand-nose traces and calculated average firing rates during these periods. Across animals, forelimb M1 firing rates almost doubled during oromanual events compared to holding (holding 5.2 ± 2.1 Hz, mean ± s.d.; oromanual 9.0 ± 4.2 Hz; W = 0, p = 0.031, Wilcoxon signed-rank test, n = 6 mice with forelimb M1 recordings). To facilitate finer investigation of this oromanual-associated firing, we analyzed the kinematic features of oromanual events in greater detail.
Oromanual kinematics: submovement composition and modulation by forelimb M1 activity manipulations
Closer inspection of oromanual events shows they are composed of several distinct kinematic features, including a rapid, upward, “transport-to-mouth” movement (reduction in Dhand-nose) as the food is brought to the mouth, and a slower, downward, “lowering-from-mouth” movement (increase in Dhand-nose) as the hands drop to a holding posture while the mouse chews (Figure 2A,B). Regrips (spikes in Dhand-hand) occur during oromanual events. Quantification of these features (STAR Methods) showed that transport-to-mouth movements were large (4.7 ± 1.6 mm, mean ± s.d., n = 9 mice, Table S2) and brief (244 ± 106 ms). Lowering-from-mouth movements were similarly large (4.7 ± 1.5 mm) but of longer duration (4.1 ± 1.3 s). Regrips were fast and roughly bell-shaped (3.0 ± 0.7 mm; 27 ± 9 ms). The low coefficients of variation for various kinematic parameters, particularly amplitudes, indicate these movements were fairly stereotyped (Table S2). Oromanual events on average lasted 2.8 ± 1.2 s, with 3.8 ± 1.5 regrips per event, usually early on (latency to first regrip: 206 ± 56 ms, median ± m.a.d.).
Figure 2: Oromanual kinematics: submovement composition and modulation by forelimb M1 activity manipulations.
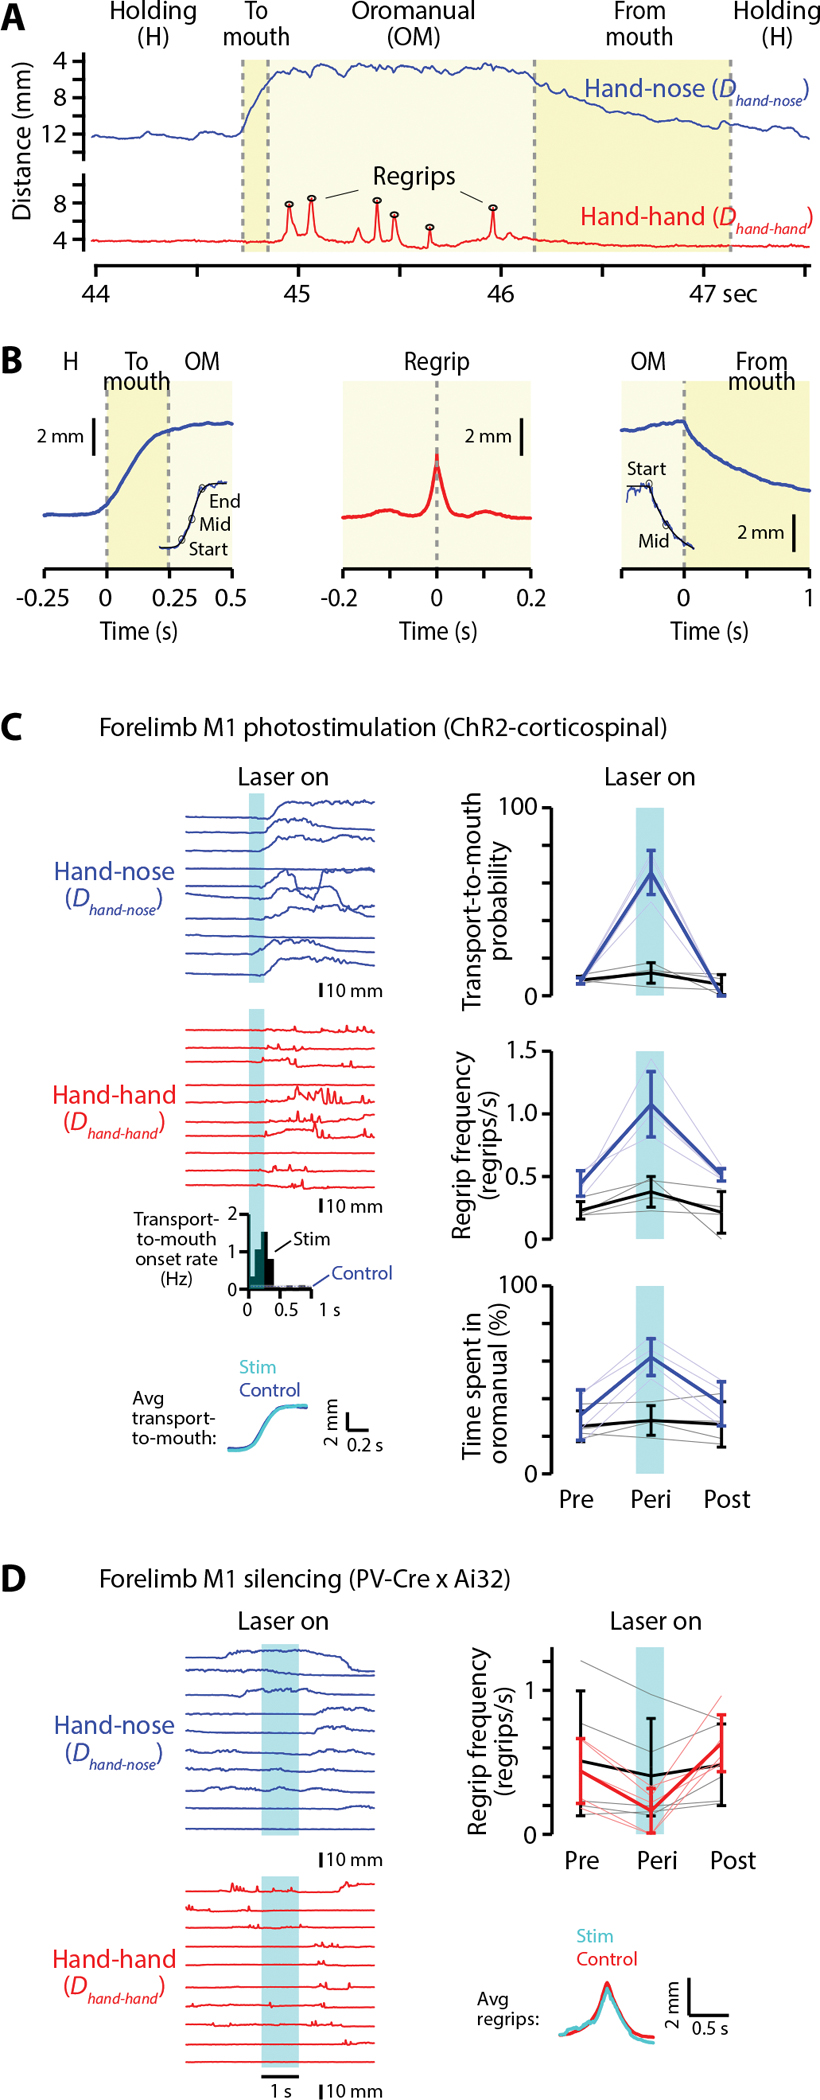
(A) Dhand-nose (blue) and Dhand-hand (red) traces of an example oromanual event (highlighted event in Figure 1A).
(B) Event-aligned and averaged transport-to-mouth (left), regrip (middle), and lowering-from-mouth (right) movements. Error bands indicate mean ± s.d for n = 9 mice. Insets show example curve fits to identify the start, middle, and end points of movements (STAR Methods).
(C) Left: Example Dhand-nose (blue, top) and Dhand-hand (red, middle) traces during optogenetic stimulation. The peristimulus time histogram below shows the rate of transport-to-mouth movements in 100 ms bins following stimulus onset when stimulation was delivered during holding for n = 4 ChR2-expressing mice. Thin lines (‘Control’) indicate the background rate (‘Control’) (blue dashed: mean; solid grey: ±2 s.d.). Bottom left: average transport-to-mouth trajectories immediately following stimulation (cyan) and at all other times (blue). Top right: probability of observing a transport-to-mouth movement within 400 ms of stimulus onset (‘Peri’) compared to virtual stimulus timings shifted one second earlier (‘Pre’) or later (‘Post’), when stimulation occurred during holding, for mice expressing ChR2 in corticospinal neurons (blue, n = 4 mice) or control mice (GFP in corticospinal neurons or failed transfection, black, n = 4 mice). Middle right: mean frequency of regrips on all trials in the two seconds before (‘Pre’), one second during and immediately after stimulation (‘Peri’) and the following 2.4 seconds (‘Post’). Bottom right: same, but for percentage of time spent in oromanual. Thin lines are individual mice, thick error bars are mean ± s.d. over mice.
(D) Left: Example Dhand-nose (blue, top) and Dhand-hand (red, bottom) traces during optogenetic silencing. Top right: Regrip frequency in the one second windows before (‘Pre’), during (‘Peri’), and after (‘Post’) silencing for wild-type (black, n = 5 mice) or PVxAi32 (red, n = 5 mice) mice. Thin lines are individual mice, thick error bars are mean ± s.d. over mice. Bottom right: average regrip trajectories between (red, n = 5 PVxAi32 mice) and during silencing trials (cyan, n = 3 PVxAi32 mice with regrips during silencing).
We next probed how transient optogenetic activation of forelimb M1 affected food-handling kinematics (Table S1). To do so, we expressed ChR2 in corticospinal neurons (STAR Methods), which directly link forelimb M1 to cervical spinal circuits controlling the forelimb musculature. Corticospinal activation during holding intervals evoked transport-to-mouth movements followed by oromanual events in ChR2-expressing but not control mice (Figure 2C, Video S4, Table S3). Kinematic waveforms of the evoked transport-to-mouth movements appeared normal, as did the ensuing oromanual events, which were replete with regrips. Across all trials (regardless of stimulation during holding or oromanual), there was an increase in fraction of time spent in oromanual mode and regrip frequency during stimulation (Figure 2C, Table S3). Other kinematic parameters were not affected (Figure S3A–D). Movements evoked by corticospinal stimulation after completion of food consumption or in anaesthetized mice did not resemble transport-to-mouth movements (Figure S3H).
Conversely, transient optogenetic silencing of forelimb M1 using surface laser stimulation of cortex in mice expressing channelrhodopsin2 (ChR2) in parvalbumin positive interneurons27 (PVxAi32; Table S1, STAR Methods) only modestly affected food-handling. During bilateral silencing of forelimb M1, mice were still able to handle and consume food, but regrip frequency was reduced in PVxAi32 but not wild type mice compared to one second before or after silencing (Figure 2D, Video S3, Table S3). Other kinematic parameters were not significantly affected (Figure S3E–H, Table S3).
Collectively, these analyses quantify the major kinematic features of oromanual events, and show that modulation of forelimb M1 activity can influence food-handling behavior, providing a basis for detailed analysis of related cortical activity.
Phasic-tonic oromanual-related activity in forelimb M1
To assess how forelimb M1 activity related to oromanual events, we aligned the kinematic and neural data to the transport-to-mouth, regrip, or lowering-from-mouth movements. In one example experiment (Figure 3A–F), many active units in forelimb M1 increased in firing as L decreased going into oromanual events and returned to baseline as L increased again going into holding. This pattern was consistent across mice (Figure 3G–I).
Figure 3: Phasic-tonic oromanual-related activity in forelimb M1.
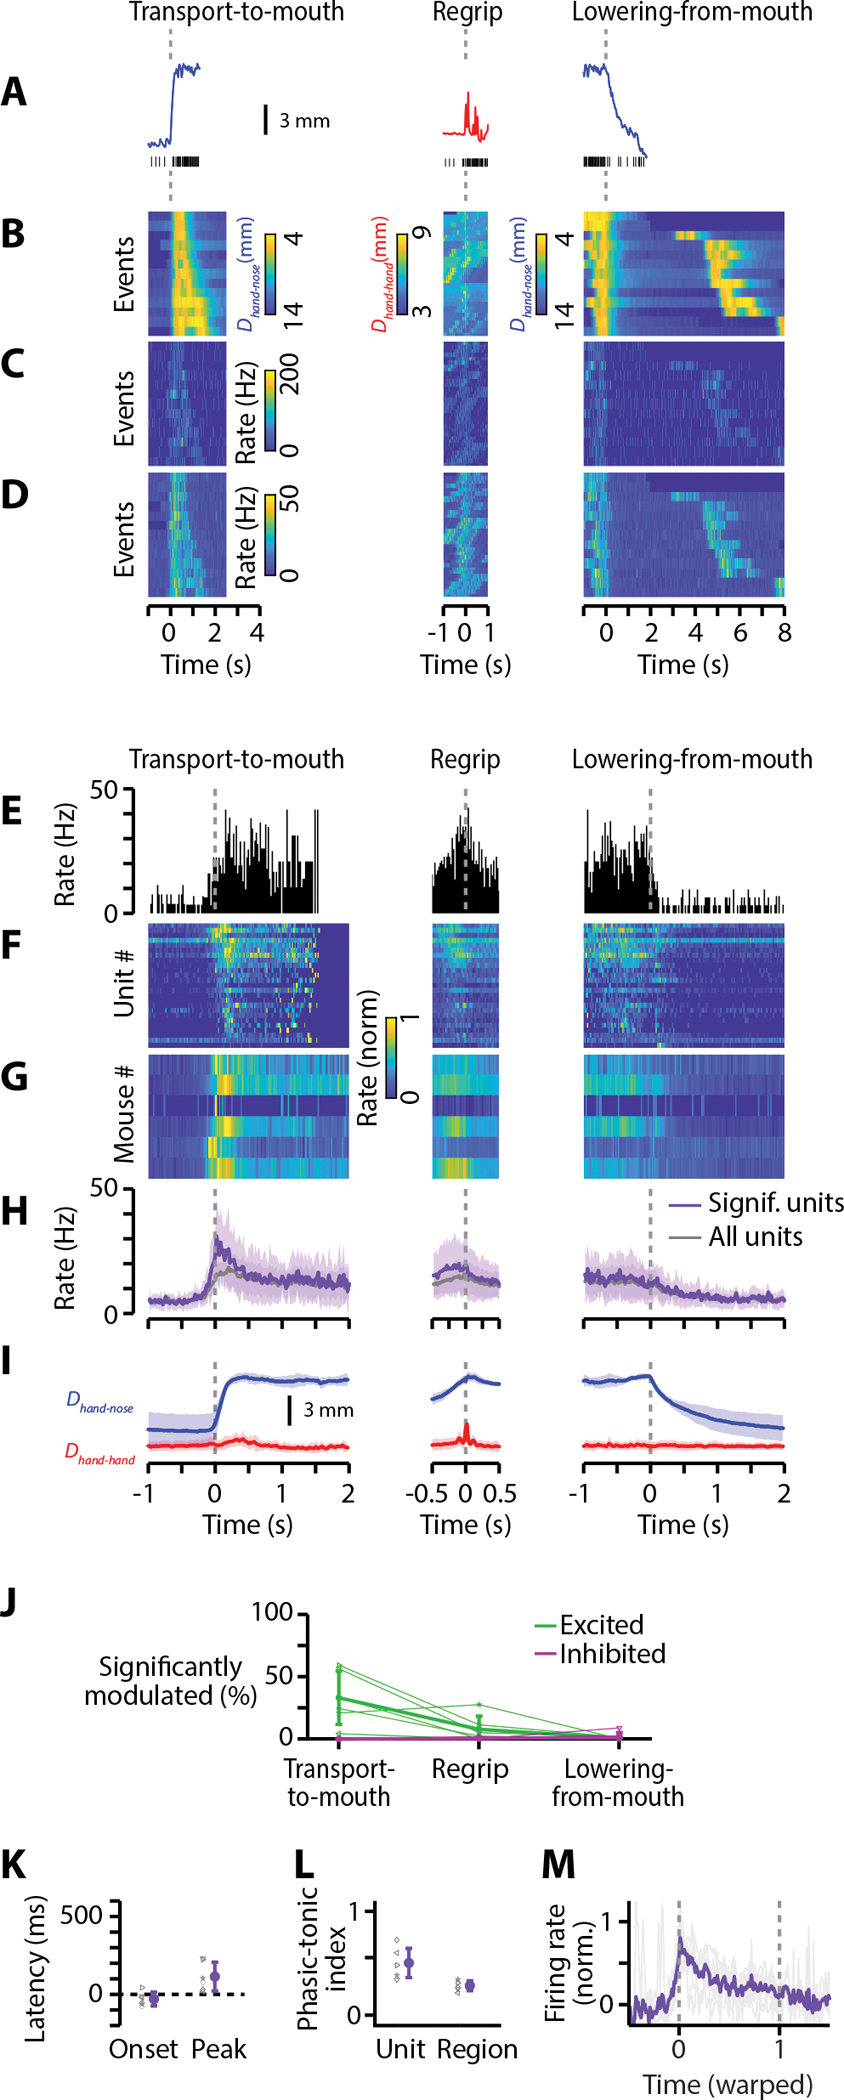
(A) Traces of Dhand-nose (blue, reverse y-axis) for an example transport-to-mouth movement (left), Dhand-hand (red) for an example regrip (middle), and Dhand-nose for an example lowering-from-mouth movement (right).
(B) Heatmap of all peri-oromanual event traces of kinematics for the same experiment as in (A). Left: Map of Dhand-nose (inverse color scale), aligned to the transport-to-mouth onset, sorted by oromanual event duration. Middle: Map of Dhand-hand, aligned to regrips, sorted by latency. Right: Map of Dhand-nose, aligned to lowering-from-mouth onset and sorted by holding interval duration. Subsequent oromanual events (as can be seen for shorter holding intervals) were excluded from analysis of holding-related activity. White arrows denote the corresponding events in (A).
(C) Same experiment as (B), showing the corresponding activity of an example forelimb M1 single unit.
(D) Same as (C) but showing the average firing rate of all active units recorded from forelimb M1 in the example experiment.
(E) Peri-event time histograms (PETHs) for the example single unit in (C). Note shortened time axis.
(F) Peak-normalized PETHs of all significantly modulated (see STAR Methods) active units recorded in the same experiment, plotted as a heatmap. White arrow denotes the example single unit in (C) and (E).
(G) Average peak-normalized event-aligned firing rates across significantly modulated forelimb M1 active units and across experiments for all mice with forelimb M1 recordings (n = 6).
(H) Mouse-average event-aligned firing rates (shaded region, mean ± s.d. over mice) for all units (grey) and only significantly modulated units (purple).
(I) Mouse-average event-aligned Dhand-nose (blue, reverse y axis) and Dhand-hand (red) traces.
(J) Percentages of forelimb M1 active units significantly excited (green) or inhibited (purple) for each event type. Thin lines are means over experiments for individual mice, error bars are mean ± s.d. over mice.
(K) Onset and peak latencies for active units in forelimb M1. Grey symbols are means, averaging first over simultaneously recorded units, and then over experiments for individual mice. Purple symbols and error bars are means ± s.d. over mice.
(L) Phasic-tonic indices (PTIs, see STAR Methods) for forelimb M1 active units (“Unit”) and average firing rate traces (“Region”). Grey symbols are means over experiments (after first averaging over simultaneously recorded units for Unit PTIs) for individual mice, purple symbols and error bars are mean ± s.d. over mice.
(M) Normalized average forelimb M1 firing rate traces after time-warping each oromanual event to have the same duration. Thin lines are means over experiments for each mouse and thick lines are mean over mice.
One third of active units in forelimb M1 were significantly excited (bootstrap test, false discovery rate corrected p-values < 0.05, 33 ± 21% of active units, mean ± s.d., n = 6 mice, Figure 3J, STAR Methods) around transport-to-mouth movements and none were significantly inhibited. Fewer active units were significantly modulated around regrips (8 ± 11% excited, 0.3 ± 0.7 % inhibited) and almost none around lowering-from-mouth movements (0.6 ± 0.9% excited, 1.5 ± 3.6 % inhibited; Figure 3J). Significantly excited active units increased firing 30 ± 44 ms before the transport-to-mouth movement and peaked 114 ± 93 ms after movement onset (Figure 3K). Because activity fell to lower levels after an early peak, we calculated a phasic-tonic index (PTI)28 for all significantly modulated active units as the ratio of (FRpeak − FRend)/(FRpeak + FRend); i.e., the difference between firing in a 200 ms window surrounding the peak to firing in a 200 ms window at the end of each oromanual event, divided by their sum. A PTI of 0 indicates perfectly tonic activity, whereas a PTI of 1 indicates perfectly phasic activity. Across mice, the average PTI was 0.50 ± 0.14 (Figure 3L), indicating a mostly phasic pattern.
Given the generally unidirectional modulation of active unit firing around oromanual events in forelimb M1, we next considered the probe-average firing rate; i.e., the average activity of all neurons simultaneously recorded on the same probe. This showed a similar pattern whether all units or only significantly modulated units were included (Figure 3G–H), in which activity peaked around the start of transport-to-mouth, then fell but remained elevated above baseline until the lowering-from-mouth. The PTI of probe-average activity was 0.28 ± 0.05 (Figure 3L), indicating that the firing of neurons clustered together in time to give a mixed phasic-tonic pattern to the probe-average activity. This pattern was also apparent when oromanual events and the associated probe-average activity traces were time-warped to equal durations (Figure 3M).
In summary, forelimb M1 firing increases during oromanual events, with the phasic-tonic profile suggesting that forelimb M1 is primarily concerned with the initial transport-to-mouth and early portion of oromanual events, but with some encoding of ongoing movements. The negative onset latencies suggest a predictive component to oromanual-related firing in forelimb M1.
Tonic activity in lateral M1 and an intermediate pattern in forelimb S1
Because oromanual movements also involve the mouth and jaw, we made additional recordings in an area located anterolateral to forelimb M1 (“lateral M1”), implicated in tongue, jaw, and hand-to-mouth movements22, 29, 30. Lateral M1 activity was higher during oromanual events compared to holding intervals (mean ± s.d.: holding 5.4 ± 4.1 Hz; oromanual 17.2 ± 9.4 Hz; paired t-test: t3 = 4.2, p = 0.03, n = 4 mice). Event alignment (Figure 4A–I) showed lateral M1 units were significantly modulated around transport-to-mouth movements (53 ± 27% excited, none inhibited) and regrips (16 ± 13% excited, 2.2 ± 3.3% inhibited), but rarely around lowering-from-mouth movements (excited: 1.3 ± 2.7%, inhibited: 8.4 ± 8.3%; Figure 4J). The onset latency of significantly excited units was 186 ± 168 ms after transport-to-mouth movement onset and their peak latency 460 ± 63 ms (Figure 4K). Lateral M1 units had a PTI of 0.23 ± 0.08 (Figure 4L). Contrasting with forelimb M1, probe-average firing activity in lateral M1 activity remained elevated over the course of oromanual events, only decaying to baseline levels with the return to holding posture (Figure 4G–H). This was reflected by a lower probe-average phasic-tonic index of 0.01 ± 0.07 (Figure 4L), which was not significantly different from zero (paired t-test: t3 = 0.3, p = 0.77), indicating tonic activity. A tonic pattern was also evident in the time-warped traces (Figure 4M).
Figure 4: Tonic oromanual-associated activity in lateral M1.
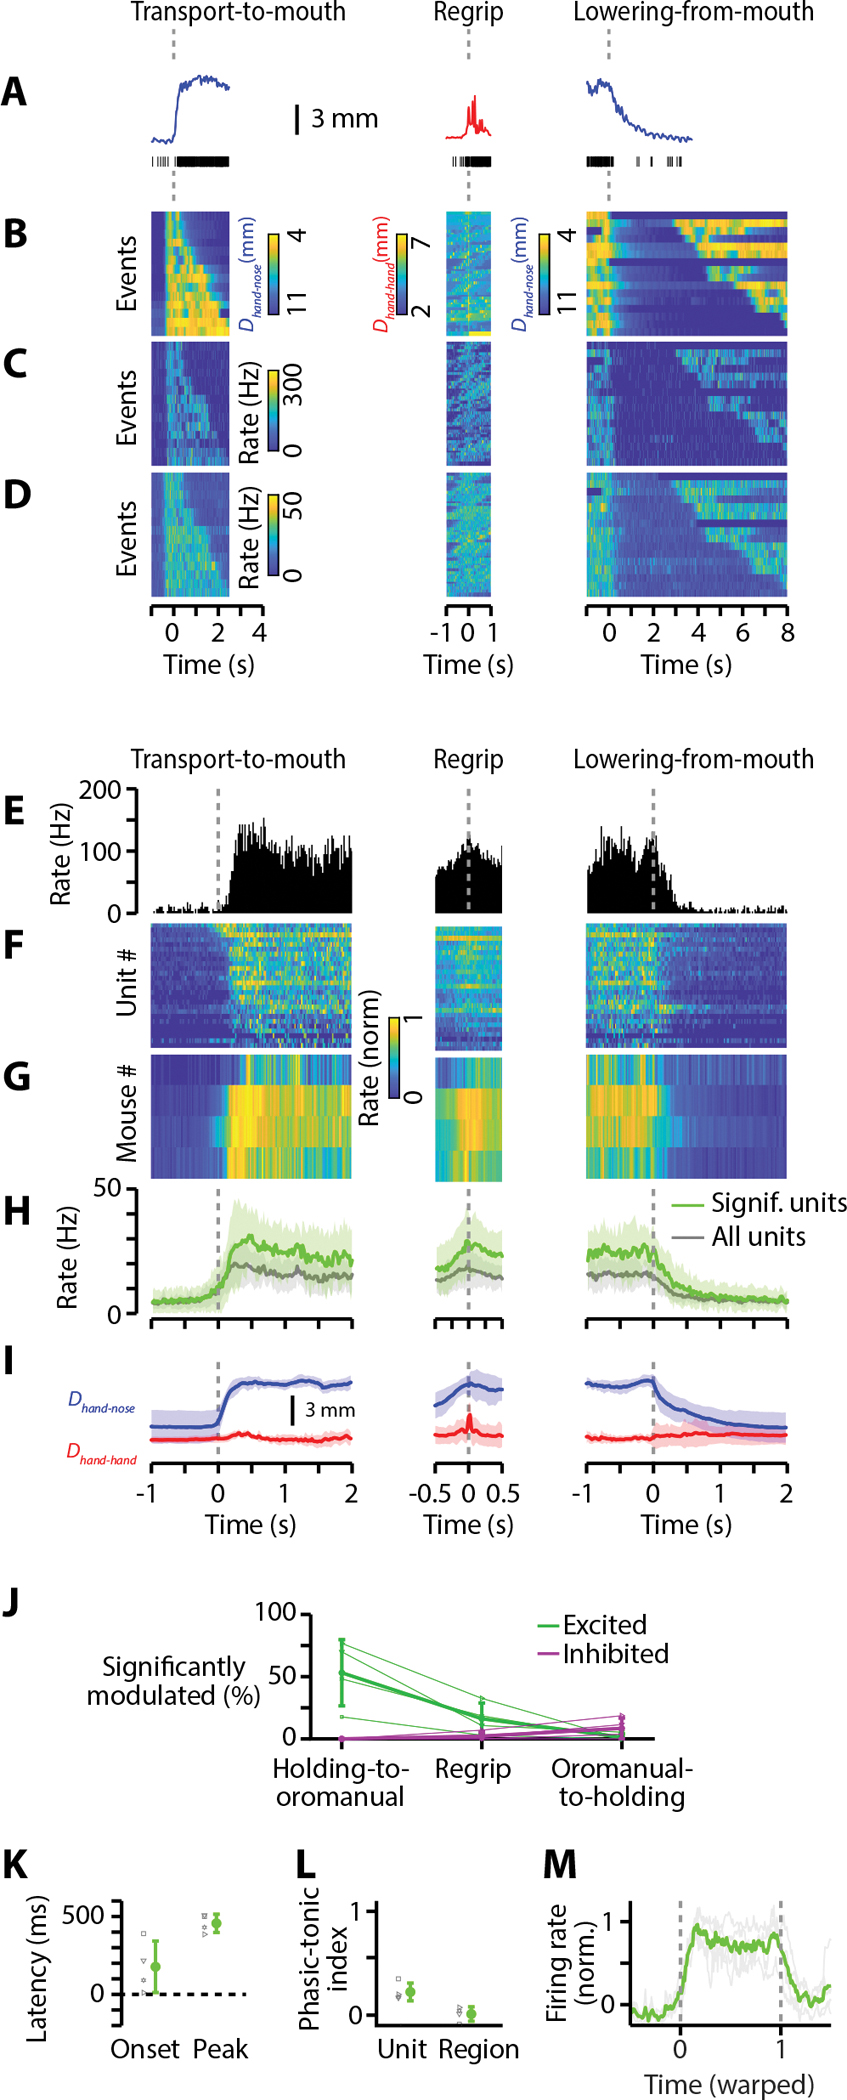
As Figure 3, but for all lateral M1 recordings (n = 4).
Because food-handling involves object manipulation and hence forelimb somatosensation, we also recorded from the forelimb region of primary somatosensory (S1) cortex, located laterally adjacent to forelimb M1 31. Forelimb S1 activity was higher during oromanual events compared to holding intervals (mean ± s.d.: holding 7.6 ± 3.5 Hz; oromanual 15.9 ± 6.7 Hz; paired t-test: t4 = 3.1, p = 0.04, n = 5 mice). Event alignment showed forelimb S1 active units were significantly modulated around transport-to-mouth movements (32 ± 27% excited, none inhibited) and regrips (14 ± 9% excited, 4 ± 9% inhibited), but not lowering-from-mouth movements (Figure 5J). The onset latency of significantly excited units was 56 ± 104 ms after transport-to-mouth movement onset and their peak latency was 294 ± 80 ms (Figure 5K). There was a significant effect of cortical area on onset (Kruskal-Wallis ANOVA: χ2 = 6.7, p = 0.04) and peak latency (χ2 = 10.5, p = 0.005), with lateral M1 having significantly longer latencies than forelimb M1 (post-hoc tests: onset p = 0.03, peak p = 0.004, Bonferroni corrected). Forelimb S1 units had a PTI of 0.31 ± 0.11 (Figure 5L). Probe-average forelimb S1 activity showed a phasic-tonic profile (Figure 5G–H), with a PTI of 0.22 ± 0.11 (Figure 5L). Two-way nonparametric ANOVA using permutation tests showed significant effects of cortical area (p = < 2 × 10⁻¹⁶) and calculation method (unit vs probe-average, p = 0.008) on PTI, but not their interaction (p = 0.90). Post-hoc tests showed that lateral unit PTI was significantly more tonic than forelimb M1 (p = 0.02) and lateral M1 probe-average PTI was significantly more tonic than forelimb M1 (p = 0.001) or S1 (p = 0.01). The temporal profile of the time-warped activity for forelimb S1 (Figure 5M) was intermediate between those of the other two regions.
Figure 5: Intermediate oromanual-associated activity in forelimb S1.
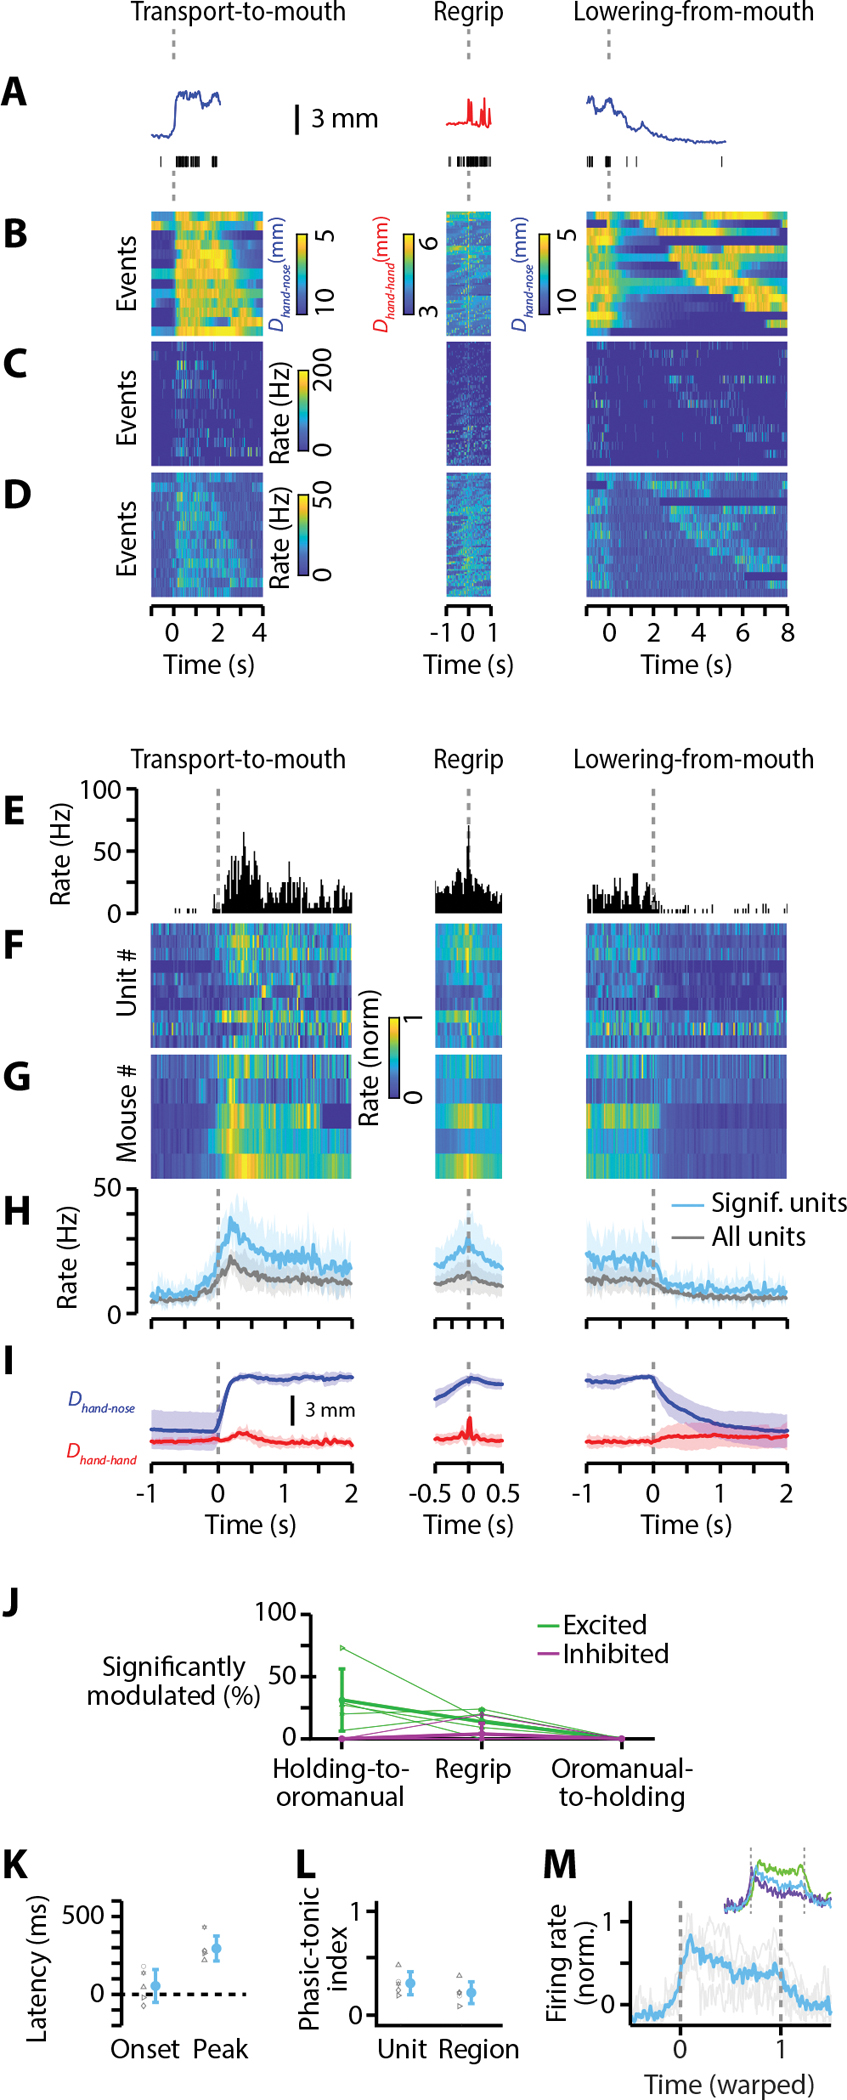
As Figure 3, but for all forelimb S1 recordings (n = 5). Inset in (M) shows mouse-average time-warped firing rate traces for all three regions on the same axis (purple, forelimb M1; green, lateral M1; teal, forelimb S1).
These results suggest that cortical activity during food-handling exhibits both area-common and area-specific patterns. Activity was strongly associated with oromanual events in all three areas, reaching higher peak levels in lateral M1 and forelimb S1 than in forelimb M1. Oromanual-related activity followed a phasic-tonic pattern in forelimb M1, tonic pattern in lateral M1, and an intermediate pattern in forelimb S1. Timing of the initial rise was similar in all three areas, peaking earliest in forelimb M1 and slightly later in lateral M1 and forelimb S1. In all three regions, this pattern was essentially the same when analysis was restricted only to single units (i.e., excluding multi-units, Figure S4).
Phasic and tonic activity classes within and across areas
Averaging activity across probe channels may obscure heterogeneity in the patterns of event-aligned activity exhibited by active units within a given area. To address this, we used non-negative matrix factorization (NNMF)32 to simultaneously perform dimensionality reduction and unsupervised clustering (STAR Methods).
Applying NNMF to pooled data from all three areas, with the number of clusters chosen automatically by bi-cross-validation, revealed two clusters of activity (Figure 6). One cluster was more phasic, peaking around transport-to-mouth movements, and the other more tonic, peaking around regrips and remaining elevated until the lowering-from-mouth movement. Within each cluster, active units showed mostly phasic activity peaking at various times in relation to the kinematics (Figure 6A–D), consistent with their high PTIs (Figure 3L, Figure 4L, Figure 5L). These clusters were differentially apportioned across cortical areas (Figure 6E), creating the distinct area-specific average activity patterns. Applying NNMF to data from each area individually also found two clusters in each area (Figure S5), which were qualitatively similar to the clusters found in the pooled data.
Figure 6: Phasic and tonic activity classes within and across areas.
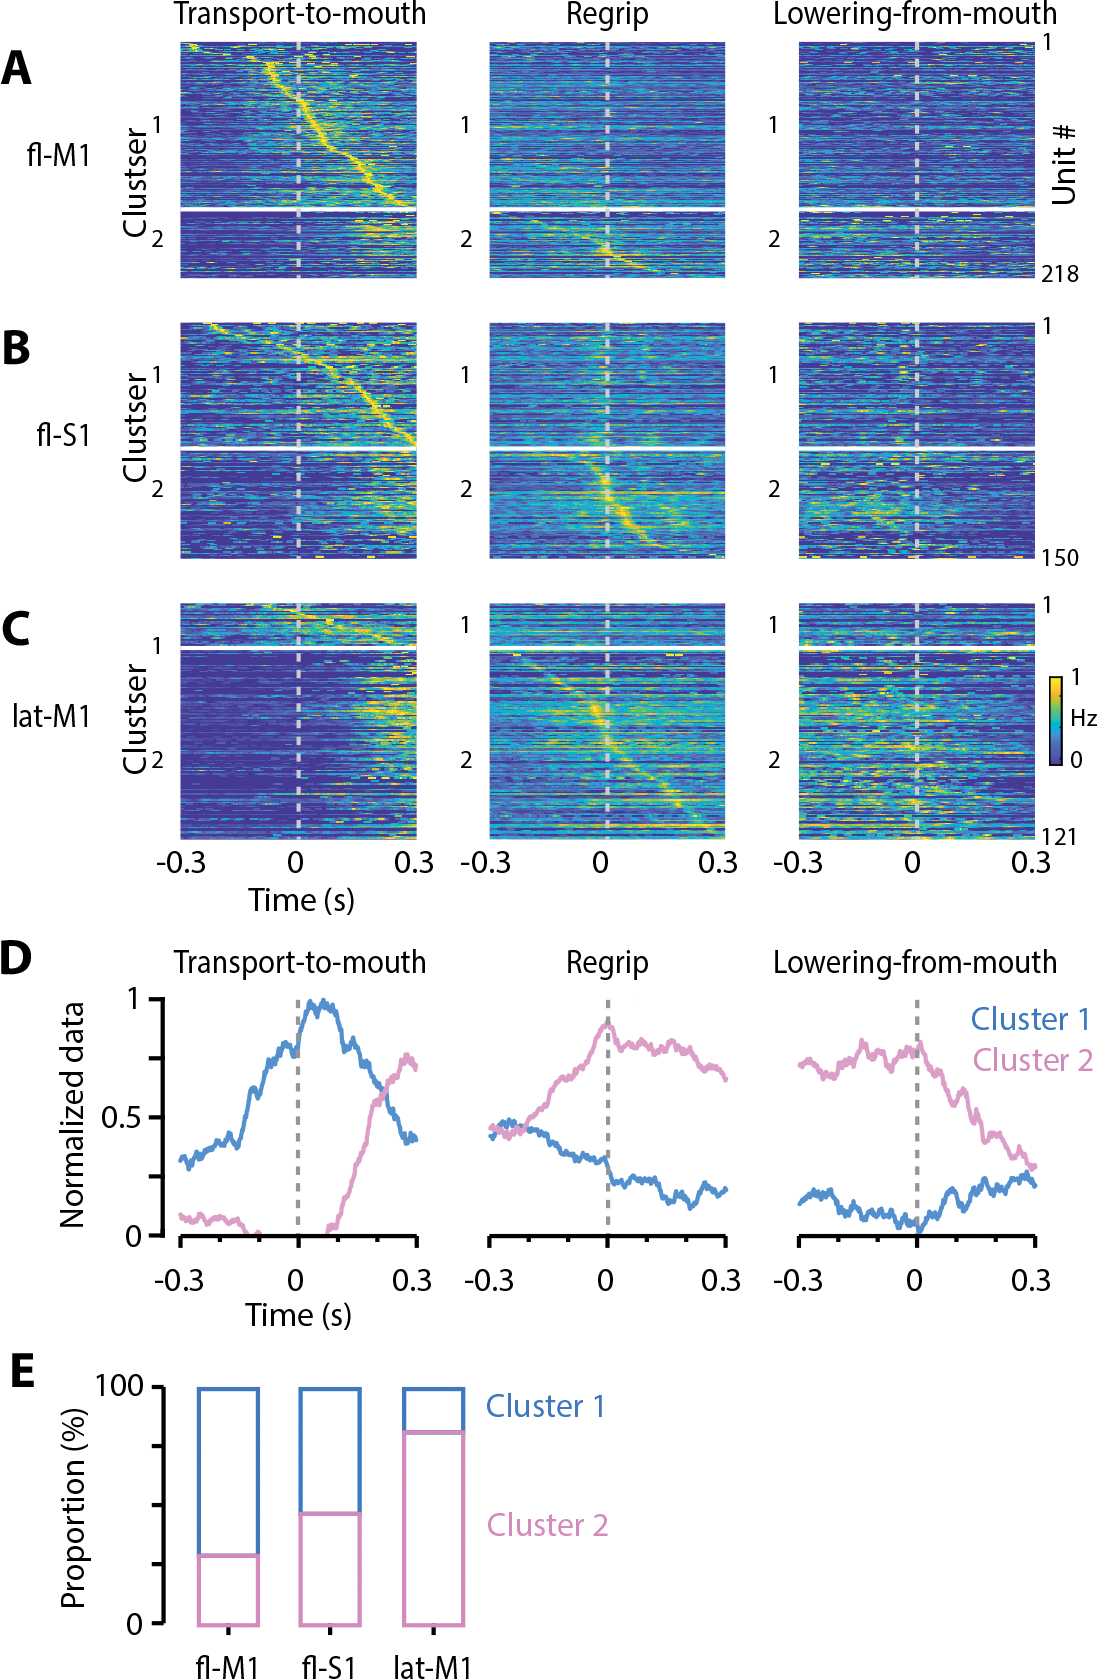
(A) Each row of the raster is the activity of a forelimb M1 active unit normalized to its maximum firing rate, aligned to transport-to-mouth (left), regrip (middle), and lowering-from-mouth (right) movements, and sorted by time of peak firing around transport-to-mouth movements for cluster 1 and regrips for cluster 2. Neurons were assigned to two clusters by applying NNMF to pooled data from all three areas.
(B, C) Same as (A), for forelimb S1 and lateral M1, respectively.
(D) NNMF factor weights for the two clusters.
(E) Proportions of cluster 1 and 2 units for each area.
Forelimb areas predict future hand position while lateral M1 encodes current hand position
The preceding analyses may be biased by the choice of kinematic features considered and events aligned to. As a complementary approach, we correlated cortical activity with the 3D positions of the hands using whole (not event-aligned) recordings, by fitting general linear models (GLMs) from sliding windows of binned neural activity to the kinematics (Figure 7), using ridge regularization and cross-validation to deal with overfitting and multicollinearity (STAR Methods). Initially, the decoding window was large, using both past and future spiking activity to predict kinematics.
Figure 7: Hand position during food handling can be accurately decoded from cortical spiking activity.
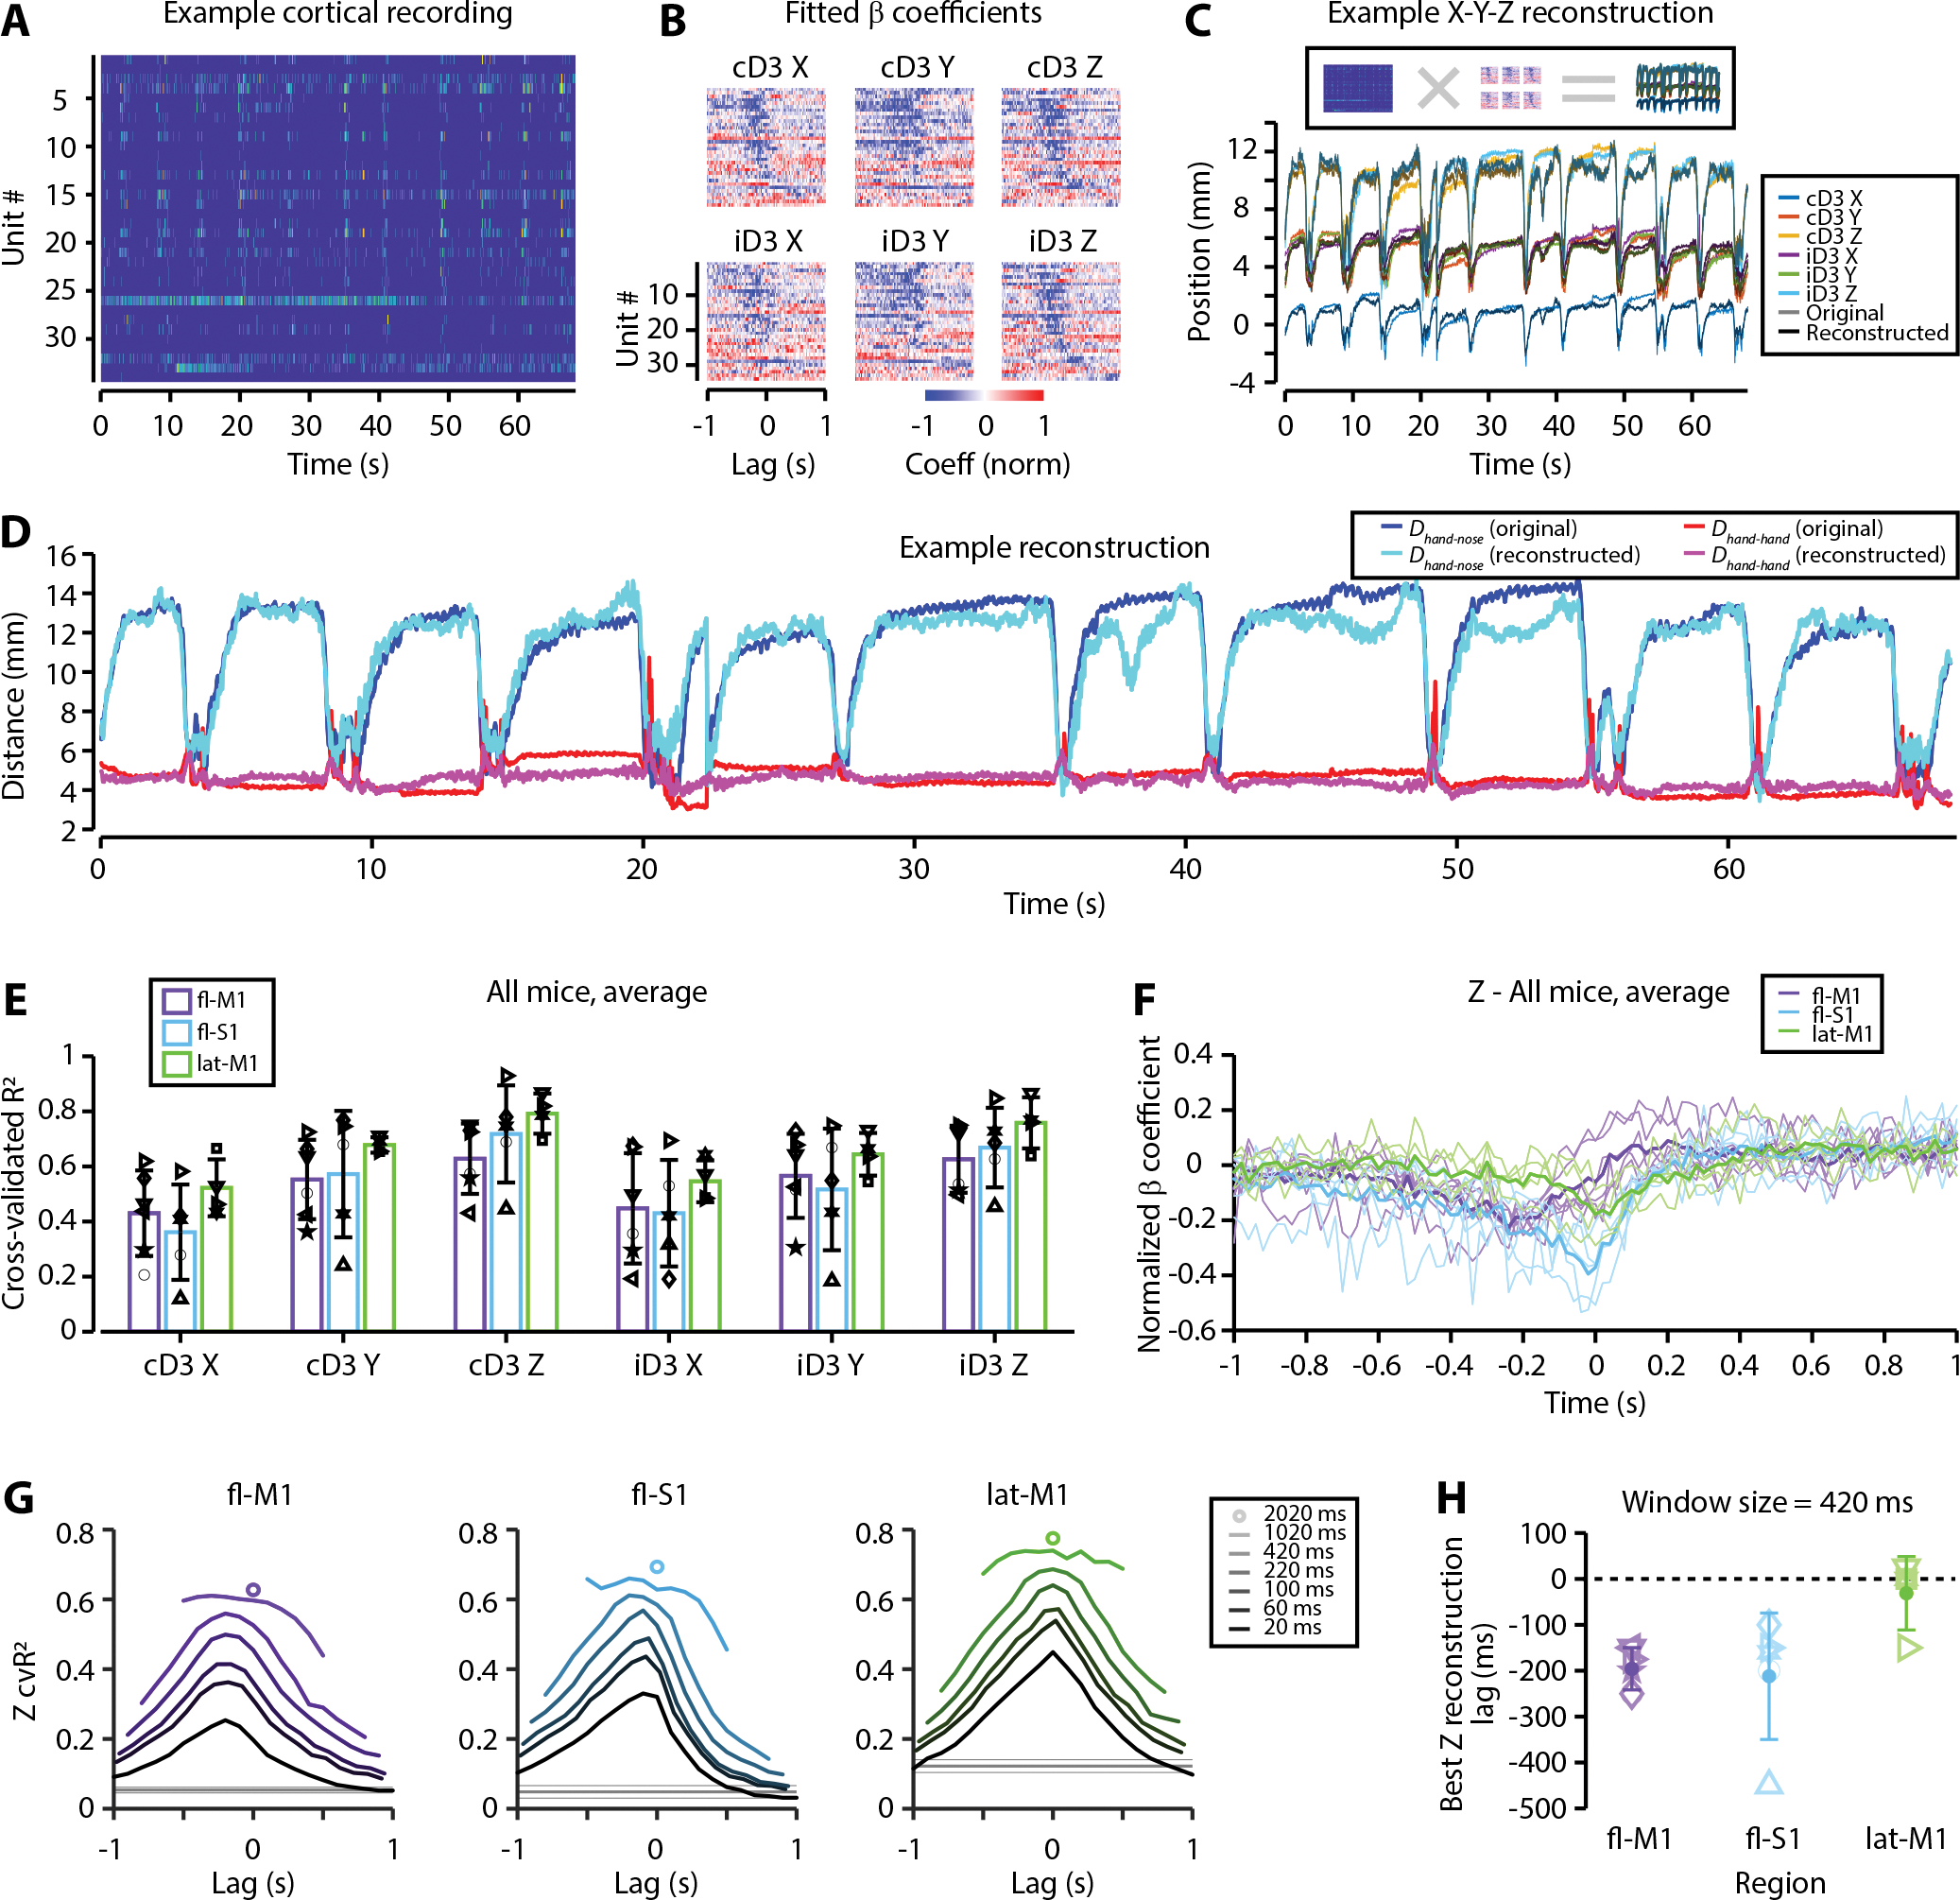
(A) Example raster showing all active units from a forelimb M1 recording.
(B) Fitted GLM coefficients for the X, Y, and Z coordinates of the contra- (c) and ipsilateral (i) third digits (D3) from the recording in (A), normalized to range [−1, 1], ordered by time-to-trough of the contralateral D3 Z coefficients.
(C) X, Y, and Z hand trajectories (lighter colors) for the same example recording shown in (A-B) and the corresponding reconstructed trajectories (darker colors).
(D) Dhand-nose (blue) and Dhand-hand (red) traces from the recording in (A-C) compared to L (cyan) and D (magenta) traces calculated from the reconstructed hand trajectories.
(E) Cross-validated reconstruction accuracy (cvR2) for each coordinate and region (purple: forelimb M1, teal: forelimb S1, green: lateral M1). Error bars are mean ± s.d over mice. Symbols are averages over experiments for individual mice.
(F) GLM coefficients normalized to the range [−1,1] for the Z-coordinate GLMs averaged over neurons, experiments, hands, and mice for forelimb M1 (purple), forelimb S1 (teal), and lateral M1 (green). Thin lines are individual mice, thick lines are mean over mice.
(G) Mouse-average cvR2 for the Z-coordinate (averaged over ipsi- and contralateral hands) when varying the size and central lag of the window used for reconstruction. Solid grey lines indicate reconstruction accuracy expected by chance, dashed lines are mean ± 2 s.d. over shuffles of the chance reconstruction accuracy.
(H) Lag giving the highest hand-average Z-coordinate cvR2 for the 420 ms window as a function of region. Symbols are averages over experiments for individual mice, error bars are mean ± s.d. over mice. See also Figure S6 and Table S1
In an example recording (Figure 7A–B), most active units showed a strong anticorrelation with kinematics at negative lags. The GLMs accurately reconstructed the 3D position of both hands in this recording (Figure 7C), and hence accurately reconstructed Dhand-nose (R2 = 88%) and Dhand-hand (R2 = 45%, Figure 7D). Across experiments, mice, and regions, reconstruction accuracy (cross-validated R2, cvR2) was high (Figure 7E), with a significant effect of dimension (X, Y, or Z, perpendicular to the sagittal, coronal, and horizontal planes, respectively) on reconstruction accuracy (mixed ANOVA, side and dimension as within-subjects factors, region as between-subjects factor, F2/24 = 46.9, p = 5.1 × 10⁻⁹), but not side (contra vs ipsi), region, or any of their interactions. The cvR2 was highest for Z and lowest for X (post-hoc tests, all p < 0.05, Bonferroni corrected).
Plotting the neuron-average GLM coefficients (Figure 7F) shows the temporal relationship between activity and reconstructed kinematics. Forelimb M1 showed maximum anticorrelation with Z at −200 ms lag, while forelimb S1 was increasingly anticorrelated at negative lags approaching zero, and lateral M1 had peak anticorrelation at zero lag. To further explore the temporal relationship, we varied the size and central lag of the fitting window (Figure 7G, Figure S7). The cvR2 increased monotonically with window size but even using a single bin was well above chance. cvR2 varied with the central lag of the reconstruction window. To summarize this relationship, we considered the lag with highest cvR2 for the 420 ms window (for longer windows the temporal relationship was less clear). For both forelimb M1 and S1, cvR2 peaked around 200 ms preceding kinematics, whereas lateral M1 peaked around zero lag (Figure 7H). There was a significant effect of cortical area on best reconstruction lag (Kruskal-Wallis ANOVA, χ2 = 6.8, p = 0.03), with forelimb M1 vs lateral M1 the only significant difference in follow-up tests (p = 0.04, Bonferroni corrected).
These results confirm that significant information about forelimb position is carried in cortical activity during food handling. In forelimb M1 and S1, this information is predictive, leading kinematics, whereas in lateral M1 there is a tight temporal correlation between firing activity and hand position. This corroborates the earlier findings, in particular the better cvR2 for Z accords with the significant modulation of all areas by transport-to-mouth movements, and the zero-lag peak for lateral M1 fits with its tonic activity profile.
DISCUSSION
We developed a method, based on combining kilohertz-rate videography and multi-channel electrophysiology, for investigating the cortical activity associated with food-handling, as a step towards understanding the neurobiology of this ethologically critical behavior. This approach revealed that (i) forelimb M1 activity is modulated during active manipulation events; (ii) manipulating forelimb M1 activity can influence the temporal structure of food-handling submovements but not their kinematics; (iii) food-handling associated activity is present in other cortical areas, with both area-common and area-specific features; (iv) these area-specific profiles arise from differing proportions of shared activity classes; (v) hand position can be decoded from forelimb and orofacial areas of cortex. Collectively our results provide a detailed characterization of multi-areal cortical activity associated with this form of manual dexterity in a food-handling mammal.
Natural behaviors are important to understanding the motor system, but pose challenges as well as opportunities due to their variability and complexity5–8. Food-handling offers several advantages as a model for a natural form of manual dexterity. For one, we found that two parameters (hand-nose and hand-hand distances) can capture the majority of the kinematic variance. For another, this enabled submovement-aligned analysis, effectively ‘trializing’ the behavior. As such, food-handling represents a bridge between fully unstructured behavior and highly simplified, unimanual tasks. Nevertheless, there may be additional rich structure in the remaining variance not captured by L and D, which newer unsupervised methods33–37 might reveal.
Focusing on forelimb M1, we explored how cortical activity modulations affect food-handling. Activation of corticospinal neurons during holding intervals induced an oromanual event, with a concomitant increase in regrip frequency. Conversely, silencing forelimb M1 did not abolish food-handling, but did reduce regrips. Thus, these effects were symmetric, but only partially so. Asymmetric effects of bidirectional optogenetic manipulations have previously been noted38 and may arise from the complex underlying circuits in which the manipulated neurons are embedded. Furthermore, a prior study similarly noted that unilateral motor cortex silencing did not interfere with food-handling movements following reach-to-grasp14. Thus, our results suggest forelimb M1 can drive food-handling behavior but does not directly specify kinematics. However, our data, based on kinematic measures, still allow both for a potential role of M1 in driving kinetic aspects (e.g. isometric forces, co-contractions), and for the possibility that some dimensions of the activity relate to motor planning and other aspects of the behavior not directly coupled to muscle output39. As forelimb motor control functions are distributed across multiple motor and somatosensory areas40, incomplete abolishment of food-handling by M1 silencing could reflect redundancy of function across the circuits supporting this behavior. This redundancy would be highly adaptive for such a fundamental behavior, and has been seen in other motor behaviors41, 42. Consistent with this, the latencies of stimulation-evoked movements suggest that they occur via downstream circuits rather than direct spinal drive alone. The precise circuits responsible remain an open question, but could involve corticospinal branches to downstream targets such as striatum, midbrain, brainstem, cerebellum24, 43, 44, or upstream thalamocortical circuits, which carry movement initiation signals45, 46 and monosynaptically excite corticospinal neurons47.
A striking feature of food-handling activity in forelimb M1 was its unidirectional modulation, with many active units increasing firing during oromanual and very few decreasing, in contrast to previous studies showing complex, bidirectional activity changes in relation to movement; e.g.23–26. This may reflect switching in and out of a state (i.e., holding mode) where movements (e.g. chewing) are largely driven by subcortical pattern generator circuits. Although largely unidirectional, there was temporal heterogeneity in the responses, as evidenced by disparity in PTI between unit and probe-average responses and the presence of two NNMF clusters revealed two patterns corresponding to “phasic” and “tonic” activity classes.
In addition to forelimb M1, we recorded in two other cortical regions, lateral M1 and forelimb S1. All three areas showed strongly manipulation-related activity, but with distinct temporal properties. Activity in all three areas was composed of the same phasic and tonic activity classes, but in different proportions. In forelimb M1, activity preceded kinematics, peaking around transport-to-mouth movement initiation, and as shown by GLM analysis was predictive of future movements. Consistent with prior reports48, 49, ipsi- and contralateral movements were equally well encoded. In lateral M1, activity was delayed and tonic compared to forelimb M1 and closely correlated with the current, rather than future, hand position. This area has been implicated in both forelimb and orofacial movements22, 29, 30, 50, 51. Some of this correlation may be driven by unobserved orofacial movements during oromanual events, as our approach does not fully disambiguate limb movement-related activity from activity relating to temporally coincident jaw movements. Combined with the lack of activity in lateral M1 during holding intervals, when chewing movements occur, this suggests that this region is neither a pure forelimb nor a pure orofacial area, but one that has mixed functionality and – at least during food-handling – is mainly concerned with concurrent, coordinated movements of the hands and mouth during active manipulation. This is consistent with prior mapping studies that have ascribed hand-to-mouth movements to this cortical region21, 22, 52. In forelimb S1, activity was quantitatively intermediate between forelimb M1 and lateral M1. While much of this activity may arise from tactile and proprioceptive input from the forelimbs, a component may also include feed-forward input from forelimb M153.
In summary, our findings advance knowledge about the temporal profile, spatial distribution, and underlying unit composition of food-handling related cortical activity. The methodological approaches developed establish a basis for further investigation of this kinematically rich, ethologically critical, natural form of manual dexterity.
STAR METHODS
RESOURCE AVAILABLILITY
Lead contact
Requests for further information and resources should be directed to the lead contact, John M. Barrett (john.barrett@cantab.net)
Materials availability
This study did not generate new unique materials.
Data and code availability
Kinematic, ethogram, and electrophysiological data have been deposited at Zenodo and will be publicly available as of the date of publication. DOIs are listed in the key resources table.
All original code has been deposited at Zenodo and will be publicly available as of the date of publication. DOIs are listed in the key resources table.
Any additional information required to reanalyze the data reported in this paper is available from the lead contact upon request.
Key resources table.
| REAGENT or RESOURCE | SOURCE | IDENTIFIER |
|---|---|---|
| Bacterial and virus strains | ||
| pAAV-Syn-ChR2(H134R)-GFP | Boyden et al Nat Neurosci. 2005 Sep. 8(9):1263–8. | Addgene 58880-AAVrg |
| pAAV-CAG-GFP | Edward Boyden Lab | Addgene 37825-AAVrg |
| Deposited data | ||
| Tracking, spiking, and ethogram data | This paper | 10.5281/zenodo.7083395 |
| Experimental models: Organisms/strains | ||
| Mouse: C57BL/6J | The Jackson Laboratory | RRID: IMSR_JAX:000664 |
| Mouse: B6.Cg-Gt(ROSA)26Sortm32(CAG-COP4*H134R/EYFP)Hze/J | The Jackson Laboratory | RRID: IMSR_JAX:024109 |
| Mouse: B6.129P2-Pvalbtm1(cre)Arbr/J | The Jackson Laboratory | RRID: IMSR_JAX: 017320 |
| Software and algorithms | ||
| Matlab | The MathWorks | RRID:SCR_001622 |
| Kilosort2 | https://github.com/MouseLand/Kilosort | RRID:SCR_016422 |
| RHD USB Interface Board Software | http://intantech.com/downloads.html?tabSelect=Software | RRID:SCR_019278 |
| DeepLabCut | Mathis et al., 2018 | https://github.com/DeepLabCut/DeepLabCut |
| Anipose | Karashchuk et al., 2021 | https://anipose.readthedocs.io/en/latest/ |
| Wavesurfer v0.945 | https://wavesurfer.janelia.org/ | https://wavesurfer.janelia.org/ |
| Matlab and R analysis code | This paper | http://dx.doi.org/10.5281/zenodo.6588397 |
EXPERIMENTAL MODEL AND SUBJECT DETAILS
This study used experimentally naïve mice on a C57BL/6 background (stock no. 000664, The Jackson Laboratory, Bar Harbor, Maine) aged 110–284 days postnatal and weighing 17.4–24.6 g at the time of recording (19.5–28.1 g before food restriction, Table S1). We did not select mice on the basis of age or weight, as we previously found these to have no systematic effects on food-handling kinematics 10. For optogenetic silencing experiments, PVxAi32 mice were generated by crossing homozygous B6.Cg-Gt(ROSA)26Sortm32(CAG-COP4*H134R/EYFP)Hze/J cre-dependent channelrhodospin2 (ChR2) reporter mice (stock no. 024109, The Jackson Laboratory) 54 with homozygous B6.129P2-Pvalbtm1(cre)Arbr/J mice (stock no. 017320, The Jackson Laboratory) 55 that express cre in parvalbumin (PV) expressing cells. PVxAi32 mice thus express ChR2 in all PV-positive cells, including PV-positive interneurons in cortex, and so can be used for local silencing of cortex 27. Mice of both sexes were used, consistent with NIH policy on sex as a biological variable in basic research. Mice were bred in-house, housed in groups with a 12 hour reverse light/dark cycle, and had free access to food and water prior to food restriction (see below). All experiments were conducted during the dark phase of the mice’s light cycle. Mice were used as they became available. As many brain regions as possible (of the total of six bilateral representations of the three areas of interest) were recorded from each mouse, hence no randomization to cohorts was necessary. All studies of mice were approved by the Northwestern University IACUC and fully complied with the animal welfare guidelines of the National Institutes of Health and Society for Neuroscience.
METHOD DETAILS
Surgical procedures
Head-bar mounting.
Under deep isoflurane anesthesia, mice were placed in a stereotaxic frame (Model 900, David Kopf Instruments, Tujunga, CA) and a ~1 cm2 circular incision was made to expose the cranium. The periosteum was removed and a titanium head-fixation bar (0.875 × 0.187 inches, cut by water-jet from 0.08 inch Ti-6Al-4V sheet, Big Blue Saw, Atlanta, GA) was placed on top of lambda, perpendicular to the central suture, and affixed using dental cement (C&B Metabond, Parkell, Edgewood, NY). The incision was then sutured to close the wound margins and cover any exposed cranium not covered by dental cement and/or the head-bar. Mice were given 0.3 mg/kg buprenorphine preoperatively and 1.5 mg/kg meloxicam postoperatively as analgesia, followed by a second dose of meloxicam 24 hours after surgery. Mice were single-housed following head-bar mounting.
Retrograde labeling of corticospinal neurons.
For optogenetic stimulation of corticospinal neurons, pAAVretro-syn-ChR2(H134R)-GFP (#58880-AAVrg, Addgene, Watertown, MA) 56 was injected into the spinal cord as previously described 31 at the same time as head-bar mounting. Laminectomies were performed at cervical level 6. Injection pipettes were fabricated from glass capillary micropipettes (Wiretrol II, Drummond Scientific Company, Broomall, PA) using a pipette puller (PP-830, Narishige, Tokyo, Japan) and beveled to a sharp edge with a microgrinder (EG-400, Narishige). Pipettes were back-filled with mineral oil, tip-filled with virus, and advanced to the spinal cord using a 3-axis digital manipulator (51906, Stoelting, Wood Dale, IL). The dura was punctured and virus injected at 10 nL/min 0.4 mm lateral to midline at depths of 0.6 and 0.4 mm using a one-axis oil hydraulic micromanipulator (MO-10, Narishige) to a total volume of 80 nL. To control for non-specific laser effects, one mouse in which ChR2 expression failed (no GFP fluorescence was observed in postmortem brain slices) and three mice that were injected with pAAVretro-CAG-GFP (#37825-AAVrg, Addgene) instead of pAAVretro-syn-ChR2(H134R)-GFP were used as controls.
Craniotomies for linear arrays.
One day prior to recording, mice were deeply anaesthetized with a cocktail of 80–100 mg/kg ketamine and 5–15 mg/kg xylazine injected intraperitoneally. A craniotomy or craniotomies were opened over the area(s) to be recorded using a dental drill (EXL-M40, Osada, Los Angeles, CA). The cortical surface was covered with Kwik-Sil (World Precision Instruments, Sarasota, FL) and mice were allowed to recover.
Behavioral training
At least 3 days post-surgery, mice were food restricted to motivate feeding behavior. Mice were fed a measured amount of standard rodent diet each day to maintain their weight between 85 and 90% of pre-restriction body weight. At the time of recording mouse weights were 85.1–91.5% of initial body weight. Mice were monitored throughout the food restriction period for signs of ill-health 57, and body condition scores 58 were taken each day. No signs of ill-health were observed and no mouse fell below a body condition score of 3 throughout the study.
The experimental apparatus comprised a raised platform on which a 3D-printed hut was placed for the mouse to sit in, head-bar holders with screw clamps, and a pellet dispensing tube. The hut was designed to have an arched profile to facilitate the hunched posture typically adopted by mice while eating by providing more room for the back to arch, while also being easy to 3D-print. It also incorporated an arm bar for the mice to rest their hands on when not eating. The height of the platform was adjustable to enable a comfortable posture for each mouse. Accordingly, the position of the arm bar below the head varied from mouse to mouse and in some cases during holding intervals (particularly those of long duration) mice would rest the forearms on the arm bar. Mice generally did not use the arm bar for support during bimanual oromanual events, however.
Starting 1 to 3 days after beginning food restriction, mice were familiarized with the experimenter and head-fixation apparatus following standard procedures 57. Briefly, for the first week mice were first acclimatized to handling by the experimenter, then introduced to the experimental apparatus. Food rewards (20 mg dustless precision grain pellets, Bio-Serv, Flemington, NJ) were presented to the mice from the dispensing tube. Once mice consistently ate from the tube, they were introduced first to gentle head-fixation by hand, then to full head-fixation. Acclimatization to head-fixation then took another 1–2 weeks and primarily involved mice learning to be calm and achieve a comfortable bipedal posture in the head-fixation apparatus and retrieve pellets from the dispenser. Little to no habituation was required for head-fixed food-handling per se, as once mice were able to successfully retrieve food morsels into both hands, typical food-handling behavior appeared immediately. Video and electrophysiological recordings were taken four to six weeks after beginning food restriction, with the extra habituation time used to acclimatize the mice to progressively longer durations of head-fixation. For experimental recordings, the head-fixed mice were given black oil sunflower seeds (shells removed) or large grain pellets (45 mg, Bio-Serv), presented by spoon, as these larger food items facilitated longer duration videos.
Videography and kinematic analysis
Videos were obtained with a high-speed CMOS-based monochrome video camera (Phantom VEO 710L, Vision Research, Wayne, NJ). Videos were acquired at 1000 frames per second (fps), 999.6 μs exposure time, and 1024 × 512 pixel field of view. Two oblique views of the mouse were obtained by mounting two 50 × 50 mm flat enhanced aluminum surface mirrors (#43–876, Edmund Optics, Barrington, NJ) and a 50 mm anti-reflection coated equilateral prism (#49–435, Edmund Optics) in the camera optical path. A prime lens (Nikon AF Micro-NIKKOR 60mm f/2.8D, Nikon, Tokyo, Japan) was mounted on the camera body. The mouse was illuminated from both sides and slightly below using two red LEDs (M660L1 and MLEDC25, ThorLabs, Newton, NJ). Camera and video recording settings were controlled with Phantom Camera Control Application v3.5 (PCC, Vision Research). Video was recorded to the camera memory and then saved to disk as uncompressed Phantom Cine files, later converted to H.264-encoded MP4 files. Video recording was manually triggered by a TTL pulse delivered from an NI USB-6229 data acquisition board (National Instruments, Austin, TX) once the mouse had successfully retrieved a morsel in both hands and/or the mouth and begun eating. No pre-trigger buffer was used, so the initial retrieval of the food was not captured. Video recording was manually stopped using the PCC software once the current morsel was fully consumed. This was done in order to minimize the amount of non-food-handling behavior captured, due to the large file sizes of the videos.
Videos were cropped to isolate each view using ffmpeg (ffmpeg.org) and then markerless tracking of the nose and second through fourth digits (D2–4) on each hand was performed using DeepLabCut 59 as described 10. From these two sets of 2D trajectories for each body part, 3D trajectories were reconstructed using Anipose 60. Anipose’s camera model was calibrated for each experimental session using videos of a ChAruCo board at various angles captured at the end of the session without adjusting the lens settings. To reduce the dimensionality of the kinematic dataset, we calculated Dhand-hand as the 3D Euclidean distance between the third digits (D3) of each hand and Dhand-nose as the distance between the mid-point of the two D3s and the nose. To calculate the fraction of kinematic variance accounted for by Dhand-nose and Dhand-hand, we fit a linear model from Dhand-nose and Dhand-hand to the full 21 dimensional (X, Y, and Z coordinates for 3 digits on each hand plus the nose) dataset for each experiment, calculated the R2 of the model, then averaged over experiments for individual mice before averaging over mice.
Ethogramming
Using the DeepLabCut-extracted and Anipose-reconstructed trajectories, each video was temporally parsed into holding, oromanual, and other postural modes based on the distance between the third digit (D3) of each hand and the nose. Any non-food-handling behaviors (primarily postural adjustments) that were inadvertently captured were excluded from analysis. Ethogramming was performed using a two-step procedure. In brief, videos were first roughly segmented using manually determined thresholds; then, this rough ethogram was refined by fitting template functions to transitions between holding and oromanual events, from which the timing of each event was more precisely determined. The initial, threshold-based timings played no further role in analysis (e.g. for aligning neural activity). More specifically, two thresholds were set for each hand, one dividing the oromanual events from holding intervals, and one dividing holding intervals from non-food-handling related behavior (e.g. resting the hand on the arm bar). Video frames were assigned to holding intervals when both hands were in holding and to oromanual events when both were in oromanual. In the case of a slight delay in one hand crossing the oromanual threshold relative to the other, the threshold crossing time was set to the mean of the threshold crossing times for the two hands. Brief mode transitions due to fluctuations about the threshold were removed. Thresholds for each hand and minimum mode duration for inclusion were set manually per video based on visual inspection of the hand-nose distance traces and resulting ethogram. Periods of unimanual behavior (one hand in holding/oromanual and the other at rest) were uncommon and excluded from analysis, as were periods where both hands were at rest or where the tracking was poor (usually during postural adjustments).
Having constructed a rough three-mode ethogram (oromanual/holding/other) based on threshold crossings, we then calculated the hand-hand distance Dhand-hand as the distance between the D3s of each hand and the bimanual hand-nose distance Dhand-nose as the distance between the nose and the midpoint of both D3s. The latter was used to more precisely determine the timing of each transition movement (transport-to-mouth and lowering-from-mouth) by fitting model functions to the corresponding Dhand-nose trace. For each threshold crossing, the segment of the Dhand-nose trace from halfway to the previous threshold crossing to halfway to the next crossing was taken for fitting. Model functions were chosen to approximate the characteristic shape of each movement. Transport-to-mouth movements appeared roughly sigmoidal and so were fit with an inverted Gaussian cumulative distribution function:
| (1) |
Transitions into the holding mode appeared to decay exponentially, so were fit with:
| (2) |
where H(x) is the Heaviside step function. In both cases, the parameters fit for each movement were the scale b, the offset a, the location μ, and the rate σ. Both models generally gave a good fit to the data (lowering-from-mouth: R2 = 96.0 ± 2.5%, median ± m.a.d., n = 192 movements from all videos; transport-to-mouth: R2 = 95.7 ± 3.0%, median ± m.a.d., n = 176 movements). For transport-to-mouth movements, the start and end of the movement were defined as the 80% confidence interval of the Gaussian fit (i.e., from 10% to 90% of the movement height below the baseline) and the amplitude was taken as the difference in the values of Dhand-nose at the edges of the 98% confidence interval. For lowering-from-mouth movements, the start was defined as μ, the end as the time of 99% decay, and the amplitude was the difference in the values Dhand-nose at those times. Mode durations were calculated from the time of the start of the movement transitioning into the mode to the time of the movement transitioning out. A new ethogram was constructed for each video using the start times extracted from the fitted models and this ethogram was used in all subsequent analyses.
Regrips were detected using the findpeaks function in the Matlab Signal Processing Toolbox as peaks in Dhand-hand with minimum prominence of 2 mm and a slope that exceeded 88 mm·s−1 in either direction 10. The regrip peak height was defined as the difference between the value of Dhand-hand at the peak and the mean value during the pre- and post-regrip baselines, which were taken from 300 ms to 100 ms before and 100 ms to 300 ms after the regrip. The full-width at half maximum was defined as the width of the peak at halfway between baseline and the peak value. First regrip latency was defined as the time of the first regrip in a given oromanual event less the end time of the transport-to-mouth movement into said oromanual event. Peak parameters were extracted for individual regrips, before averaging first within and then across mice.
Electrophysiological recordings and analysis
The linear arrays used were 32-channel silicon probes with ~1 MΩ impedance and 50-μm spacing (model A1×32–15mm-50–177-A32, NeuroNexus, Ann Arbor, MI), in linear configuration. Each probe was mounted on a linear translator (MTSA1, ThorLabs) that was in turn mounted on a 3-axis manipulator (MP285, Sutter, Novato, CA). Probes were positioned at the recording sites stereotactically based on the stereoscopically visualized location of bregma using the three axes of the Sutter manipulator, then slowly inserted into the cortex using the linear translator at a rate of 2 μm/s (controlled by software) to a nominal depth of 1,600 μm from the pia. Target coordinates for the three regions were as follows. Forelimb M1: 0.3 mm anterior-posterior (AP), 1.5 mm medial-lateral (ML); lateral M1: 1.8 AP, 2.5 ML 30; forelimb S1: 0.0 mm AP, 2.4 ML 31. For lateral recording sites (forelimb S1 and lateral M1), the probes were tilted by ~30° off the vertical axis for alignment with the radial axis of the cortex. For forelimb M1, the probes were inserted perpendicularly to the horizontal plane (for unilateral recordings) or ~15° off the vertical (for bilateral recordings, to avoid headstage collision). At the end of each experiment, the probes were removed, the craniotomy re-sealed with Kwik-Sil, and the mouse returned to its home cage.
Signals were amplified using RHD2132 headstages (Intan Technologies, Los Angeles, CA) and acquired at 30 kHz using an RHD2000 USB Interface Evaluation Board (Intan). Data was recorded using the Intan experimental interface evaluation software, triggered by the same trigger used to control video recording. To synchronize videos to electrophysiological recordings, the frame sync signal from the camera was recorded as a digital input to the RHD2000. RHD files recorded by the Intan software were converted to raw format using Matlab (The MathWorks, Natick, MA), from which spikes were detected and sorted using Kilosort 61, 62. Results from Kilosort were manually verified using phy (https://github.com/cortex-lab/phy) as follows. Units with waveforms spanning more than 3 adjacent channels or with atypical waveform shapes were rejected as artifactual. Units displaying a clear refractory period (<1% of spikes within 1 ms) were classified as single units. All other units were classified as multiunits. Multiunits on the same channel with similar waveform shapes were merged. Single units were merged only if they were on the same channel, displayed similar shapes, and had no spikes in +/− 1 ms in their crosscorrelogram 63. Single units and multiunits (“active units”) were included in all analyses presented. Only data from probe recordings from which at least 10 active units could be isolated were included.
Optogenetics
The laser-scanning photostimulation apparatus used for optogenetic silencing and stimulation experiments has been described in detail elsewhere 64, 65. Briefly, 473 nm wavelength light from a blue laser source (LY473III-100, Aimlaser, Xi’an, China) was directed through an acousto-optic modulator (AOM; MTS110-A3-VIS, AA Opto-Electronic, Orsay, France) and an iris (SM1D12D, ThorLabs) before being deflected by a pair of galvanometer scan mirrors (GVSM002, ThorLabs) and focused onto the cortical surface by a plano-convex spherical lens (LA1484-A, ThorLabs).
Laser power and location were controlled by sending voltage commands to the AOM and scan mirrors, respectively, from a NI USB-6229 data acquisition board controlled by WaveSurfer 0.945 (https://wavesurfer.janelia.org/). Bilateral forelimb M1 silencing was achieved by commanding the scan mirrors to rapidly direct the laser beam back and forth between right and left forelimb M1 for one second at 40 Hz, with the AOM command voltage set to zero while the mirrors were moving to avoid stimulating more medial areas 41. For unilateral forelimb M1 corticospinal stimulation, the laser beam was directed to the expression site and pulsed at 40 Hz (20% duty cycle) for 250 ms (longer duration stimuli were used for one mouse, but the results were similar whether or not this mouse was included). In a separate cohort of corticospinal ChR2 mice, the same laser stimulus was delivered under ketamine/xylazine anesthesia immediately following opening of craniotomies. The power at the focal plane was calibrated to 5–20 mW. For silencing and stimulation, stimuli were delivered for every ten seconds while the mice were eating, regardless of whether they were currently in holding or oromanual. In one mouse used for silencing, and all control mice, stimuli were delivered every six seconds in order to increase the total number of trials collected. A mapping approach to silencing was not used due to technical constraints on data collection related to the spontaneous (un-cued) nature of the behavioral events.
Histology
Probes were coated with fluorescent dye (DiO, DiI, or DiD, Vybrant Multicolor Cell Labeling Kit, Invitrogen, Carlsbad, CA) for subsequent histological verification of probe placement under epifluorescence microscopy. Multiple colors were used to distinguish between probes placed in the same area on multiple days. Following the final recording with each mouse, the mouse was sacrificed by overdose of isoflurane followed by decapitation, and the brain was quickly dissected and placed in 4% paraformaldehyde solution (Electron Microscopy Sciences, Hatfield, PA) in 0.01 M phosphate-buffered saline (PBS, Sigma-Aldrich, Burlington, MA). Brains were fixed overnight, then washed the next day with PBS and stored in PBS with 0.02% w/v sodium azide (DOT Scientific, Burton, MI) until imaging. To image electrode tracks, brains were sliced into 100 μm serial sections using a microtome (Microm HM 650 V, Microm International, Walldorf, Germany) and imaged with a Retiga 2000R CCD camera (QImaging, Burnaby, BC, Canada) mounted on an Olympus SZX16 upright microscope (Olympus, Tokyo, Japan). Slices were imaged under bright-field illumination and appropriate fluorescent illumination for the dye(s) used in each experiment. If the dyed probe track could not be found, probe location was based on appearance of probe tracks in the bright-field image. Stereotactic coordinates were calculated for the top and bottom of the probe track as follows. The AP coordinate relative to bregma was found by counting slices from the slice containing the middle of the anterior commissure. The ML coordinate was taken as the horizontal distance to the midline in pixel values, converted to micrometers using a previously calibrated conversion factor for the magnification at which the image was taken. Finally, the coordinates of each recording were defined as the mean of the AP and ML coordinates of the top and bottom of the corresponding probe track. Based on the area borders of forelimb S1 31, all recording sites more medial than 1.7 mm lateral to bregma were assigned to forelimb M1, those more caudal than 0.7 mm anterior to bregma to forelimb S1, and the remainder to lateral M1. In one case, because probe tracks could not be recovered histologically, areal assignment was based on the area targeted. Coordinates of all recording sites are showing in Figure S2.
QUANTIFICATION AND STATISTICAL ANALYSIS
Data analysis
All neural firing data was binned into 1 ms bins aligned to simultaneously recorded video frames prior to further analysis.
Analysis of event-aligned data.
For Figure 3–5, each active unit’s spike train was first aligned to the events of interest (transport-to-mouth movement starts, regrip peaks, lowering-from-mouth movement starts). Due to sparse firing of many active units, spike trains were further binned into 20 ms bins after alignment, thus providing smoother firing rate estimates while preserving the precise alignment to kinematics possible with kilohertz-rate video. Peri-event time histograms (PETHs) for each unit spanning 0.5s before to 1.0s after transport-to-mouth or lowering-from-mouth movements and 0.5s before to 0.5s after regrips were constructed by averaging the event-aligned binned firing rates over events. Significance of PETHs was assessed as follows. A bootstrap distribution of PETHs was constructed for each active unit and event type by randomly placing virtual transport-to-mouth or lowering-from-mouth onset times in each holding interval or oromanual event, respectively, or by placing a number of random regrip times equal to the number of actual regrips in each oromanual event. This was repeated 10,000 times for each unit and event type. Then, for each active unit and event type, two one-sided p-values for excitation and inhibition were calculated as the fraction of bootstrapped PETHs with maximum firing rates greater or equal to that of the real PETH or minimum firing rates less than or equal to that of the real PETH, respectively. Finally, an active unit was designated as significantly excited or inhibited by a given event type if the corresponding p-value was significant at a false discovery rate 66 corrected alpha level of 0.05. This method of determining significance might miss inhibitory responses from a low baseline due to floor effects, particularly for recordings with fewer events. To control for this possibility, we also calculated baseline-subtracted and normalized responses for each active unit as follows. First, for each trial we subtracted the mean value in the 500 ms preceding each event. Then, the response on each trial was divided by the maximum absolute value of that unit’s average baseline-subtracted response. Thus excited units will have average responses ranging from 0 to +1 and inhibited units will have average responses ranging from 0 to −1, regardless of depth of modulation. If there are roughly equal proportions of excited and inhibited responses, the probe-average of the baseline-subtracted normalized responses will be flat. However, this average is positive for transport-to-mouth events and negative for lowering-from-mouth events (Figure S4E,F,K,L,Q,R), as would be expected it the majority of units increase firing during oromanual events, as suggested by the bootstrap tests and simple probe-averaging.
Peak latencies were calculated for each active unit as the time bin of its PETH having the maximum firing rate. The onset latency was calculated as the last time bin in which the PETH was less than the minimum pre-peak firing rate of the PETH plus 10% of the difference between the minimum and maximum firing rates.
An oromanual phasic-tonic index (PTI) was calculated for each active unit as (FRpeak − FRend)/(FRpeak+FRend), where FRpeak is the average firing rate in a 200 ms window surrounding the PETH bin with maximal firing rate and FRend is the average firing rate in the 200 ms before the lowering-from-mouth movement (i.e., the last 200 ms of each oromanual event). This is similar to the definition used previously 28, except that the window used to estimate peak firing is adapted on a per-unit basis, rather than using a fixed window.
Probe-average firing rates were estimated by averaging PETHs for all active units simultaneously recorded on the same probe. The probe-average PTI was calculated from this probe-average PETH exactly as for the active unit PTIs.
To explore possible laminar effects, we plotted firing rate during oromanual events, firing rate during holding intervals, peak oromanual firing rate, ratio of oromanual to holding firing rate, onset latency, peak latency, phasic tonic index, and non-negative matrix factorization cluster assignment (see below) for all significantly modulated active units against depth as estimated from each unit’s channel assignment in Kilosort. No strong correlations were observed (Figure S7), so this analysis was not pursued further.
Non-negative matrix factorization analysis.
Following Xu et al. 50, we used non-negative matrix factorization (NNMF) to perform simultaneous dimensionality reduction and clustering of unit responses. First, each unit’s firing rate was smoothed by convolution with a 20 ms causal boxcar, then aligned to transport-to-mouth, regrip, and lowering-from-mouth movements. Each unit’s mean response from −300 ms before to 300 ms after each event was calculated, temporally concatenated across conditions, and normalized to the interval [0, 1]. Units with zero mean event-aligned firing rate across all conditions were excluded as the normalized response is undefined in this case. The remaining normalized responses were concatenated into a single T × N matrix, where T is the number of time bins and N the number of units. This matrix was factorized into a T × k matrix of response templates, W, and a k × N matrix of response weights, H, using the nnmf function in Matlab. The optimal number of factors k was found based on 1000-fold leave-one-out bi-cross-validation 67, wherein one time bin and one unit are randomly left out of the input matrix to NNMF, W and H are recalculated, then the process is repeated 1000 times and k is chosen to minimize the mean (across folds) squared error between the full input matrix and the product of the factorizations calculated on the reduced input matrices. Units were pooled across mice and experiments for NNMF analysis. Each active unit was assigned to a cluster corresponding to the factor with the greatest contribution to that unit’s activity (i.e., the factor with the greatest weight in that unit’s column of the H matrix).
Kinematic reconstruction.
To reconstruct forelimb trajectories from neural activity, we fit general linear models (GLM) from sliding windows of varying length and lag to the X, Y, and Z, coordinates of the third digit of each hand. This was done to reduce the total number of models to fit, since the positions of digits on the same hand are highly correlated (Figure S1B). The median nose position was taken as the origin and trajectories for each experiment were rotated to align the X, Y, and Z world axes with vectors perpendicular to the mouse’s sagittal, coronal, and horizontal planes (i.e., movements along the X, Y, and Z axes corresponded to side-to-side, back-and-forth, and up-and-down movements, respectively). Trajectories and firing activity were binned into 20 ms bins, as for the PETH analyses. GLMs were fit using the fitrlinear function in Matlab using ridge regularization. Half the data was used to choose the ridge parameter, λ, using Bayesian hyperparameter optimization with ten cross-validation folds. Having found the optimal λ, the GLMs were re-fit to the remaining half of the data with fixed λ using ten-fold cross-validation. Reported R2 and regression coefficient values in the text are means over folds of this second partition.
Statistical analyses
All data presented in figures and the main text are means ± standard deviation unless otherwise indicated. Recordings were made on multiple days for some mice, with the probes being repositioned each day. In these instances, kinematic data from the same mouse are pooled across days, but data relating to neural activity from the same cortical area are averaged first within and then across days. For hypothesis testing, nonparametric tests were used wherever possible. For paired samples, Wilcoxon’s signed rank was used unless the number of samples was below the minimum required for significance at a p < 0.05 level (i.e., n < 6), in which case paired t-tests were used provided the distribution of paired differences was not significantly different from normal as assessed by the Shapiro-Wilk test. For comparing medians among more than two groups, Kruskal-Wallis ANOVA was used. For comparing means among groups across two factors simultaneously, non-parametric two-way ANOVA was performed using permutation tests via the aovp function in R. For comparing parameters measured at multiple timepoints (optogenetic silencing and stimulation experiments) or across multiple conditions (side and coordinate for reconstruction) in the same mice, repeated-measures ANOVA in Matlab (for one within-subject factor) or R (for multiple within-subject factors) was used after checking normality of data within each level of each within-subjects factor using the Shapiro-Wilk test and sphericity using Mauchly’s test. Where sphericity was violated, the Greenhouse-Geisser correction was applied to the degrees of freedom of the corresponding F-test. In all cases t-tests were used for post-hoc pairwise significance testing with p-values corrected for multiple comparisons by the Bonferroni method. Nonparametric post-hoc tests were not used as no sample size was large enough to reach significance after controlling for multiple comparisons.
Supplementary Material
Video S1. Example oromanual events, related to Figure 1
Example video segment featuring two oromanual events.
Video S2. An example oromanual event slowed down, related to Figure 1
Part of Video 1 slowed down to one-tenth speed, with tracking added. The DeepLabCut-tracked position of the nose is indicated by blue circles and each hand by red circles. The derived hand-hand and hand-nose distances are indicated by red and blue lines, respectively.
Video S3. Forelimb M1 silencing during food-handling, related to Figure 2
Example oromanual event with optogenetic silencing, slowed to one-tenth speed. Current behavioral mode, laser state, and regrips are noted.
Video S4. Corticospinal activation during food-handling, related to Figure 2
Example spontaneous transport-to-mouth movement, slowed to one-tenth speed, followed by a transport-to-mouth movement evoked by corticospinal stimulation. Movement and laser onsets are noted.
Highlights.
Forelimb M1 activity rises during the dexterous oromanual events of food-handling
Oromanual-related activity is also found in forelimb S1 and lateral M1
Forelimb position can be accurately decoded from all three areas
ACKNOWLEDGEMENTS
For technical assistance we thank F. Hausmann, M. Raineri Tapies, and M. Torres. For comments and advice, we thank Drs M. Gao, L. Miller, A. Miri, D. Piña Novo, L. Pinto, and M. Tresch.
Funding:
National Institutes of Health grant R01NS061963 (GMGS)
National Institutes of Health grant R21NS116886 (GMGS)
Footnotes
Declaration of interests: All authors declare they have no competing interests.
Publisher's Disclaimer: This is a PDF file of an unedited manuscript that has been accepted for publication. As a service to our customers we are providing this early version of the manuscript. The manuscript will undergo copyediting, typesetting, and review of the resulting proof before it is published in its final form. Please note that during the production process errors may be discovered which could affect the content, and all legal disclaimers that apply to the journal pertain.
References
- 1.Sobinov AR, and Bensmaia SJ (2021) The neural mechanisms of manual dexterity. Nat. Rev. Neurosci. 22, 741–757. [DOI] [PMC free article] [PubMed] [Google Scholar]
- 2.Warriner CL, Fageiry SK, Carmona LM, and Miri A (2020) Towards cell and subtype resolved functional organization: mouse as a model for the cortical control of movement. Neuroscience. 450, 151–160. [DOI] [PMC free article] [PubMed] [Google Scholar]
- 3.Bollu T, Ito BS, Whitehead SC, Kardon B, Redd J, Liu MH, and Goldberg JH (2021) Cortex-dependent corrections as the tongue reaches for and misses targets. Nature. 594, 82–87. [DOI] [PMC free article] [PubMed] [Google Scholar]
- 4.Svoboda K, and Li N (2018) Neural mechanisms of movement planning: motor cortex and beyond. Curr. Opin. Neurobiol. 49, 33–41. [DOI] [PubMed] [Google Scholar]
- 5.Miller CT, Gire D, Hoke K, Huk AC, Kelley D, Leopold DA, Smear MC, Theunissen F, Yartsev M, and Niell CM (2022) Natural behavior is the language of the brain. Curr. Biol. 32, R482–R493. [DOI] [PMC free article] [PubMed] [Google Scholar]
- 6.Dennis EJ, El Hady A, Michaiel A, Clemens A, Tervo DRG, Voigts J, and Datta SR (2021) Systems neuroscience of natural behaviors in rodents. J. Neurosci. 41, 911–919. [DOI] [PMC free article] [PubMed] [Google Scholar]
- 7.Krakauer JW, Ghazanfar AA, Gomez-Marin A, MacIver MA, and Poeppel D (2017) Neuroscience needs behavior: correcting a reductionist bias. Neuron. 93, 480–490. [DOI] [PubMed] [Google Scholar]
- 8.Datta SR, Anderson DJ, Branson K, Perona P, and Leifer A (2019) Computational neuroethology: a call to action. Neuron. 104, 11–24. [DOI] [PMC free article] [PubMed] [Google Scholar]
- 9.Whishaw IQ, and Coles BL (1996) Varieties of paw and digit movement during spontaneous food handling in rats: postures, bimanual coordination, preferences, and the effect of forelimb cortex lesions. Behav. Brain. Res. 77, 135–148. [DOI] [PubMed] [Google Scholar]
- 10.Barrett JM, Raineri Tapies MG, and Shepherd GMG (2020) Manual dexterity of mice during food-handling involves the thumb and a set of fast basic movements. PLoS ONE. 15, e0226774. [DOI] [PMC free article] [PubMed] [Google Scholar]
- 11.Whishaw IQ, Ghasroddashti A, Mirza Agha B, and Mohajerani MH (2020) The temporal choreography of the yo-yo movement of getting spaghetti into the mouth by the head-fixed mouse. Behav. Brain. Res. 381, 112241. [DOI] [PubMed] [Google Scholar]
- 12.Tennant KA, Asay AL, Allred RP, Ozburn AR, Kleim JA, and Jones TA (2010) The vermicelli and capellini handling tests: simple quantitative measures of dexterous forepaw function in rats and mice. JoVE. doi: 10.3791/2076 [DOI] [PMC free article] [PubMed] [Google Scholar]
- 13.Mohan H, An X, Kondo H, Zhao S, Musall S, Mitra P, and Huang ZJ (2021) Cortical glutamatergic projection neuron types contribute to distinct functional subnetworks. bioRxiv. 10.1101/2021.12.30.474537 [DOI] [PMC free article] [PubMed] [Google Scholar]
- 14.Guo JZ, Graves AR, Guo WW, Zheng J, Lee A, Rodriguez-Gonzalez J, Li N, Macklin JJ, Phillips JW, Mensh BD, et al. (2015) Cortex commands the performance of skilled movement. eLife. 4, e10774. [DOI] [PMC free article] [PubMed] [Google Scholar]
- 15.Hwang EJ, Dahlen JE, Hu YY, Aguilar K, Yu B, Mukundan M, Mitani A, and Komiyama T (2019) Disengagement of motor cortex from movement control during long-term learning. Sci. Adv. 5, eaay0001. [DOI] [PMC free article] [PubMed] [Google Scholar]
- 16.Hwang EJ, Dahlen JE, Mukundan M, and Komiyama T (2021) Disengagement of motor cortex during long-term learning tracks the performance level of learned movements. J. Neurosci. 41, 7029–7047. [DOI] [PMC free article] [PubMed] [Google Scholar]
- 17.Dhawale AK, Wolff SBE, Ko R, and Olveczky BP (2021) The basal ganglia control the detailed kinematics of learned motor skills. Nat Neurosci. 24, 1256–1269. [DOI] [PMC free article] [PubMed] [Google Scholar]
- 18.Wolff SBE, Ko R, and Olveczky BP (2022) Distinct roles for motor cortical and thalamic inputs to striatum during motor skill learning and execution. Sci. Adv. 8, eabk0231. [DOI] [PMC free article] [PubMed] [Google Scholar]
- 19.Ruder L, Schina R, Kanodia H, Valencia-Garcia S, Pivetta C, and Arber S (2021) A functional map for diverse forelimb actions within brainstem circuitry. Nature. 590, 445–450. [DOI] [PubMed] [Google Scholar]
- 20.Graziano MS, Taylor CS, and Moore T (2002) Complex movements evoked by microstimulation of precentral cortex. Neuron. 34, 841–851. [DOI] [PubMed] [Google Scholar]
- 21.Hira R, Terada S, Kondo M, and Matsuzaki M (2015) Distinct functional modules for discrete and rhythmic forelimb movements in the mouse motor cortex. J Neurosci. 35, 13311–13322. [DOI] [PMC free article] [PubMed] [Google Scholar]
- 22.Mercer Lindsay N, Knutsen PM, Lozada AF, Gibbs D, Karten HJ, and Kleinfeld D (2019) Orofacial movements involve parallel corticobulbar projections from motor cortex to trigeminal premotor nuclei. Neuron. 104, 765–780 e763. [DOI] [PMC free article] [PubMed] [Google Scholar]
- 23.Fromm C, and Evarts EV (1977) Relation of motor cortex neurons to precisely controlled and ballistic movements. Neurosci. Lett. 5, 259–265. [DOI] [PubMed] [Google Scholar]
- 24.Guo JZ, Sauerbrei BA, Cohen JD, Mischiati M, Graves AR, Pisanello F, Branson KM, and Hantman AW (2021) Disrupting cortico-cerebellar communication impairs dexterity. eLife. 10, e65906. [DOI] [PMC free article] [PubMed] [Google Scholar]
- 25.Sjöbom J, Tamtè M, Halje P, Brys I, and Petersson P (2020) Cortical and striatal circuits together encode transitions in natural behavior. Sci. Adv. 6, eabc1173. [DOI] [PMC free article] [PubMed] [Google Scholar]
- 26.Miri A, Warriner CL, Seely JS, Elsayed GF, Cunningham JP, Churchland MM, and Jessell TM (2017) Behaviorally selective engagement of short-latency effector pathways by motor cortex. Neuron. 95, 683–696. [DOI] [PMC free article] [PubMed] [Google Scholar]
- 27.Li N, Chen S, Guo ZV, Chen H, Huo Y, Inagaki HK, Chen G, Davis C, Hansel D, Guo C, et al. (2019) Spatiotemporal constraints on optogenetic inactivation in cortical circuits. eLife. 8, e48622. [DOI] [PMC free article] [PubMed] [Google Scholar]
- 28.Shalit U, Zinger N, Joshua M, and Prut Y (2012) Descending systems translate transient cortical commands into a sustained muscle activation signal. Cereb. Cortex. 22, 1904–1914. [DOI] [PubMed] [Google Scholar]
- 29.Hira R, Ohkubo F, Ozawa K, Isomura Y, Kitamura K, Kano M, Kasai H, and Matsuzaki M (2013) Spatiotemporal dynamics of functional clusters of neurons in the mouse motor cortex during a voluntary movement. J. Neurosci. 33, 1377–1390. [DOI] [PMC free article] [PubMed] [Google Scholar]
- 30.Mayrhofer JM, El-Boustani S, Foustoukos G, Auffret M, Tamura K, and Petersen CCH (2019) Distinct contributions of whisker sensory cortex and tongue-jaw motor cortex in a goal-directed sensorimotor transformation. Neuron. 103, 1034–1043 e1035. [DOI] [PMC free article] [PubMed] [Google Scholar]
- 31.Yamawaki N, Raineri Tapies MG, Stults A, Smith GA, and Shepherd GM (2021) Circuit organization of the excitatory sensorimotor loop through hand/forelimb S1 and M1. eLife. 10, e66836. [DOI] [PMC free article] [PubMed] [Google Scholar]
- 32.Lee DD, and Seung HS (1999) Learning the parts of objects by non-negative matrix factorization. Nature. 401, 788–791. [DOI] [PubMed] [Google Scholar]
- 33.Pereira TD, Shaevitz JW, and Murthy M (2020) Quantifying behavior to understand the brain. Nat. Neurosci. 23, 1537–1549. [DOI] [PMC free article] [PubMed] [Google Scholar]
- 34.Wiltschko AB, Johnson MJ, Iurilli G, Peterson RE, Katon JM, Pashkovski SL, Abraira VE, Adams RP, and Datta SR (2015) Mapping sub-second structure in mouse behavior. Neuron. 88, 1121–1135. [DOI] [PMC free article] [PubMed] [Google Scholar]
- 35.Hsu AI, and Yttri EA (2021) B-SOiD, an open-source unsupervised algorithm for identification and fast prediction of behaviors. Nat. Comm. 12, 5188. [DOI] [PMC free article] [PubMed] [Google Scholar]
- 36.Batty E, Whiteway MR, Saxena S, Biderman D, Abe T, Musall S, Gillis W, Markowitz JE, Churchland A, Cunningham J, et al. (2019) BehaveNet: nonlinear embedding and Bayesian neural decoding of behavioral videos. Adv. Neur. In. 32, 1–12. [Google Scholar]
- 37.Whiteway MR, Biderman D, Friedman Y, Dipoppa M, Buchanan EK, Wu A, Zhou J, Bonacchi N, Miska NJ, Noel JP, et al. (2021) Partitioning variability in animal behavioral videos using semi-supervised variational autoencoders. PLoS Comput. Biol. 17, e1009439. [DOI] [PMC free article] [PubMed] [Google Scholar]
- 38.Phillips EA, and Hasenstaub AR (2016) Asymmetric effects of activating and inactivating cortical interneurons. eLife. 5, e18383. [DOI] [PMC free article] [PubMed] [Google Scholar]
- 39.Kaufman MT, Churchland MM, Ryu SI, and Shenoy KV (2014) Cortical activity in the null space: permitting preparation without movement. Nat. Neurosci. 17, 440–448. [DOI] [PMC free article] [PubMed] [Google Scholar]
- 40.Soma S, Yoshida J, Kato S, Takahashi Y, Nonomura S, Sugimura YK, Rios A, Kawabata M, Kobayashi K, Kato F, et al. (2019) Ipsilateral-dominant control of limb movements in rodent posterior parietal cortex. J. Neurosci. 39, 485–502. [DOI] [PMC free article] [PubMed] [Google Scholar]
- 41.Morandell K, and Huber D (2017) The role of forelimb motor cortex areas in goal directed action in mice. Sci. Rep. 7, 15759. [DOI] [PMC free article] [PubMed] [Google Scholar]
- 42.Li N, Daie K, Svoboda K, and Druckmann S (2016) Robust neuronal dynamics in premotor cortex during motor planning. Nature. 532, 459–464. [DOI] [PMC free article] [PubMed] [Google Scholar]
- 43.Nelson A, Abdelmesih B, and Costa RM (2021) Corticospinal populations broadcast complex motor signals to coordinated spinal and striatal circuits. Nat. Neurosci. 24, 1721–1732. [DOI] [PMC free article] [PubMed] [Google Scholar]
- 44.BICCN (2021) A multimodal cell census and atlas of the mammalian primary motor cortex. Nature. 598, 86–102. [DOI] [PMC free article] [PubMed] [Google Scholar]
- 45.Dacre J, Colligan M, Clarke T, Ammer JJ, Schiemann J, Chamosa-Pino V, Claudi F, Harston JA, Eleftheriou C, Pakan JMP, et al. (2021) A cerebellar-thalamocortical pathway drives behavioral context-dependent movement initiation. Neuron. 109, 2326–2338 e2328. [DOI] [PMC free article] [PubMed] [Google Scholar]
- 46.Sauerbrei BA, Guo JZ, Cohen JD, Mischiati M, Guo W, Kabra M, Verma N, Mensh B, Branson K, and Hantman AW (2020) Cortical pattern generation during dexterous movement is input-driven. Nature. 577, 386–391. [DOI] [PMC free article] [PubMed] [Google Scholar]
- 47.Yamawaki N, and Shepherd GMG (2015) Synaptic circuit organization of motor corticothalamic neurons. J. Neurosci. 35, 2293–2307. [DOI] [PMC free article] [PubMed] [Google Scholar]
- 48.Ames KC, and Churchland MM (2019) Motor cortex signals for each arm are mixed across hemispheres and neurons yet partitioned within the population response. eLife. 8 [DOI] [PMC free article] [PubMed] [Google Scholar]
- 49.Schneider A, Zimmermann C, Alyahyay M, Steenbergen F, Brox T, and Diester I (2022) 3D pose estimation enables virtual head fixation in freely moving rats. Neuron. 110, 2080–2093.e10 [DOI] [PubMed] [Google Scholar]
- 50.Xu D, Dong M, Chen Y, Delgado AM, Hughes NC, Zhang L, and O’Connor DH (2022) Cortical processing of flexible and context-dependent sensorimotor sequences. Nature. 603, 464–469. [DOI] [PMC free article] [PubMed] [Google Scholar]
- 51.Sanderson KJ, Welker W, and Shambes GM (1984) Reevaluation of motor cortex and of sensorimotor overlap in cerebral cortex of albino rats. Brain Res. 292, 251–260. [DOI] [PubMed] [Google Scholar]
- 52.Graziano MSA (2016) Ethological action maps: a paradigm shift for the motor cortex. Trends Cogn. Sci. 20, 121–132. [DOI] [PubMed] [Google Scholar]
- 53.Umeda T, Isa T, and Nishimura Y (2019) The somatosensory cortex receives information about motor output. Sci. Adv. 5, eaaw5388. [DOI] [PMC free article] [PubMed] [Google Scholar]
- 54.Madisen L, Mao T, Koch H, Zhuo JM, Berenyi A, Fujisawa S, Hsu YW, Garcia AJ 3rd, Gu X, Zanella S, et al. (2012) A toolbox of Cre-dependent optogenetic transgenic mice for light-induced activation and silencing. Nat. Neurosci. 15, 793–802. [DOI] [PMC free article] [PubMed] [Google Scholar]
- 55.Hippenmeyer S, Vrieseling E, Sigrist M, Portmann T, Laengle C, Ladle DR, and Arber S (2005) A developmental switch in the response of DRG neurons to ETS transcription factor signaling. PLoS Biol. 3, e159. [DOI] [PMC free article] [PubMed] [Google Scholar]
- 56.Tervo DG, Hwang BY, Viswanathan S, Gaj T, Lavzin M, Ritola KD, Lindo S, Michael S, Kuleshova E, Ojala D, et al. (2016) A designer AAV variant permits efficient retrograde access to projection neurons. Neuron. 92, 372–382. [DOI] [PMC free article] [PubMed] [Google Scholar]
- 57.Guo ZV, Hires SA, Li N, O’Connor DH, Komiyama T, Ophir E, Huber D, Bonardi C, Morandell K, Gutnisky D, et al. (2014) Procedures for behavioral experiments in head-fixed mice. PLoS ONE. 9, e88678. [DOI] [PMC free article] [PubMed] [Google Scholar]
- 58.Ullman-Cullere MH, and Foltz CJ (1999) Body condition scoring: a rapid and accurate method for assessing health status in mice. Lab. Anim. Sci. 49, 319–323. [PubMed] [Google Scholar]
- 59.Mathis A, Mamidanna P, Cury KM, Abe T, Murthy VN, Mathis MW, and Bethge M (2018) DeepLabCut: markerless pose estimation of user-defined body parts with deep learning. Nat. Neurosci. 21, 1281–1289. [DOI] [PubMed] [Google Scholar]
- 60.Karashchuk P, Rupp KL, Dickinson ES, Walling-Bell S, Sanders E, Azim E, Brunton BW, and Tuthill JC (2021) Anipose: A toolkit for robust markerless 3D pose estimation. Cell Rep. 36, 109730. [DOI] [PMC free article] [PubMed] [Google Scholar]
- 61.Steinmetz NA, Aydin C, Lebedeva A, Okun M, Pachitariu M, Bauza M, Beau M, Bhagat J, Bohm C, Broux M, et al. (2021) Neuropixels 2.0: A miniaturized high-density probe for stable, long-term brain recordings. Science. 372, eabf4588. [DOI] [PMC free article] [PubMed] [Google Scholar]
- 62.Pachitariu M, Steinmetz N, Kadir S, Carandini M, and Harris KD (2016) Kilosort: realtime spike-sorting for extracellular electrophysiology with hundreds of channels. bioRxiv. 10.1101/061481. [DOI] [Google Scholar]
- 63.Hall NJ, Herzfeld DJ, and Lisberger SG (2021) Evaluation and resolution of many challenges of neural spike sorting: a new sorter. J. Neurophysiol. 126, 2065–2090. [DOI] [PMC free article] [PubMed] [Google Scholar]
- 64.Jiang Y, Li X, Liu B, Yi J, Fang Y, Shi F, Gao X, Sudzilovsky E, Parameswaran R, Koehler K, et al. (2018) Rational design of silicon structures for optically controlled multiscale biointerfaces. Nat. Biomed. Eng. 2, 508–521. [DOI] [PMC free article] [PubMed] [Google Scholar]
- 65.Jiang Y, Parameswaran R, Li X, Carvalho-de-Souza JL, Gao X, Meng L, Bezanilla F, Shepherd GMG, and Tian B (2019) Nongenetic optical neuromodulation with silicon-based materials. Nat. Protoc. 14, 1339–1376. [DOI] [PMC free article] [PubMed] [Google Scholar]
- 66.Benjamini Y, and Hochberg Y (1995) Controlling the false discovery rate: a practical and powerful approach to multiple testing. J. Royal Stat. Soc. Ser. B (Meth.). 57, 289–300. [Google Scholar]
- 67.Owen AB, and Perry PO (2009) Bi-cross-validation of the SVD and the nonnegative matrix factorization. Ann. Appl. Stat. 3, 564–594. [Google Scholar]
Associated Data
This section collects any data citations, data availability statements, or supplementary materials included in this article.
Supplementary Materials
Video S1. Example oromanual events, related to Figure 1
Example video segment featuring two oromanual events.
Video S2. An example oromanual event slowed down, related to Figure 1
Part of Video 1 slowed down to one-tenth speed, with tracking added. The DeepLabCut-tracked position of the nose is indicated by blue circles and each hand by red circles. The derived hand-hand and hand-nose distances are indicated by red and blue lines, respectively.
Video S3. Forelimb M1 silencing during food-handling, related to Figure 2
Example oromanual event with optogenetic silencing, slowed to one-tenth speed. Current behavioral mode, laser state, and regrips are noted.
Video S4. Corticospinal activation during food-handling, related to Figure 2
Example spontaneous transport-to-mouth movement, slowed to one-tenth speed, followed by a transport-to-mouth movement evoked by corticospinal stimulation. Movement and laser onsets are noted.
Data Availability Statement
Kinematic, ethogram, and electrophysiological data have been deposited at Zenodo and will be publicly available as of the date of publication. DOIs are listed in the key resources table.
All original code has been deposited at Zenodo and will be publicly available as of the date of publication. DOIs are listed in the key resources table.
Any additional information required to reanalyze the data reported in this paper is available from the lead contact upon request.
Key resources table.
| REAGENT or RESOURCE | SOURCE | IDENTIFIER |
|---|---|---|
| Bacterial and virus strains | ||
| pAAV-Syn-ChR2(H134R)-GFP | Boyden et al Nat Neurosci. 2005 Sep. 8(9):1263–8. | Addgene 58880-AAVrg |
| pAAV-CAG-GFP | Edward Boyden Lab | Addgene 37825-AAVrg |
| Deposited data | ||
| Tracking, spiking, and ethogram data | This paper | 10.5281/zenodo.7083395 |
| Experimental models: Organisms/strains | ||
| Mouse: C57BL/6J | The Jackson Laboratory | RRID: IMSR_JAX:000664 |
| Mouse: B6.Cg-Gt(ROSA)26Sortm32(CAG-COP4*H134R/EYFP)Hze/J | The Jackson Laboratory | RRID: IMSR_JAX:024109 |
| Mouse: B6.129P2-Pvalbtm1(cre)Arbr/J | The Jackson Laboratory | RRID: IMSR_JAX: 017320 |
| Software and algorithms | ||
| Matlab | The MathWorks | RRID:SCR_001622 |
| Kilosort2 | https://github.com/MouseLand/Kilosort | RRID:SCR_016422 |
| RHD USB Interface Board Software | http://intantech.com/downloads.html?tabSelect=Software | RRID:SCR_019278 |
| DeepLabCut | Mathis et al., 2018 | https://github.com/DeepLabCut/DeepLabCut |
| Anipose | Karashchuk et al., 2021 | https://anipose.readthedocs.io/en/latest/ |
| Wavesurfer v0.945 | https://wavesurfer.janelia.org/ | https://wavesurfer.janelia.org/ |
| Matlab and R analysis code | This paper | http://dx.doi.org/10.5281/zenodo.6588397 |