Abstract
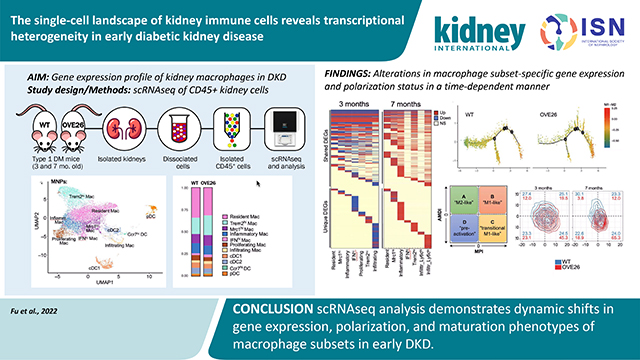
The pathogenesis of diabetic kidney disease (DKD) involves multifactorial processes that converge to initiate and advance the disease. Although DKD is not typically classified as an inflammatory glomerular disease, mounting evidence supports the involvement of kidney inflammation as a key contributor in DKD pathogenesis, particularly through macrophages. However, detailed identification and corresponding phenotypic changes of macrophages in DKD remain poorly understood. To capture the gene expression changes in specific macrophage cell subsets in early DKD, we performed single-cell transcriptomic analysis of CD45-enriched kidney immune cells from type 1 diabetic OVE26 mice at two time points during the disease development. We also undertook a focused analysis of mononuclear phagocytes (macrophages and dendritic cells). Our results show increased resident and infiltrating macrophage subsets in the kidneys of mice with diabetes over time, with heightened expression of pro-inflammatory or anti-inflammatory genes in a subset-specific manner. Further analysis of macrophage polarization states in each subset in the kidneys showed changes consistent with the continuum of activation and differentiation states, with gene expression tending to shift toward undifferentiated phenotypes but with increased M1-like inflammatory phenotypes over time. By deconvolution analysis of RNAseq samples and by immunostaining of biopsies from patients with DKD, we further confirmed a differential expression of select genes in specific macrophage subsets essentially recapitulating the studies in mice. Thus, our study provides a comprehensive analysis of macrophage transcriptomic profiles in early DKD that underscores the dynamic macrophage phenotypes in disease progression.
Keywords: single-cell RNA sequencing, diabetic kidney disease, immune cells, macrophages, inflammation
Graphical Abstract
INTRODUCTION
Diabetic kidney disease (DKD) is the most common cause of end-stage kidney disease in the United States and worldwide 1. As disease pathogenesis involves complex processes beyond diabetes-induced metabolic and hemodynamic alterations, the current regimen of glucose- and blood pressure-lowering agents offer limited protection against the development of end-stage kidney disease (ESKD) 2, 3. While DKD is not typically considered to be an inflammatory glomerular disease, increasing evidence from clinical and experimental studies supports a key role of renal inflammation in the development and progression of DKD. Macrophage and T cell infiltration is commonly observed in glomerular and tubulointerstitial compartments of mouse and human diabetic kidneys 4–8, and recent single-cell transcriptomic analysis of type 2 diabetic patient kidney biopsy specimens demonstrated a 7-to 8-fold increase in leukocytes 9. An early experimental study has highlighted the role of inflammatory mediators, tumor necrosis factor (TNF), and interleukin-1 (IL-1) in DKD 10, and more recent clinical studies showed that the circulating TNF receptors 1 and 2 are strong predictors of DKD progression and ESKD 11, 12. Moreover, a recent analytical review evaluating the published urinary proteomic and peptidomic analyses in human DKD 13 indicates that inflammation and immune response regulation are likely among the key underlying biological processes in the early stage that drive disease progression. However, the phenotypes of specific immune cell types in the diabetic kidney are not well understood, particularly in the early stages of DKD.
Recent single-cell RNA sequencing (scRNAseq) analyses have revealed the complexity of cellular phenotypes in normal and injured mouse and human kidneys 9, 14–22, including the myeloid cells 23, 24. As phenotypes of murine DKD tend to better reflect the morphologic changes of early human DKD 25, 26, utilizing one of the well-established mouse models of DKD as a surrogate model for early DKD 26, 27, we also demonstrated gene expression changes occurring in glomerular cells of diabetic kidneys 28. One salient observation from this study was increased macrophages in the glomeruli of diabetic mice, whose phenotype was consistent with that of canonical M1 activation 28. To obtain a comprehensive and unbiased view of immune cell phenotypes in DKD, particularly of macrophage subsets 29, in the current study we assessed the gene expression analysis of CD45-positive immune cells isolated from kidneys of type 1 diabetic mice, OVE26. OVE26 mice in the FVB/N background is a robust mouse model of DKD that manifests significant albuminuria, glomerular hypertrophy, and mesangial matrix expansion as early as 2 months of age 30–32. These features become much more pronounced as the disease advances over time and are accompanied by a mild degree of tubulointerstitial fibrosis 30–32. Therefore, in the current study, we performed the scRNAseq analysis of CD45-enriched immune cells from OVE26 mice at 3 months of age, and analysis of gene expression changes in macrophage subsets in diabetic kidneys. We also examined their activation and differentiation status, which were compared to the changes occurring in the more advanced disease at 7 months of age in OVE26 mice. Together, the current study delineates the transcriptional change in macrophage subsets in the early DKD model in OVE26 mice.
METHODS
Study Approval
All animal studies were performed under the guidelines of and approved by the Institutional Animal Care and Use Committee at the Icahn School of Medicine at Mount Sinai (# IACUC-2018-0033).
Mouse model
Type 1 diabetic OVE26 mice (FVB(Cg)-Tg(Cryaa-Tag, Ins2-CALM1)26Ove/PneJ) in FVB/N background were obtained from The Jackson Laboratory and maintained in the specific pathogen-free facility at Icahn School of Medicine at Mount Sinai with free access to chow and water and a 12-hour day/night cycle. Bodyweight and fasting blood glucose levels were monitored biweekly by glucometer readings. Diabetes was confirmed by fasting blood glucose levels greater than 300 mg/dl. Male OVE26 and non-diabetic littermates of 3 and 7 months of age were used for the study.
CD45-positive kidney immune single-cell isolation and processing
Following exsanguination by PBS-perfusion, mouse kidneys were isolated, decapsulated, and minced into approximately 1mm3 pieces with a sterile razor blade. Minced kidney tissues were digested for 20 minutes at 37°C in RPMI media with protease cocktail as previously described 28. Gently dissociated cells were filtered through a 70-micron cell strainer and collected by centrifugation. Cells were then resuspended in calcium- and magnesium-free PBS containing 0.04% bovine serum albumin (BSA) and anti-CD16/Cd32 Fc receptor (BD Pharmingen, #553141) and incubated for 15 minutes on ice. Cells were washed with PBS with 0.04% BSA and incubated with PE-conjugated rat anti-mouse CD45 monoclonal antibody (1:200 dilution; ThermoFisher, #12-0451-82) for 30 minutes at room temperature. After washing, the cell suspension was passed through a 40-micron cell strainer and collected by centrifugation at 4°C. All cells were stained with 4′,6-diamidino-2-phenylindole (DAPI), and viable CD45+ cells were isolated using BD FACS Aria II cell sorter (BD Biosciences). Sorted cells from three mice were pooled into a single sample per experimental group for analysis. Single-cell suspension and libraries were prepared according to the 10x Genomics Single Cell protocol (Chromium Single Cell 3′ Reagent Kit v3). The final constructed single-cell libraries were sequenced by Illumina Novaseq machine with total reads per cell targeted for a minimum of 30,000.
Detailed methods for scRNAseq analysis are included in the Supplemental Methods.
RESULTS
scRNAseq analysis identifies distinct immune cell types in mouse kidneys
Supplemental Figure 1 shows the representative images of kidney histopathology and kidney function of OVE26 mice at 3 and 7 months old, representing early to moderate DKD stages. To assess the gene expression change occurring during the early stages of the disease, we harvested kidneys from diabetic OVE26 mice and non-diabetic littermate controls (WT) at 3 months of age. Since DKD development is not affected by gender in OVE26 mice 30 but the influence of gender in affecting gene expression in specific kidney cell types has been noted 16, we limited our analysis to male mice for the study. Dissociated kidney cells from 3 WT and 3 OVE26 mice were processed and enriched for CD45-positive myeloid cells (Figure 1A, Methods). Isolated CD45+ cells from three mice were then pooled into a single sample per experimental condition for scRNAseq analysis using the 10X Genomics platform. After applying the quality control filters (Supp. Methods, Supplemental Figure 2A), we obtained ~17,000 CD45+ single-cell transcriptomes from WT and OVE26 mice, consisting of ~10,500 WT and ~6,500 OVE26 single-cells (Suppl. Figure 2B).
Figure 1: Analysis of immune cell subpopulations in early stage of DKD in OVE26 mice.
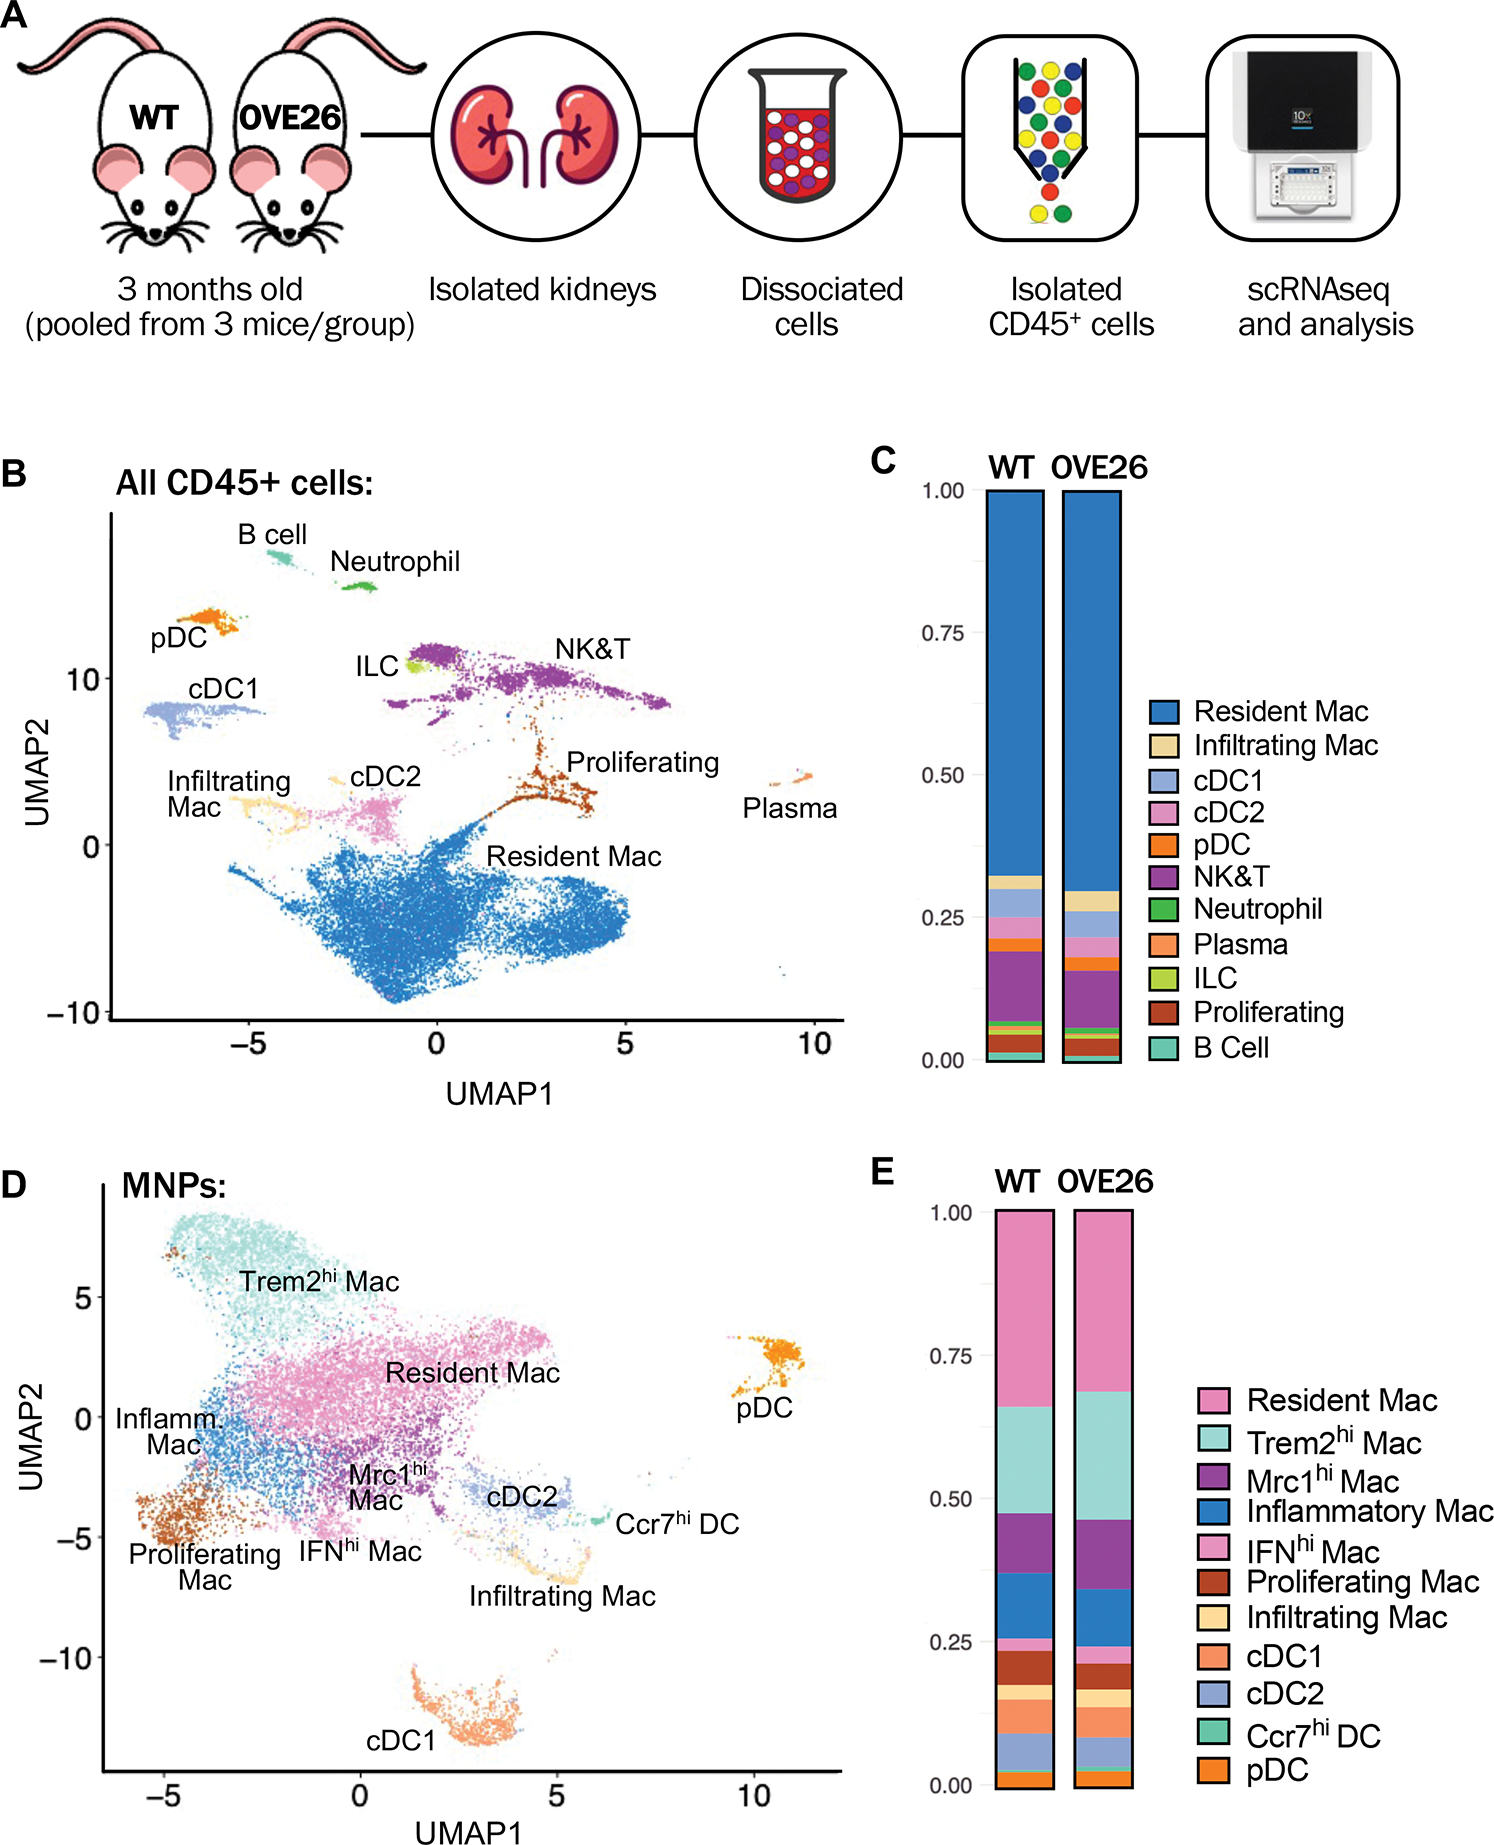
(A) Schematic diagram illustrating the experimental workflow. Phosphate-buffered saline-perfused kidneys of control wildtype (WT) and diabetic OVE26 mice of 3 months of age were isolated and dissociated. CD45+ cells were sorted from each sample by flow cytometry were pooled from 3 mice per experimental group for scRNAseq analysis. (B) Uniform manifold approximation and projection (UMAP) of all CD45+ cells from WT and OVE26 mouse kidneys. (C) Proportions of CD45+ immune cell subtypes in WT and OVE26 kidneys are shown as a bar graph. (D) UMAP plot of MNPs from WT and OVE26 mouse kidneys. (E) Proportions of each MNP subclusters in WT and OVE26 kidneys. DC, dentritic cell; Mac, macrophage; cDC, conventional DC; pDC, plasmacytoid DC; ILCs, innate lymphoid cells; NK&T, natural killer and T cells; IFNhi, interferon (IFN)-induced gene expression-high; Mrc1hi, Mannose receptor C-type 1 expression-high; Trem2hi, triggered receptor expressed on myeloid cells 2 expression-high; Ccr7hi, C-C motif chemokine receptor 7 expression-high.
Unsupervised clustering showed 11 distinct CD45+ cell clusters that were identified based on the canonical marker expressions and by comparison to previously reported datasets 19, 23, 24, 33 as macrophages, dendritic cells, natural killer and T cells (NK&T), B cells, neutrophils, plasma cells, innate lymphoid cells (ILCs), and proliferating immune cells, (Figure 1B, Suppl. Figure 3). While the proportion of immune cell types was largely similar between the WT and OVE26 kidneys (Figure 1C), we nevertheless detected a small increase in the resident macrophage and infiltrating macrophage populations in OVE26 kidneys in comparison to WT. The proportions of each immune cell subtype in WT and OVE26 mice are provided in Supp. Table 1.
To examine the kidney macrophage heterogeneity, we performed the unsupervised clustering of mononuclear phagocytes (MNPs) from WT and OVE26 kidney immune cells, which identified 11 subcluster, 4 dendritic cell (DC) and 7 macrophage (Mac) populations. DCs were composed of conventional DCs (cDC1 and cDC2), plasmacytoid DC (pDC), and a small cluster of DCs expressing higher levels of inflammatory chemokines and their receptor (referred to as Ccr7+ DC). Macrophage subsets consisted of infiltrating macrophages and 6 macrophage subsets expressing previously defined resident macrophages genes (e.g., C1q, Cd81) 23, as well as other shared genes (e.g., Ctsh, Selenop, and Mgl2). Of these, one group was annotated as “Resident Mac” and 5 other macrophage subsets were further differentiated based on an additional set of co-expressed genes (Supp. Figures 4–5) as follows: “Inflammatory Mac” showed a relatively high expression of pro-inflammatory chemokines (e.g., Ccl4, Ccl3, Cxcl2, Il1b, and Cd72); “Interferon (IFN) gene signature-high (IFNhi) Mac” showed higher expression of IFN-stimulated genes (e.g., Cxcl9, Ccl12, Isg15, and Gbp2), as reported recently 24; “Mannose receptor C-type 1 (Mrc1)-high expressing (Mcr1hi) Mac” displayed relatively higher expression of genes related to M2 polarization and resolution of inflammation (e.g., Mrc1, Maf, Apoe, and Stab1) 34–37; “Triggering receptor expressed on myeloid cells 2 (Trem2)-high expressing (Trem2hi) Mac” subsets, while having some overlapping gene expression with Mrc1hi Macs, it additionally expressed genes such as Trem2, Cd9, Spp1, and Lgals3, as recently reported for this macrophage subtype 38–40, whose function is associated with attenuation and resolution of macrophage activation 41, 42; and “Proliferating Mac” were characterized by the expression of genes consistent with DNA metabolism, cell division, and proliferation, such as Hist1h2ap, Hist1h1b, Birc5, Ube2c, and Cenpf. Suppl. Figure 6 shows examples of gene ontology (GO) pathways that are specifically enriched in each macrophage subset, and the full list of marker genes for each MNP subtype and GO pathways is provided in Supp. Excel File 1a–b.
Consistent with the initial total CD45+ analysis (Figure 1C), we observed a small increase in the proportion of Infiltrating Mac in the kidneys of 3-month-old OVE26 mice in comparison to those of the age-matched WT mice (Figure 1E, Supp. Table 1). We also observed small but notable increases in the proportions of IFNhi, Trem2hi, and Mrc1hi Mac subpopulations in the diabetic kidneys, suggesting a concomitant regulation of pro-inflammatory and anti-inflammatory pathways in macrophages in early DKD.
To corroborate the above observation, we performed a flow cytometric analysis of CD45+ immune cells isolated from kidneys of an independent cohort of control and OVE26 mouse at 3 months of age (Supp. Figure 7A; n=3 mice per group). Using similar parameters as previously published by others 43, 44, MNPs from control and OVE26 mice were divided into five subsets that corresponded to F4/80high resident macrophages (subset 3), CD11bhigh infiltrating macrophages (subsets 1 and 2), and dendritic cell-like CD11bmedium, CD11chigh (subset 4) and CD11blow, CD11cmedium (subset 5) cells (Supp. Figure 7B). In line with the above scRNAseq analysis, F4/80high resident macrophages, the most abundant subset, were not significantly altered between WT and OVE26 kidneys (Supp. Figure 7B); however, a small increase in the proportion of CD11bhigh infiltrating macrophages (4.45% WT vs. 6.91% OVE26) was noted. We additionally examined the macrophage subsets for the expression of canonical M1 marker (CD86), M2 marker (MRC1, also known as CD206), and major histocompatibility complex (MHC) II, as described by Nordlohne et al. 43, which showed an increasing trend for both M1- and M2-like macrophage subtypes in the OVE26 kidneys (Supp. Figure 7C), although the increase in CD86+ M1-like macrophages did not reach statistical significance. Thus, these results are consistent with the above scRNAseq observation of increased pro-inflammatory and anti-inflammatory macrophage gene expression during DKD development.
Additionally, since macrophage accumulation is more evident with DKD progression 4, 5, 7, 8, we further validated the increase in specific kidney myeloid cell subtypes in OVE26 mice at 7 months of age, when the disease is comparatively more advanced (Supp. Figure 1). scRNAseq analysis of CD45-enriched kidney cells from WT and OVE26 mice, performed similarly as above, identified the same immune cell subsets as kidneys from mice of 3 months of age, but with varying overall proportions (Figure 2A–B, Suppl. Table 1). This variability is likely due to the combination of intrinsic differences in kidney cells in the aging process and extrinsic batch effects between the two independent experiments. Analysis of the MNPs showed largely similar macrophage subsets as previously identified, but the Infiltrating Macs were further subdivided into Ly6chi or Ly6clo, subtypes (Figure 2C–D). Interestingly, Ly6chi subtype expressed a high level of Fn1, while Ly6clo subtype expressed a high Ace expression (Suppl. Figure 8, Suppl. Excel File 1b), similar to macrophage subpopulations recently described in the context of acute kidney injury 45. We also observed a small population of macrophage subset 14 (M14), which showed overlapping gene expression profiles with Mrc1hi Macs, but with higher expression of the classical M2 macrophage markers (e.g., Cd163, Fcna, Retnla), suggesting that it may be a distinct subtype of Mrc1hi Macs. The small group of Proliferating Macs was not observed in the 7-month-old kidneys, which may have been undetected due to their relatively low overall proportions. But as anticipated, an increase in Trem2hi, Mrc1hi, and Infiltrating Macs relative to the non-diabetic control was more evident at this stage (Figure 2D, Suppl. Table 1). Immunostaining for TREM2, MRC1, and S100A4 (for infiltrating macrophages) further confirmed their increased expression in OVE26 kidneys (Suppl. Figure 9).
Figure 2: Analysis of mononuclear phagocyte (MNP) cell subpopulations in 7-months-old OVE26 mice.
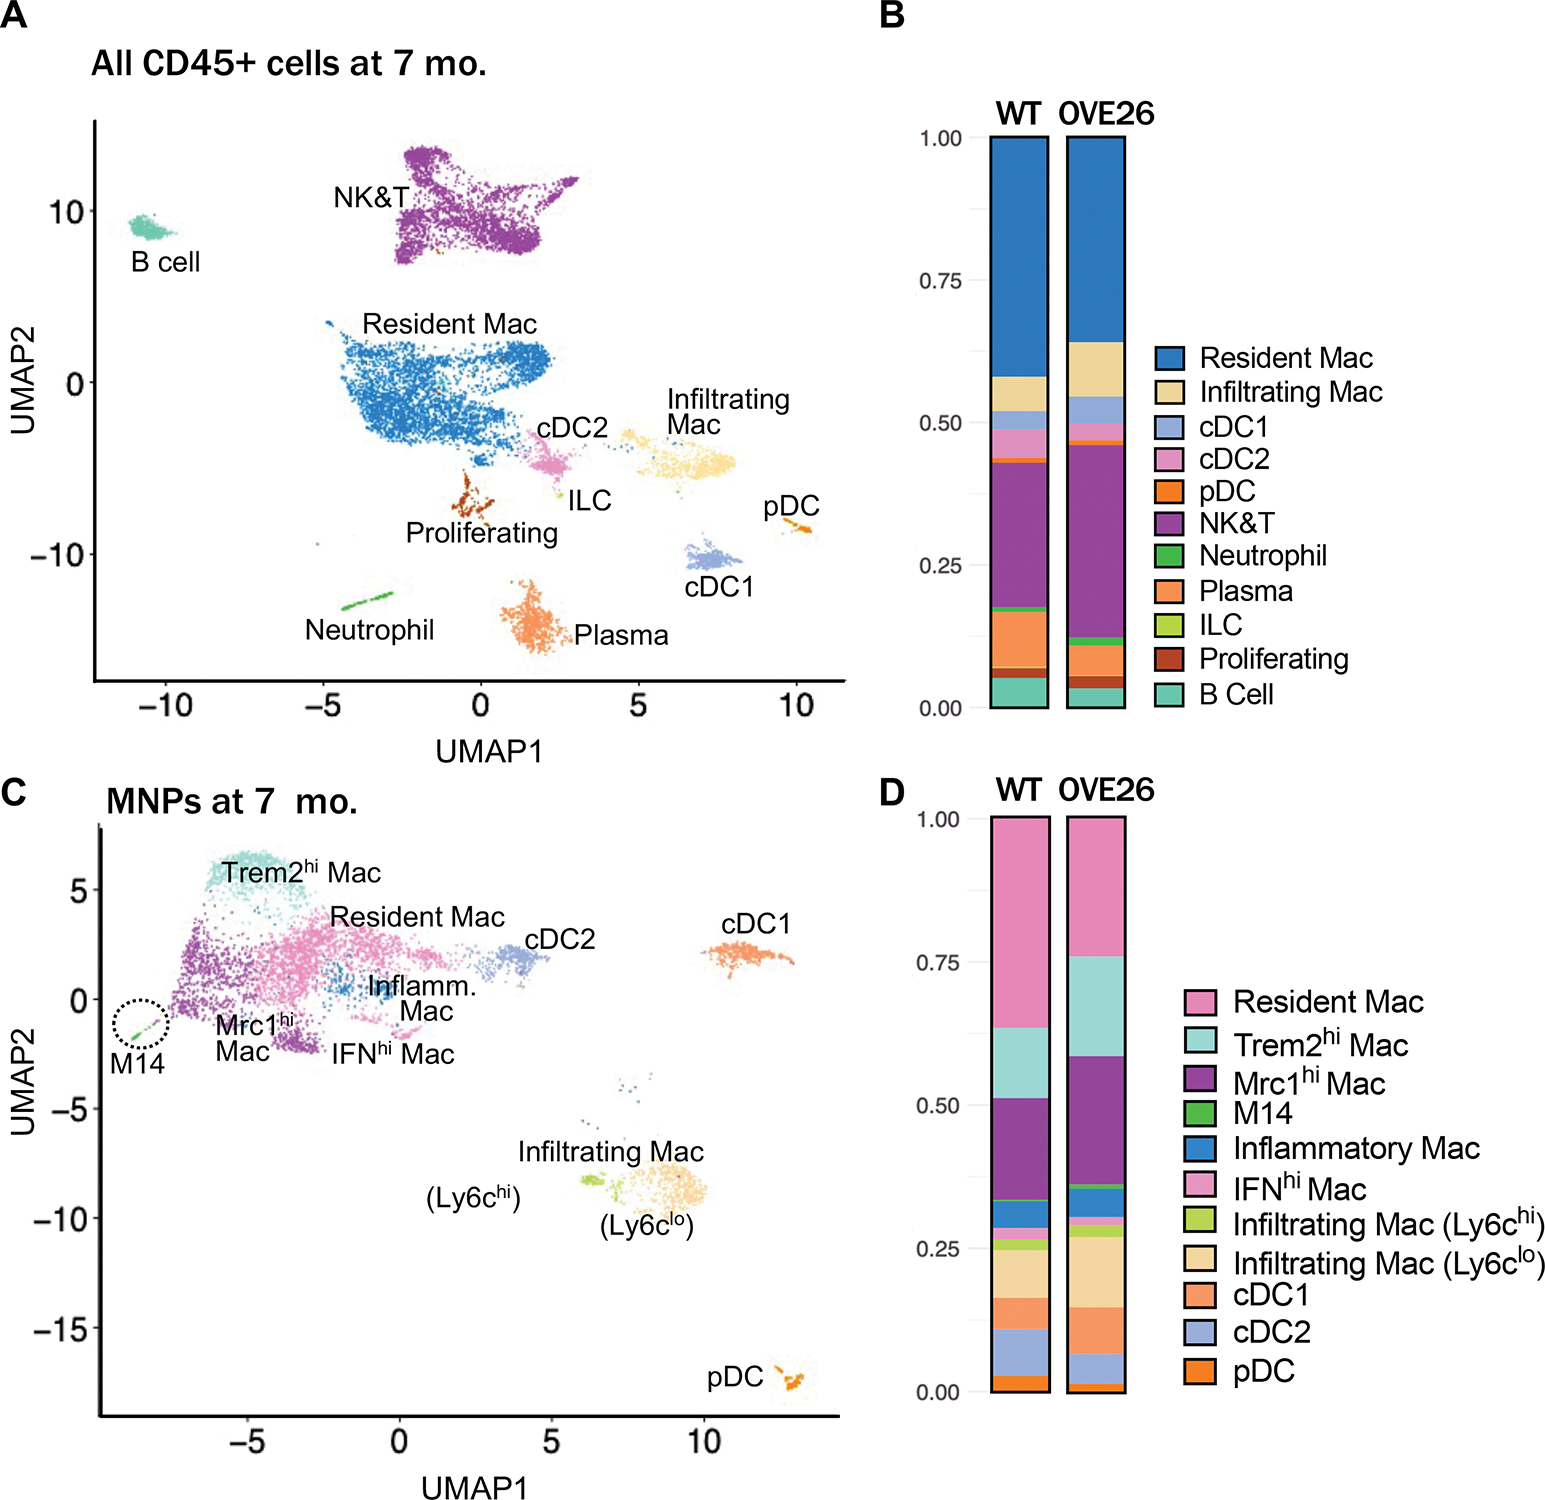
(A) Uniform manifold approximation and projection (UMAP) of CD45+ cells from 7-month-old WT and OVE26 mouse kidneys. (B) Proportions of CD45+ immune cell subtypes in 7-month-old WT and OVE26 kidneys are shown as a bar graph. (D) UMAP plot of MNPs from 7-month-old WT and OVE26 mouse kidneys. (E) Proportions of each MNP subclusters in 7-month-old WT and OVE26 kidneys. DC, dentritic cell; Mac, macrophage; cDC, conventional DC; pDC, plasmacytoid DC; ILCs, innate lymphoid cells; NK&T, natural killer and T cells; IFNhi, interferon (IFN)-induced gene expression-high; Mrc1hi, Mannose receptor C-type 1 expression-high; Trem2hi, triggered receptor expressed on myeloid cells 2 expression-high.
scRNAseq analysis reveals transcriptional heterogeneity in macrophage subsets in early DKD
To further define the molecular features associated with DKD progression in macrophages, we next examined the differentially expressed genes (DEGs) in each macrophage subset in OVE26 mice at both 3 and 7 months of age in comparison to their respective non-diabetic controls (Figure 3A–B, Supp. Excel File 1c–d). Notably, DEGs in macrophages from kidneys of 3-month OVE26 mice consisted of both upregulated and downregulated genes, while those of 7-month OVE26 mice were largely restricted to upregulated genes, demonstrating a dynamic shift in gene expression pattern with DKD progression. As to be expected, many gene expression changes in macrophages in the diabetic kidney were consistent across all macrophage subsets (‘Shared DEGs’), and a smaller set of genes changed in a subset-specific manner (‘Unique DEGs’). Accordingly, the gene ontology (GO) enrichment analysis showed shared pathways across the macrophage subsets, as well as those that were subset-specific (Figure 3C–D, Supp. Excel File 1e–h). In the 3-month OVE26 mice, the shared pathways were largely related to protein translation, oxidative phosphorylation, and myeloid cell differentiation (Figure 3C). GO pathway analysis indicated that the gene expression alteration in 7-month OVE26 macrophages largely consisted of enhanced inflammation, cellular stress response, and apoptotic signaling pathways that were shared broadly among macrophage subsets (Figure 3D). To further explore the transcriptional change occurring in specific macrophage subsets in DKD development, we analyzed DEGs that were specifically altered in each macrophage subset in the OVE26 mouse kidneys (shown as ‘Unique DEGs’ in Figure 3A–B) and their associated GO terms. The largest number of unique DEGs were found in IFNhi and Infiltrating Macs in 3-month-old OVE26 mouse kidneys, many of which were downregulated genes; the largest number of unique DEGs in 7-month-old OVE26 mice were observed in the Inflammatory and Infiltrating Ly6clo Macs, almost all of which were upregulated genes (Figure 3A–B, Supp. Excel File 1c–d). A full list pathway analysis for individual macrophage subsets is provided in Supp. Excel File 1g–h (subsets with fewer DEGs were excluded from the analysis). Examples of GO pathways specific to individual macrophage subsets in 3-month-old OVE26 kidneys include DNA damage response and p38MAPK cascade regulation in IFNhi Macs; cellular senescence and IFN-γ processes in Inflammatory Macs; epidermal growth factor receptor (EGFR) and Rac protein signal transduction in Mcr1hi Macs; regulation of cell proliferation, glycolysis, and Notch receptor processing in Trem2hi Macs; fatty acid metabolic process and IL-12 response regulation in Infiltrating Macs. Examples of GO pathways specific to individual macrophage subsets in 7-month-old OVE26 kidneys include the peroxisome proliferator-activated receptor (PPAR) signaling and ciliary docking regulation in Inflammatory Macs; endoplasmic reticulum (ER) unfolded protein response and ATP metabolic process regulation in Mrc1hi Macs; response to hypoxia, negative regulation of JNK cascade and anoikis in Trem2hi Macs; and Iκ-B/NF-κB signaling and prostaglandin E response regulation in Ly6clo infiltrating Macs.
Figure 3. Gene expression and gene ontological pathways altered in MNPs of diabetic kidneys.
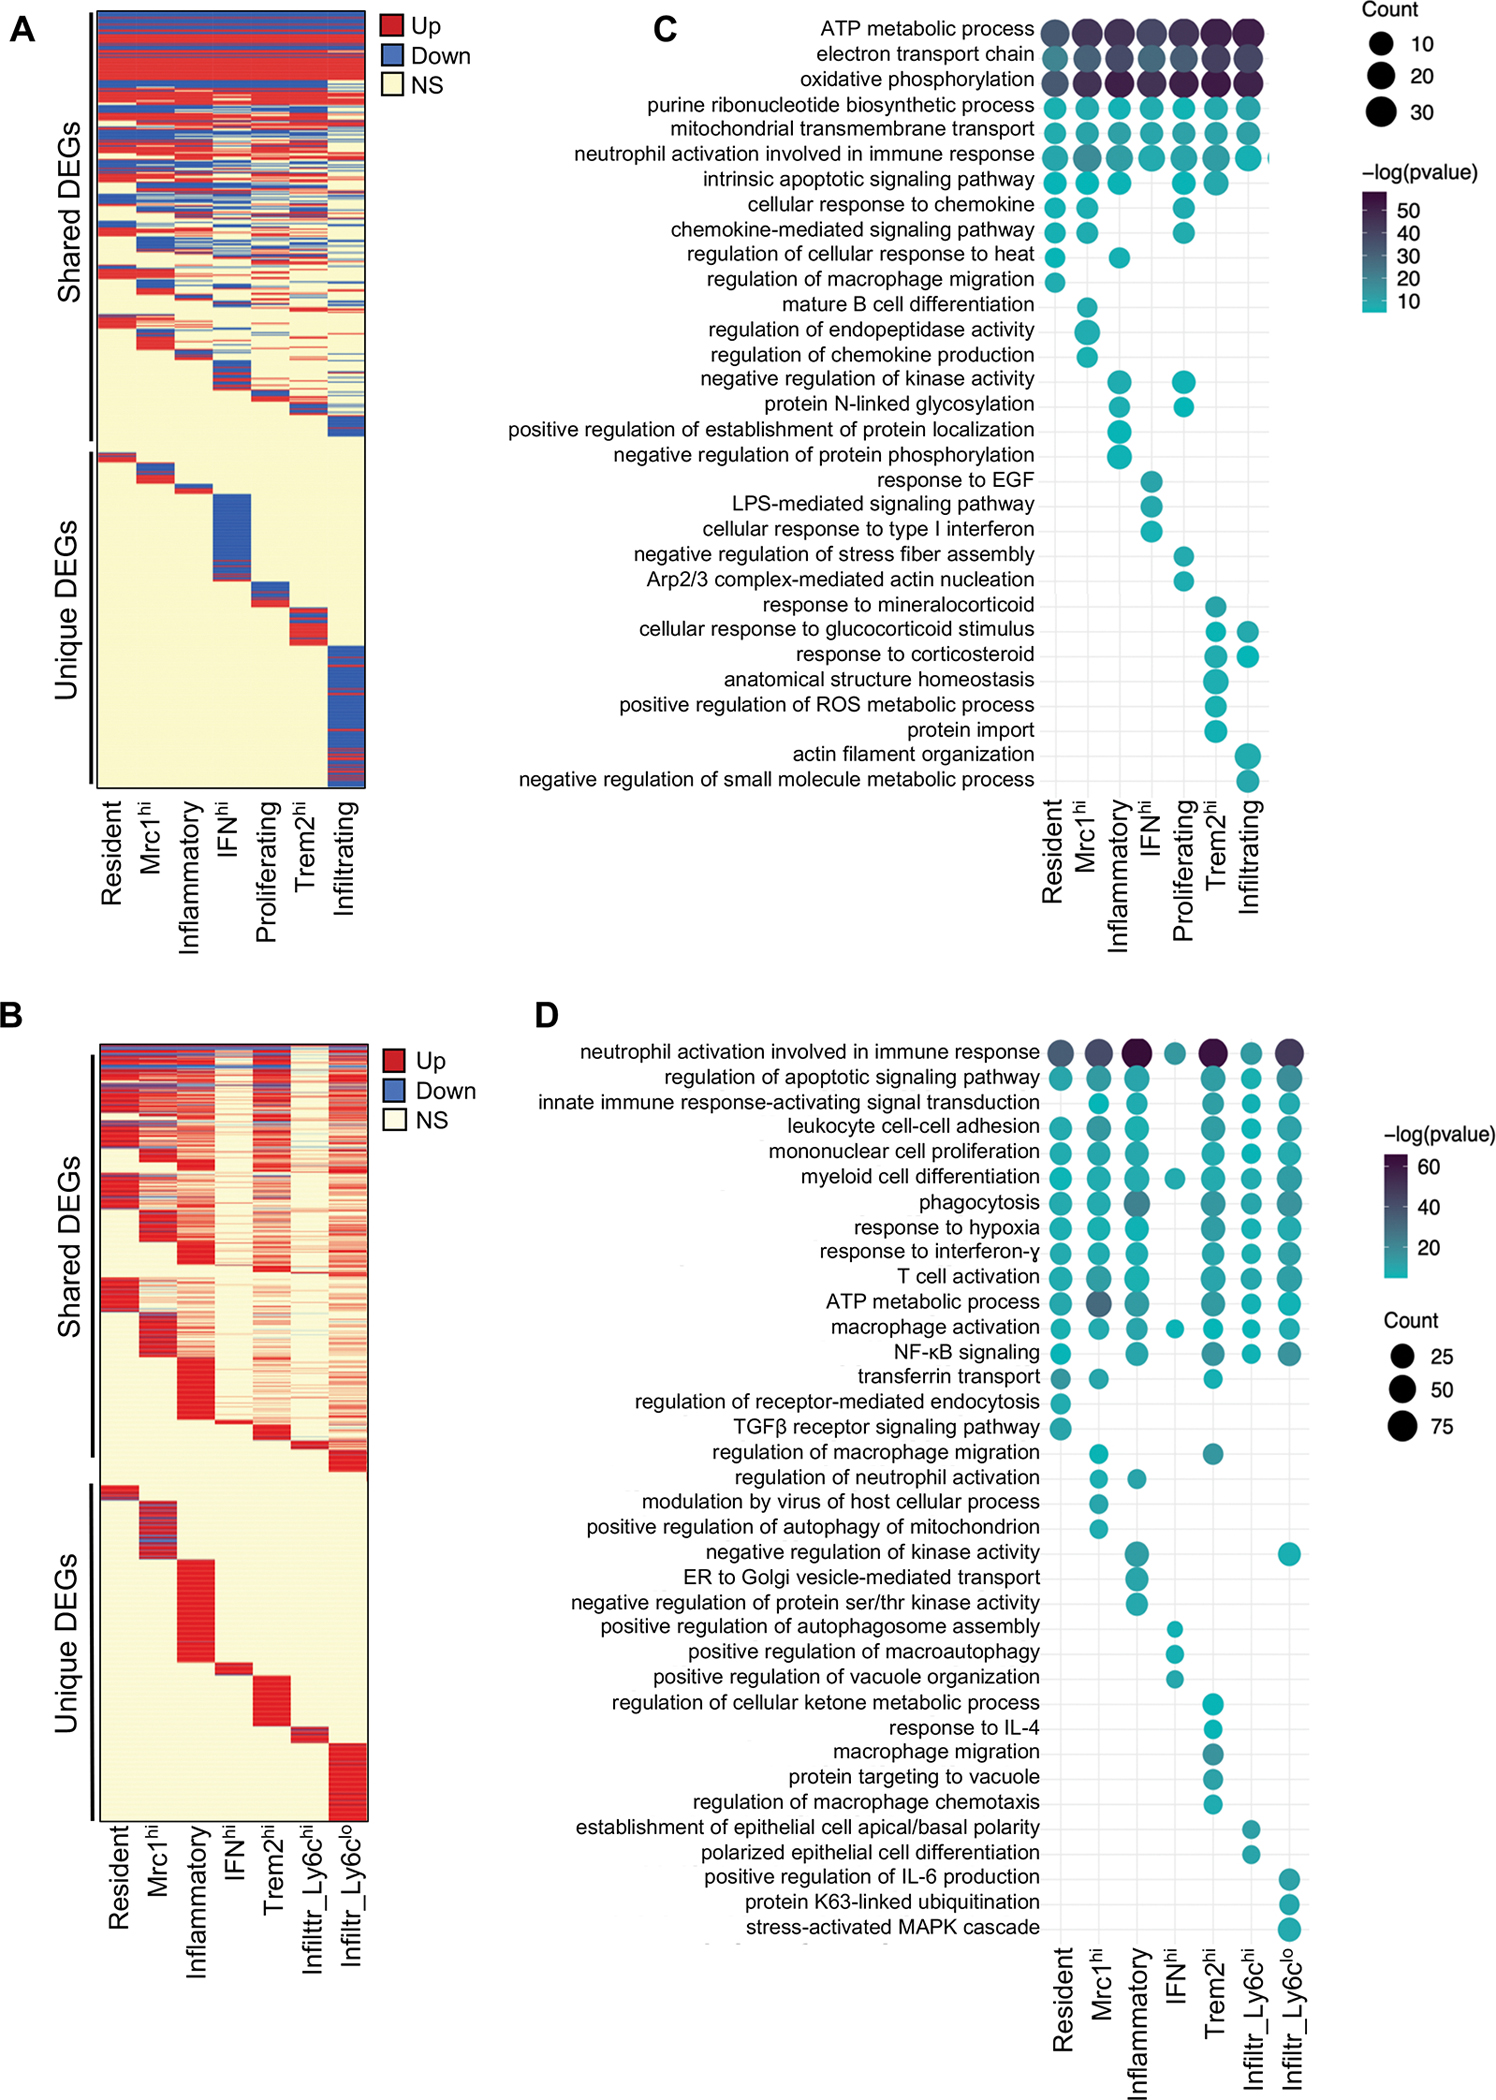
(A) Heatmap representation of differentially expressed genes (DEGs) in MNPs of OVE26 mice at 3 months of age [P value≤0.01, log(fold change) ≤−0.25 or ≥0.25]. Each line corresponds to a gene, where red corresponds to upregulated gene in OVE26, blue in downregulated gene in OVE26, and yellow to a statistically insignificant change between WT and OVE26. (B) Representative gene ontology (GO) enrichment analysis of differentially expressed genes in OVE26 (3 months old) versus control MNPs. (C) Heatmap representation of differentially expressed genes (DEGs) in MNPs of OVE26 mice at 7 months of age [P value≤0.01, log(fold change) ≤−0.25 or ≥0.25]. (D) Representative GO enrichment analysis of differentially expressed genes in OVE26 (7 months old) versus control MNPs. Full list of DEGs and GO terms are provided in Supp. Excel File 1.
We next performed a pseudo-temporal reconstruction of macrophages from WT and OVE26 kidneys using Monocle 2. We chose to utilize the dataset from OVE26 mice at 7 months of age and WT control for this analysis since DKD is more pronounced at this point than at 3 months of age. Two trajectories were observed that bifurcated at branch node 4 (Figure 4A), where WT macrophages were found predominantly found along the trajectory between the starting root and Fate 1, and macrophages from OVE26 were found predominantly along the Fate 2 (Figure 4B). Interestingly, the cells along the two trajectories had an increased relative M1-M2 score than the cells at the root, but a significantly higher M1-M2 score was observed in Fate 2 than in Fate 1 cells (Figure 4C–D). Figure 4E shows examples of genes that are highly expressed in Fate 2 cells (e.g., Apoe, Ctsb, and Stab1) and in Fate 1 cells (e.g., Tgfbr1, Cx3cr1).
Figure 4. Pseudo-time trajectory of macrophages between control and diabetic mice.
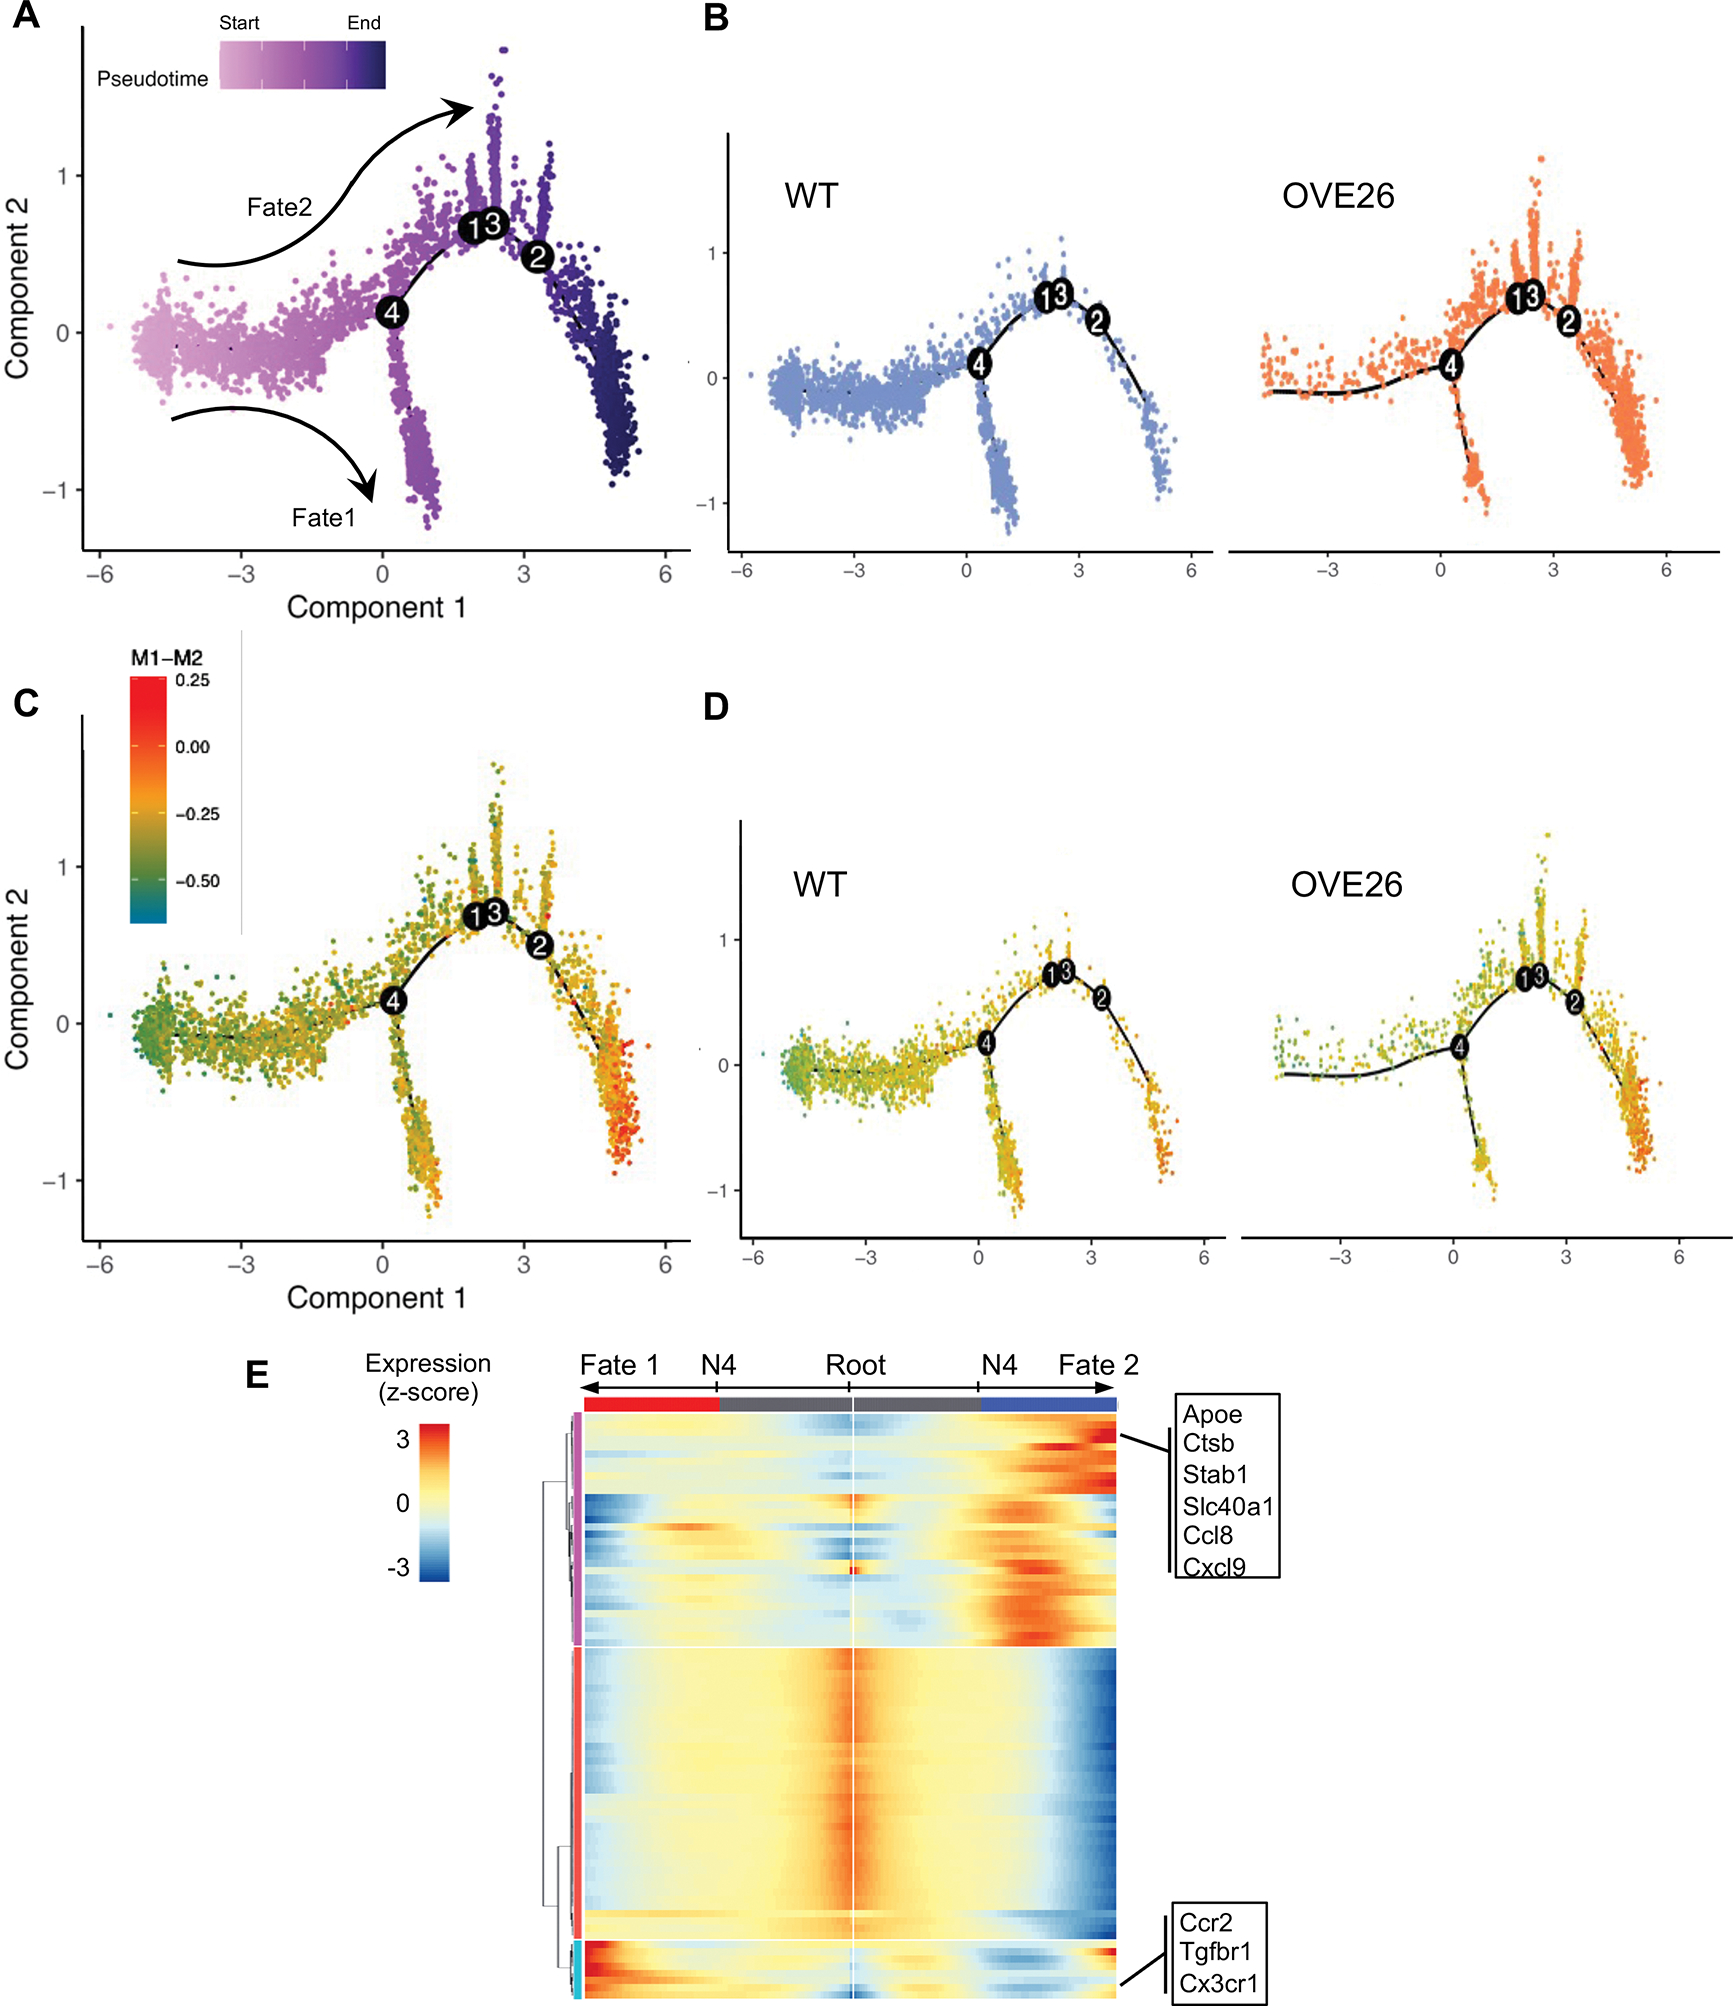
(A) Cell trajectory tree colored by pseudo-time for all macrophages in 7-month-old WT and OVE26 kidneys identified two main cell fates, separated from branch node 4. (B) Cell trajectory tree separated by experimental groups. (C) Cell trajectory showing the relative M1-M2 score for all macrophages. (D) Cell trajectory showing the relative M1-M2 score for WT and OVE26 macrophages. (E) Heatmap of genes that are differentially expressed along the branches separated by node 4.
scRNAseq analysis reveals the dynamic transition in macrophage activation in the diabetic kidney
Rather than having discrete M1 or M2 phenotypes, increasing evidence points to a more dynamic and continuous spectrum of macrophage polarization phenotypes, particularly as observed from recent single-cell studies in various tissue contexts 46–49. Therefore, to better characterize the macrophage activation status in early DKD, we utilized a single-cell transcriptome-based annotation tool MacSpectrum 50. MacSpectrum infers the macrophage activation status by estimating two indices, macrophage polarization index (MPI), to annotate the degree of inflammation, and activation-induced macrophage differentiation index (AMDI), to annotate the degree of terminal maturation (Figure 5A). With this approach, the macrophages from control and diabetic kidneys were mapped onto the MacSpectrum plot as “M1-like”, “M2-like”, “transitional”, and “pre-activation” phenotypes. Figure 5B shows the MacSpectrum plot of the total macrophage population in the kidneys of 3- and 7-months old WT and OVE26 mice. Rather than being a predominant and discrete phenotype, WT kidney macrophages at both age groups were generally evenly distributed among the 4 phenotypes with a slightly greater proportion of M2-like phenotype, and similar proportions of M1-like, transition M1-like, and pre-activation macrophage phenotypes (Figure 5B). But macrophages of 3-month-old OVE26 mice showed a small shift toward a transitional M1-like phenotype (i.e., higher MPI) and less differentiated state (i.e., lower AMDI) in comparison to control macrophages (Figure 5B). This shift was more obvious in 7-month-old OVE26 macrophages, such that the proportion of M2-like macrophages was reduced (3.8% in OVE26 mice versus 30.1% in WT), while transitional M1-like macrophages were substantially increased (65.3% in OVE26 mice versus 24.0% in WT) (Figure 5B). A closer examination of each of the macrophage subsets showed similar trends in almost all subsets with differing degrees (Figure 5C, Suppl. Figure 10). These results are consistent with a continuum of macrophage activation, characterized by enhanced inflammatory and less differentiated status in DKD progression.
Figure 5. MacSpectrum characterization of macrophage activation in the diabetic kidney.
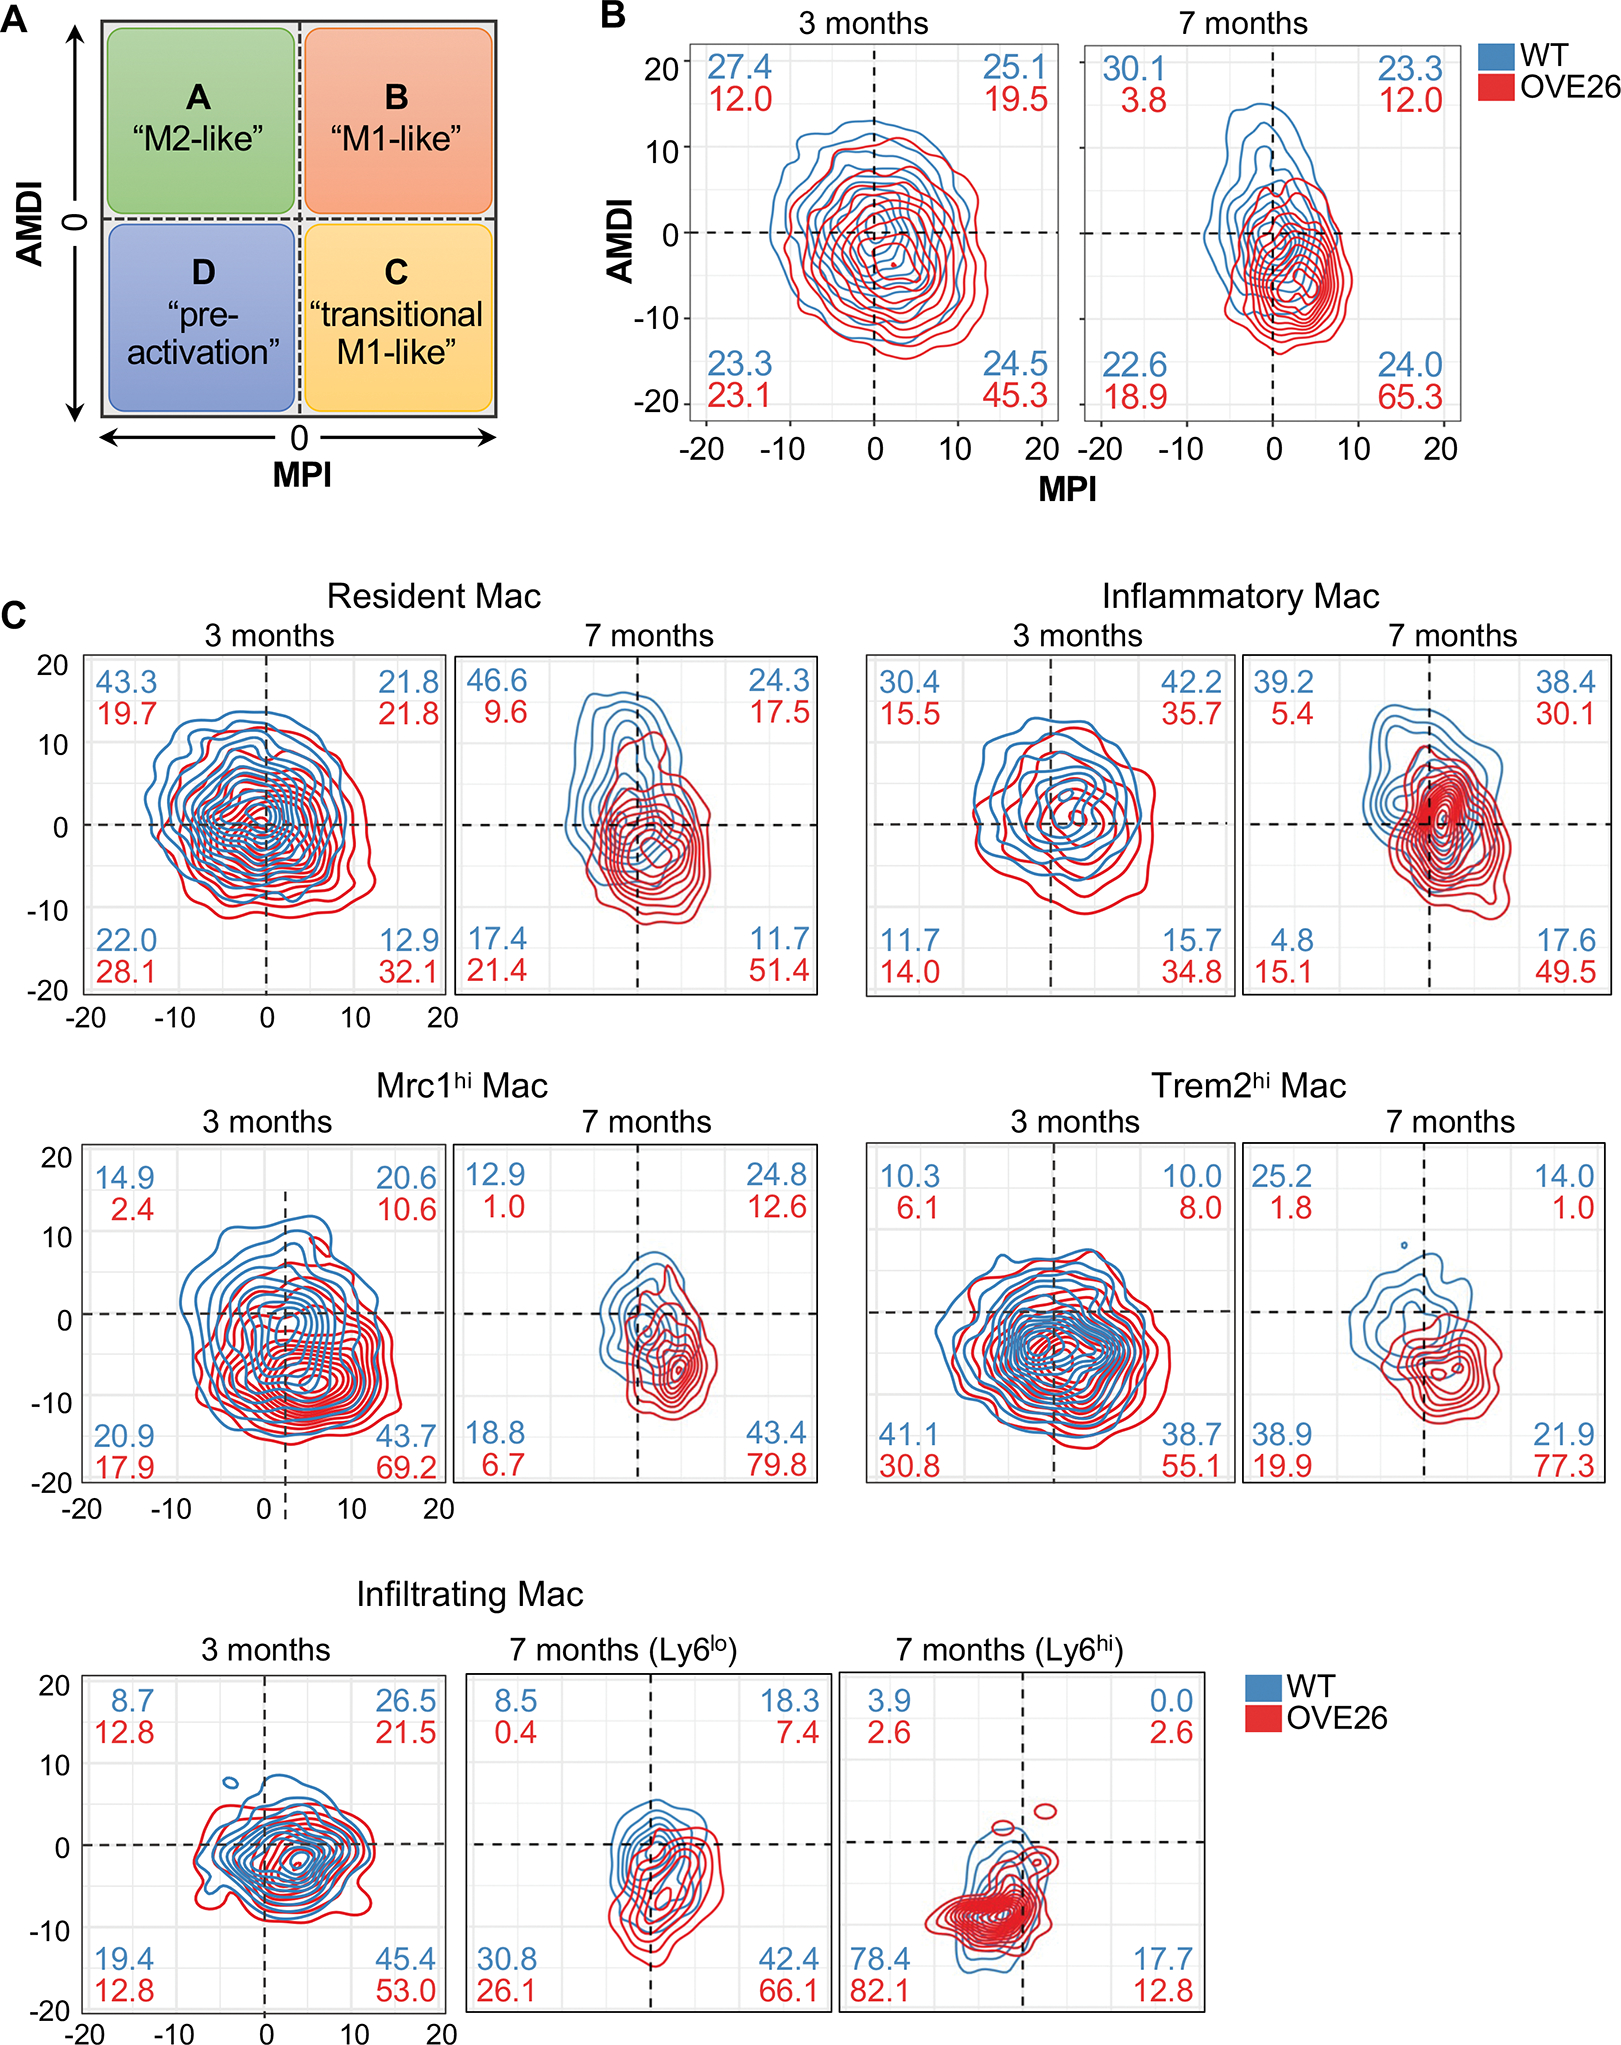
(A) Schematics showing the four designations of macrophages by MacSpectrum (adapted from Li C. et al., 2019). (B-C) Contour plot of all macrophages (B) and select subsets (C) in WT and OVE26 kidneys with AMDI and MPI. Percentages of macrophages in each subpopulation are shown in each quadrant for WT (blue) and OVE26 (red) macrophages.
Specific macrophage subsets and genes are increased in human diabetic kidneys
To corroborate some of the above findings of OVE26 macrophages in human DKD, we leveraged our recently reported bulk transcriptomic dataset from human kidney biopsy samples of patients with type 2 diabetes 51. Using the current scRNAseq dataset as the reference, we deconvolved the genes from the human kidney biopsy and identified specific cell types (n=22 advanced DKD, n=12 control samples). To account for the non-immune kidney cells in the bulk RNA sequencing data, we also included markers for proximal tubules and endothelial cells (Supp. Figure 11 and Supp. Methods). The proximal tubules comprised the most abundant cell type in the bulk kidney samples (51.4± 21.3%), followed by the macrophages (19.8±12.4%) and the endothelial cells (19.2±6.9%) (Figure 6A), which is similar to the proportions of kidney cell compositions in recent reports 9, 52. Among the MNPs, the resident macrophage (14.7±8.7%), infiltrating macrophage (5.1±4.2%), and cDC1 (5.4 ± 0.8%) were the most abundant (Figure 6A). It should be noted that because the deconvolution approach is limited to ascribing cell types with strong and/or unique markers, it is likely that some of the macrophage subsets characterized in the mouse kidneys (e.g., Mrc1hi and Trem2hi macrophage subsets) are likely included within the overall resident macrophage population in the deconvolved human kidney dataset, as they share many of the resident macrophage markers.
Figure 6. MNP evaluation in human DKD with deconvolution of bulk RNA-seq dataset.
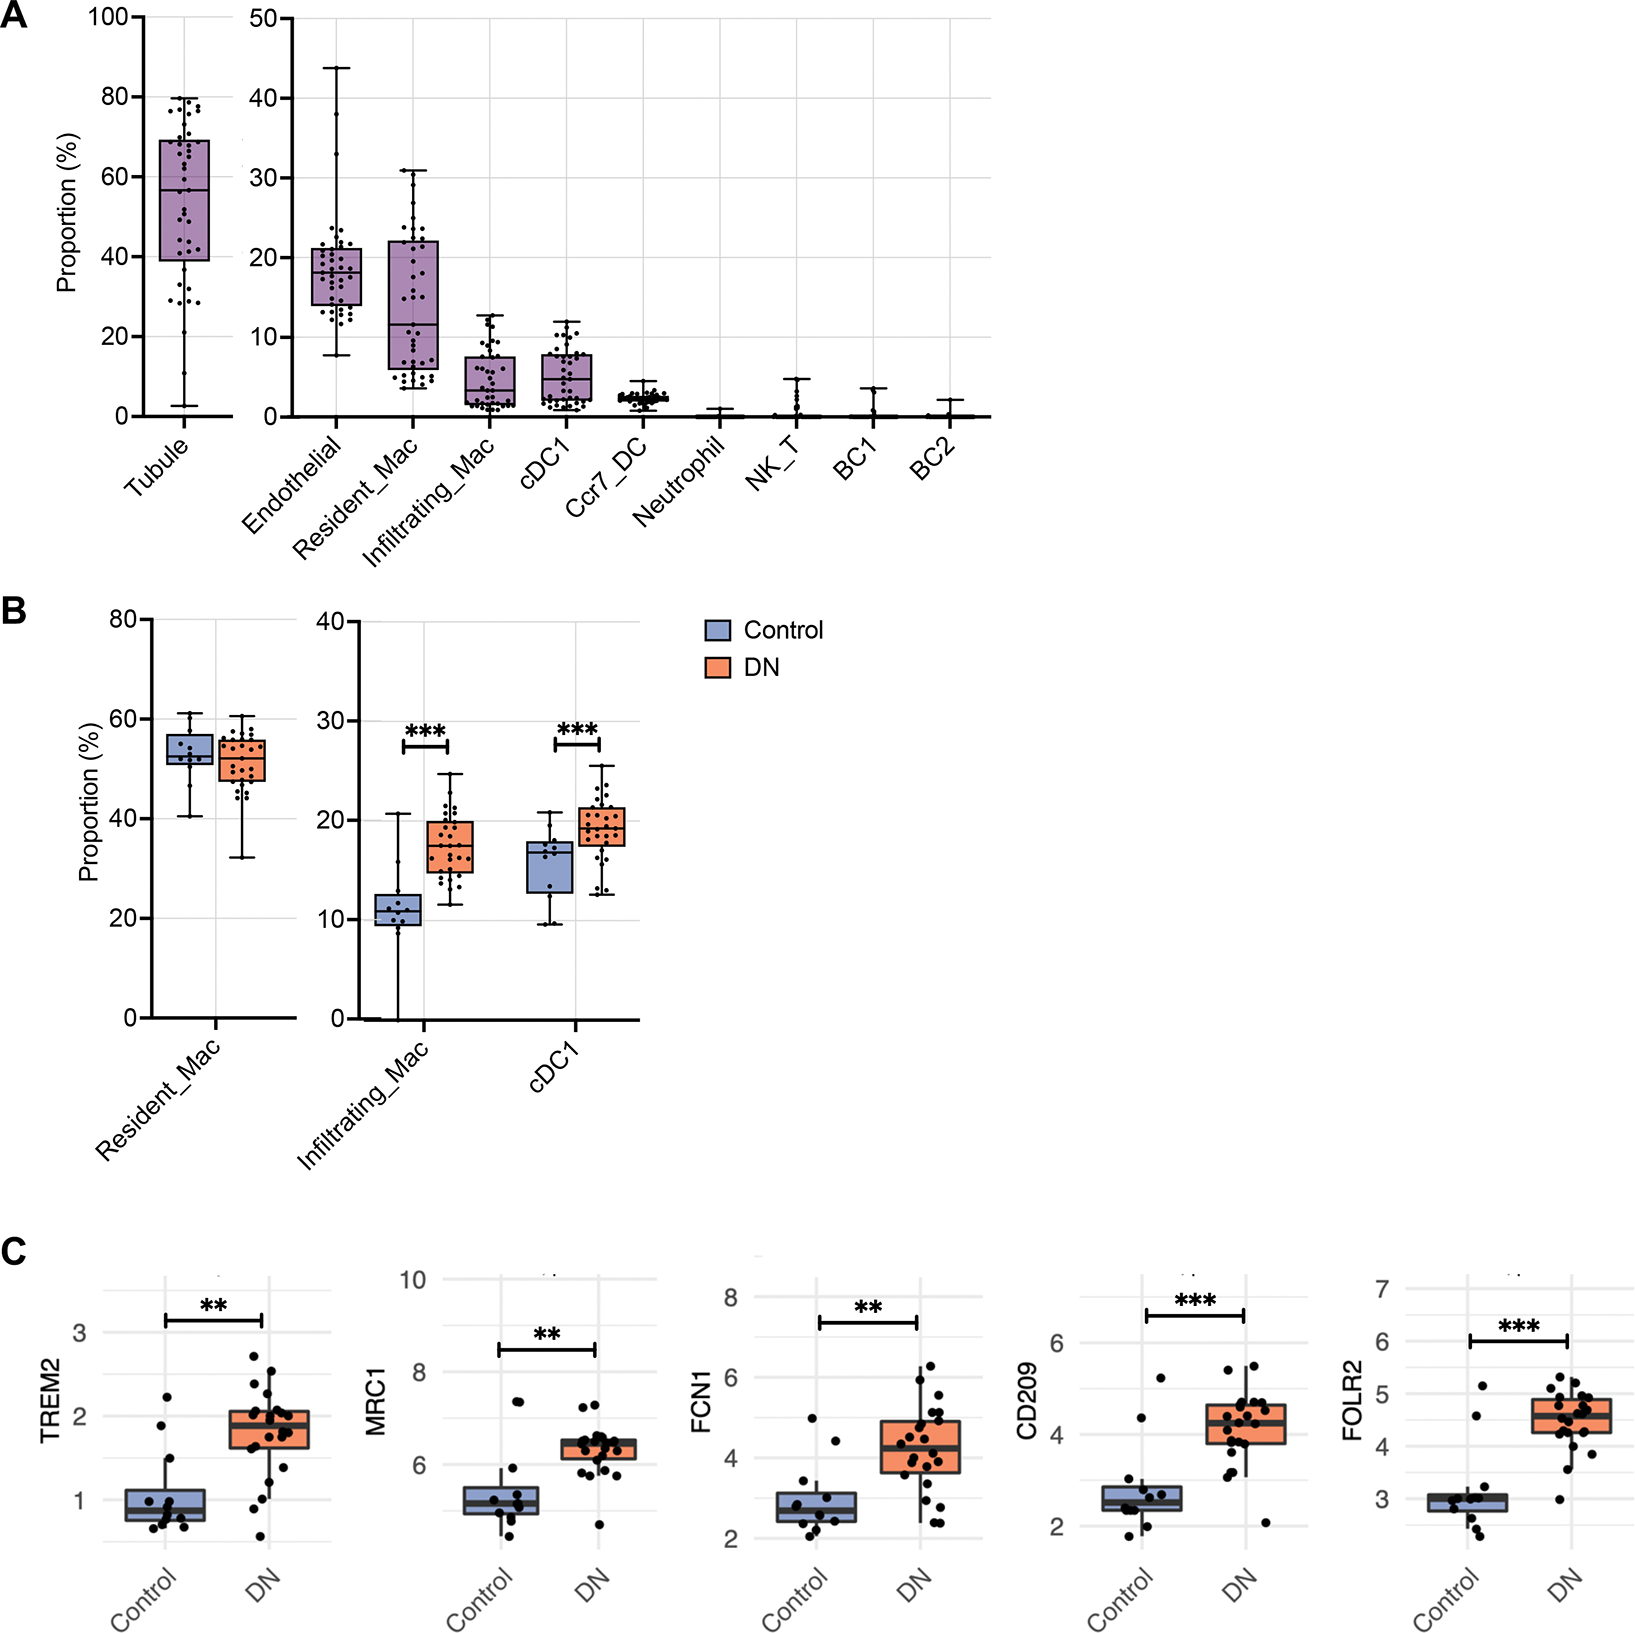
(A) Box plot showing the putative proportion of each cell type relative to total kidney cells in deconvolved bulk RNA-seq samples from Fan et al. 2019 (n=12 nephrectomy controls, n=22 DKD samples). (B) Comparison of the putative proportion of MNPs relative to total immune cells in DKD and control samples. (C) Gene expression (log2 (Count per Million + 1)) of markers of each cell type between DKD and control samples. *P<0.05, **P<0.01, and ***P<0.0001 between groups by Wilcoxon rank sum test.
Consistent with the mouse dataset, the proportions of the more abundant MNPs relative to the total immune cell did not show a change in the resident macrophages (51.2±7.4% control vs. 51.3±5.9% DN), but an increase in the infiltrating macrophages (10.5±4.1% control vs. 17.5±3.2% DN) and cDC1 (15.1±3.4% control vs. 19.2±3.2% DN) (Figure 6B). Consistent with an increased proportion of Trem2hi and Mrc1hi infiltrating macrophage subsets in OVE26 kidneys, we also observed an increase in the expression of TREM2 and MRC1 in human DKD biopsy samples (Figure 6C). We also observed an elevated expression of FCN1, CD209, and FOLR2 that was consistent with the increased proportion of M14 Mrc1hi-like macrophages in 7-month-old OVE26 kidneys. (Figure 6C).
We further validated the increased MRC1+, TREM2+, and S100A4+ infiltrating macrophages in human diabetic kidneys by immunostaining. We utilized formalin-fixed paraffin-embedded biopsy sections of established DKD and minimal change disease (MCD) (Supplemental Table 2 shows the clinical characteristics). Increased TREM2+ macrophages were observed in both glomerular and tubulointerstitial areas in human DKD samples, while increased MRC1+ macrophages were found mainly in the tubulointerstitium (Figure 7A–B). An increased number of S100A4+ infiltrating macrophages were also found in the glomerular and tubulointerstitial areas of DKD samples in comparison to MCD controls. Together, with the deconvolution dataset, these results corroborate an increase in specific macrophage subsets in DKD. Moreover, the scRNAseq of OVE26 provides comprehensive macrophage transcriptomic profiles in early DKD and highlights the dynamic shift in macrophage activation in the early disease progression.
Figure 7. Increased select macrophage subsets in human DKD.
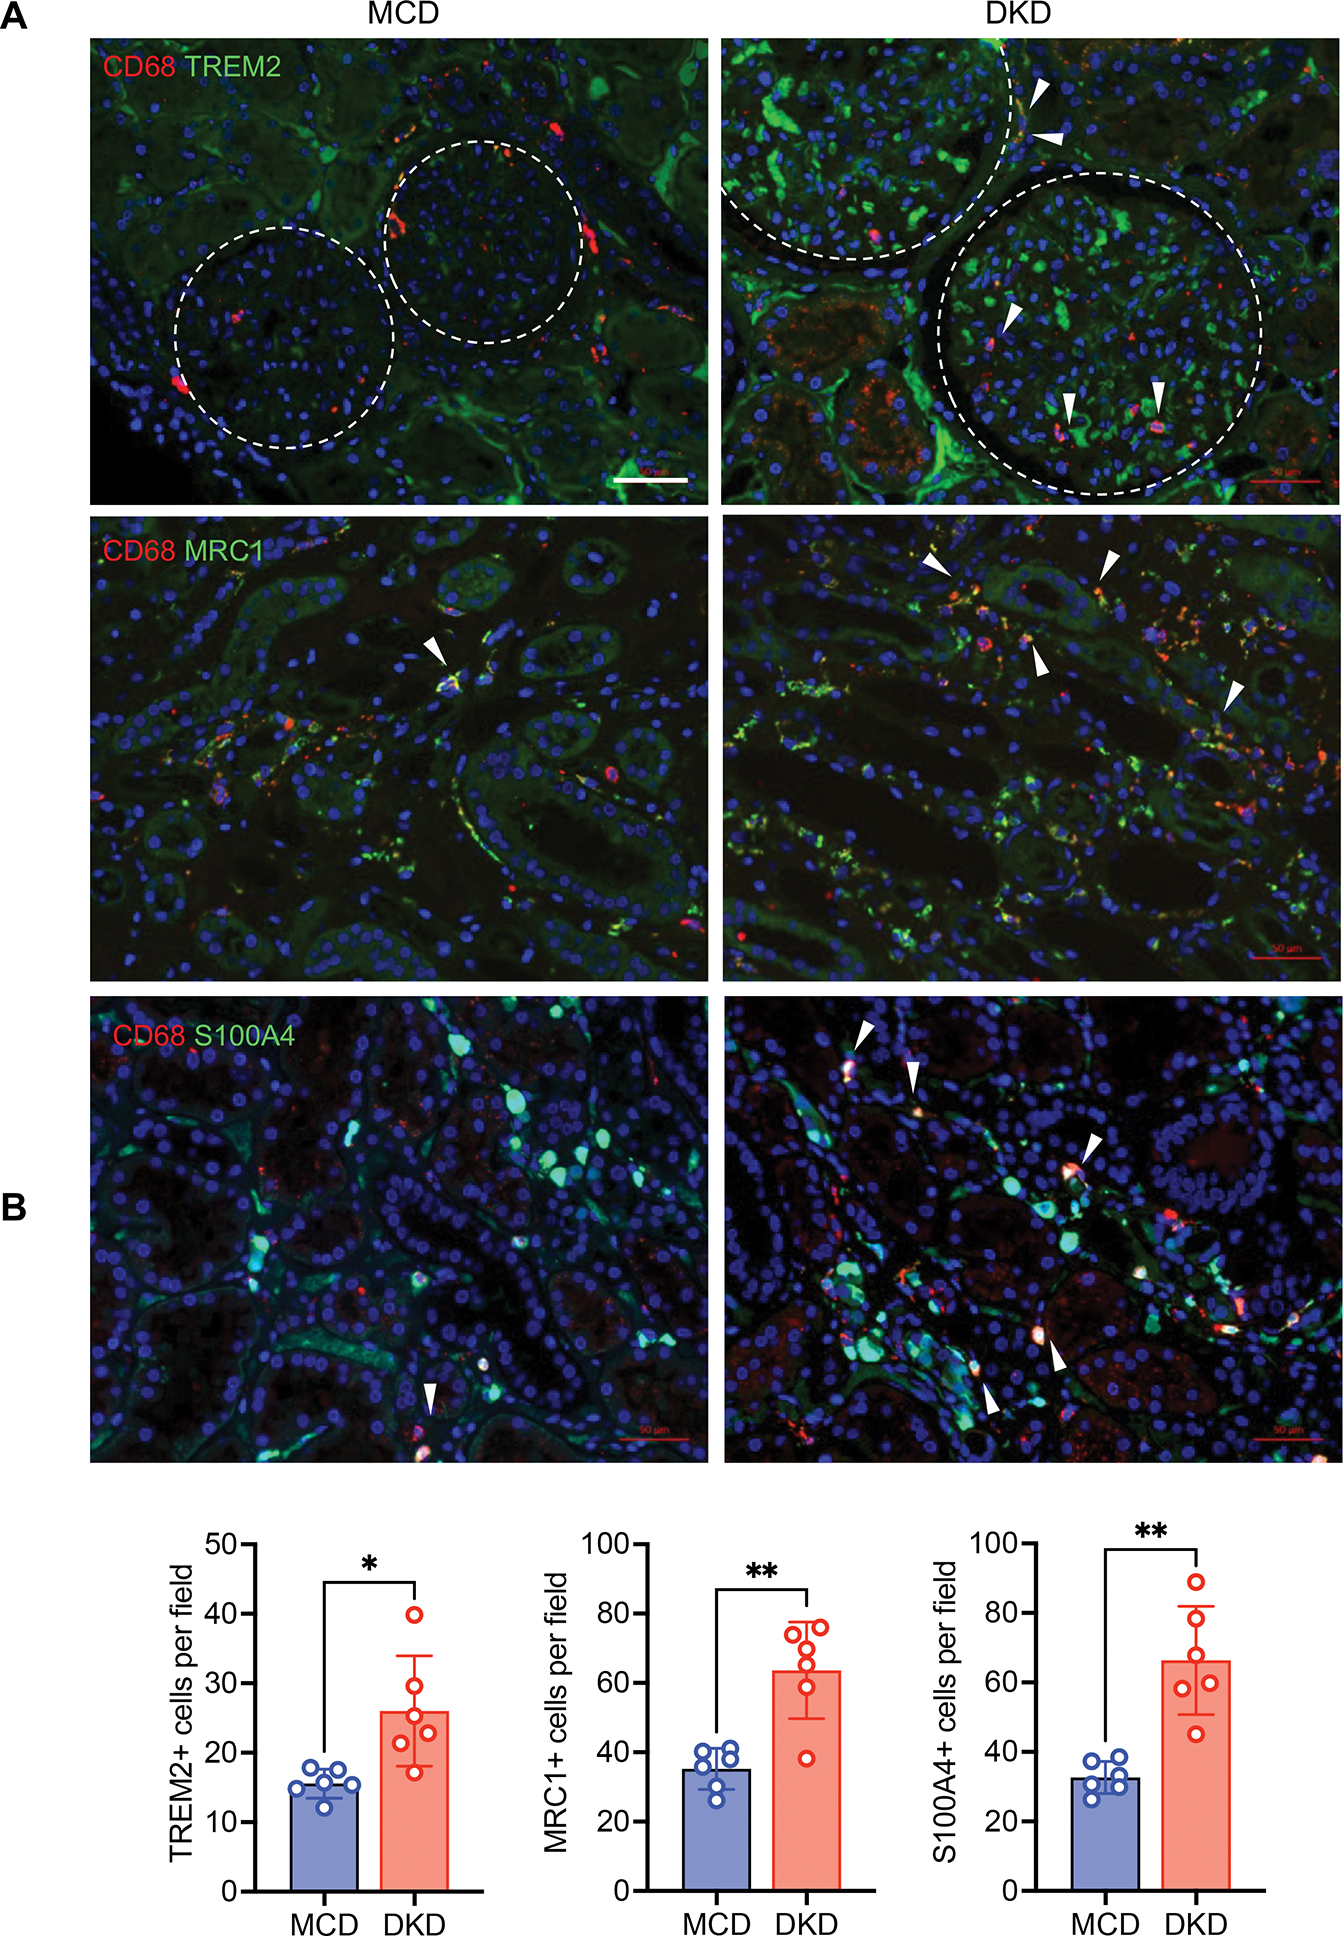
(A) Representative immunofluorescence images of TREM2, MRC1, and S100A4 in biopsy samples of DKD and minimal change disease (MCD) (n=6 DKD and 6 MCD samples). Macrophages are co-immunostained with CD68 and DNA is counterstained with DAPI. Arrows indicate double positive staining macrophages. Arrows show examples of double-positive stained macrophages. Dotted line circle glomerulus boundaries. Scale bars, 50μM. (B) Quantification of immunostaining for MRC1, TREM2, or S100A4 per field (n=6 samples per group, 5–8 fields scored per sample). ***P <0.001 between groups by Welch’s t-test.
DISCUSSION
Emerging evidence supports a key role of immune cells and inflammation in the pathogenesis of DKD. Studies have demonstrated that macrophage accumulation in the diabetic kidneys correlates strongly with disease progression 4, 53, and experimental studies with macrophage depletion or inhibition of macrophage activation have demonstrated the pathogenic role of macrophage activation in DKD progression 54,55. Moreover, these earlier studies in mouse models have demonstrated the predominance of inflammatory M1 macrophages and their involvement in enhancing kidney injury in the diabetic setting 56, 57. In contrast, the adoptive transfer of M2 macrophages or agents that promote M2 polarization had opposing anti-inflammatory and reparative roles and attenuated kidney damage in diabetic mice 58, 59. Since many studies have typically relied on select M1 or M2 markers to distinguish the two opposing subtypes, it is possible that macrophages with intermediary M1/M2 phenotypes may not have been discernable in some of the earlier findings to ascertain their potential role in disease settings. In the present study, we have taken an unbiased approach to the characterization of gene expression changes in immune cells in early DKD by scRNAseq of CD45+ immune cells from control and diabetic mouse kidneys. We generated nearly 17,000 single-cell transcriptomes from control and diabetic mice, which allowed a high-resolution mapping of all major immune cell types with an additional detailed analysis of MNP subsets. Consistent with early DKD, we did not observe a remarkable shift in the overall proportion of immune cell subtypes in the diabetic kidneys in comparison to the control kidneys. Nevertheless, there were notable increases in the proportions of specific MNP subsets in the diabetic kidneys: We observed an increase in the infiltrating macrophages; inflammatory and high-interferon signature macrophages, subsets with high inflammatory gene expression signatures; macrophage subsets with high expression of MRC1 or TREM2 that are involved in attenuation of macrophage activation; and activated dendritic cell subtypes in the diabetic kidney, suggesting that both pro-inflammatory and anti-inflammatory MNP subtypes are increased in response to the diabetic milieu. We also observed a significant shift in gene expression profiles within specific MNP subsets in the diabetic kidney. How these alterations in gene expression in a specific MNP subset contribute to DKD pathogenesis and whether they may be manipulated to attenuate disease pathogenesis requires further in-depth study.
While macrophages can adopt a range of phenotypes in response to their local environment, they are widely described in two opposing functional states as classically activated, proinflammatory (M1), or alternatively-activated, anti-inflammatory (M2) phenotype. In the context of kidney injury and disease, M1 macrophages are regarded to be deleterious and M2 macrophages to facilitate recovery 55, 60, 61. In line with this view, our previous scRNA-seq study of isolated glomerular cells showed an increased proportion of M1 macrophages in diabetic mice than in control mice 11. To gain further insights into the functional consequence of the alteration in gene expression in macrophage subsets, we further examined their polarization and maturation states using MacSpectrum analysis. Overall, the gene expression in macrophage subsets tended to shift toward more inflammatory and less differentiated phenotypes in the diabetic kidney in comparison to the control kidney, although the degree varied among the macrophage subsets. For instance, as IFNhi Mac and Inflammatory Mac subsets were initially annotated by the expression of specific inflammatory genes, it is not surprising that there was not a significant shift toward the inflammatory state in the diabetic kidneys. However, in other subsets, such as Proliferating Mac, Mrc1hi Mac, and Trem2hi Mac, we observed a noticeable shift toward M1-like and M1-like transitional states. Interestingly, the pseudo-temporal ordering of macrophages showed a smooth transition from control to diabetic macrophages with two distinct fates in the OVE26 kidney macrophages, M1-like cell fate and second cell fate with a mixture of M2 and intermediate M1-M2 phenotypes. These results corroborate the hypothesis that macrophage polarization is a continuous process in the diabetic kidney with an increased transition toward an M1-like phenotype, but also with many macrophages in the intermediary stages of polarization and differentiation. Our present study provides a comprehensive view of transcriptomic heterogeneity in kidney immune cells in response to diabetic kidney injury, and the information for specific immune cell subsets provided here can serve as a basis to further delineate their function and contribution to DKD pathogenesis for therapeutic targeting.
Supplementary Material
TRANSLATIONAL STATEMENT.
Diabetic kidney disease (DKD) is the leading cause of chronic kidney disease worldwide. Because of the complexities of disease pathogenesis, the current clinical management of glucose and blood pressure control regimens do not adequately stall the disease progression. Emerging evidence indicates that renal inflammation is an important contributor to DKD pathogenesis. The present study explores the gene expression changes in immune cells in the diabetic kidneys at a single-cell resolution. The results highlight the alterations in macrophage activation in the early DKD and their potential for disease pathogenesis.
Acknowledgments
JCH is supported by NIH/NIDDK R01DK109683, R01DK122980, R01DK129467, P01DK56492, and VA Merit Award I01BX000345; KL is supported by NIH/NIDDK R01DK117913-01 and R01DK129467. JF is supported by NIH/NIDDK K01DK125614-01A1.
Footnotes
Disclosures
The authors have declared that no conflict of interest exists.
Supplemental Material
Supplementary PDF File; Supplementary Excel File 1. Supplementary information is available on Kidney International’s website. An online visual tool for the dataset is available through https://zephyrsun.shinyapps.io/ove26.
Publisher's Disclaimer: This is a PDF file of an unedited manuscript that has been accepted for publication. As a service to our customers we are providing this early version of the manuscript. The manuscript will undergo copyediting, typesetting, and review of the resulting proof before it is published in its final form. Please note that during the production process errors may be discovered which could affect the content, and all legal disclaimers that apply to the journal pertain.
Data sharing statement
The data supporting the findings of this study are publicly available through the Gene Expression Omnibus repository (GSE195799).
REFERENCES
- 1.Levey AS, Coresh J. Chronic kidney disease. Lancet 2012; 379: 165–180. [DOI] [PubMed] [Google Scholar]
- 2.Forbes JM, Cooper ME. Mechanisms of diabetic complications. Physiol Rev 2013; 93: 137–188. [DOI] [PubMed] [Google Scholar]
- 3.Alicic RZ, Tuttle KR. Novel therapies for diabetic kidney disease. Advances in chronic kidney disease 2014; 21: 121–133. [DOI] [PubMed] [Google Scholar]
- 4.Nguyen D, Ping F, Mu W, et al. Macrophage accumulation in human progressive diabetic nephropathy. Nephrology (Carlton) 2006; 11: 226–231. [DOI] [PubMed] [Google Scholar]
- 5.Chow FY, Nikolic-Paterson DJ, Atkins RC, et al. Macrophages in streptozotocin-induced diabetic nephropathy: potential role in renal fibrosis. Nephrol Dial Transplant 2004; 19: 2987–2996. [DOI] [PubMed] [Google Scholar]
- 6.Moon JY, Jeong KH, Lee TW, et al. Aberrant recruitment and activation of T cells in diabetic nephropathy. Am J Nephrol 2012; 35: 164–174. [DOI] [PubMed] [Google Scholar]
- 7.Klessens CQF, Zandbergen M, Wolterbeek R, et al. Macrophages in diabetic nephropathy in patients with type 2 diabetes. Nephrol Dial Transplant 2017; 32: 1322–1329. [DOI] [PubMed] [Google Scholar]
- 8.Pichler R, Afkarian M, Dieter BP, et al. Immunity and inflammation in diabetic kidney disease: translating mechanisms to biomarkers and treatment targets. American journal of physiology Renal physiology 2017; 312: F716–F731. [DOI] [PMC free article] [PubMed] [Google Scholar]
- 9.Wilson PC, Wu H, Kirita Y, et al. The single-cell transcriptomic landscape of early human diabetic nephropathy. Proceedings of the National Academy of Sciences of the United States of America 2019; 116: 19619 – 19625. [DOI] [PMC free article] [PubMed] [Google Scholar]
- 10.Hasegawa G, Nakano K, Sawada M, et al. Possible role of tumor necrosis factor and interleukin-1 in the development of diabetic nephropathy. Kidney Int 1991; 40: 1007–1012. [DOI] [PubMed] [Google Scholar]
- 11.Coca SG, Nadkarni GN, Huang Y, et al. Plasma Biomarkers and Kidney Function Decline in Early and Established Diabetic Kidney Disease. J Am Soc Nephrol 2017; 28: 2786–2793. [DOI] [PMC free article] [PubMed] [Google Scholar]
- 12.Niewczas MA, Gohda T, Skupien J, et al. Circulating TNF receptors 1 and 2 predict ESRD in type 2 diabetes. J Am Soc Nephrol 2012; 23: 507–515. [DOI] [PMC free article] [PubMed] [Google Scholar]
- 13.Van JA, Scholey JW, Konvalinka A. Insights into Diabetic Kidney Disease Using Urinary Proteomics and Bioinformatics. J Am Soc Nephrol 2017; 28: 1050–1061. [DOI] [PMC free article] [PubMed] [Google Scholar]
- 14.Park J, Shrestha R, Qiu C, et al. Single-cell transcriptomics of the mouse kidney reveals potential cellular targets of kidney disease. Science 2018; 360: 758–763. [DOI] [PMC free article] [PubMed] [Google Scholar]
- 15.Wu H, Malone AF, Donnelly EL, et al. Single-Cell Transcriptomics of a Human Kidney Allograft Biopsy Specimen Defines a Diverse Inflammatory Response. J Am Soc Nephrol 2018; 29: 2069–2080. [DOI] [PMC free article] [PubMed] [Google Scholar]
- 16.Ransick A, Lindstrom NO, Liu J, et al. Single-Cell Profiling Reveals Sex, Lineage, and Regional Diversity in the Mouse Kidney. Dev Cell 2019; 51: 399–413 e397. [DOI] [PMC free article] [PubMed] [Google Scholar]
- 17.Kirita Y, Wu H, Uchimura K, et al. Cell profiling of mouse acute kidney injury reveals conserved cellular responses to injury. Proceedings of the National Academy of Sciences of the United States of America 2020; 117: 15874–15883. [DOI] [PMC free article] [PubMed] [Google Scholar]
- 18.Rudman-Melnick V, Adam M, Potter A, et al. Single-Cell Profiling of AKI in a Murine Model Reveals Novel Transcriptional Signatures, Profibrotic Phenotype, and Epithelial-to-Stromal Crosstalk. J Am Soc Nephrol 2020; 31: 2793–2814. [DOI] [PMC free article] [PubMed] [Google Scholar]
- 19.do Valle Duraes F, Lafont A, Beibel M, et al. Immune cell landscaping reveals a protective role for regulatory T cells during kidney injury and fibrosis. JCI Insight 2020; 5. [DOI] [PMC free article] [PubMed] [Google Scholar]
- 20.Chen L, Chou CL, Knepper MA. Targeted Single-Cell RNA-seq Identifies Minority Cell Types of Kidney Distal Nephron. J Am Soc Nephrol 2021. [DOI] [PMC free article] [PubMed] [Google Scholar]
- 21.Kuppe C, Ibrahim MM, Kranz J, et al. Decoding myofibroblast origins in human kidney fibrosis. Nature 2021; 589: 281–286. [DOI] [PMC free article] [PubMed] [Google Scholar]
- 22.Muto Y, Wilson PC, Ledru N, et al. Single cell transcriptional and chromatin accessibility profiling redefine cellular heterogeneity in the adult human kidney. Nat Commun 2021; 12: 2190. [DOI] [PMC free article] [PubMed] [Google Scholar]
- 23.Zimmerman KA, Bentley MR, Lever JM, et al. Single-Cell RNA Sequencing Identifies Candidate Renal Resident Macrophage Gene Expression Signatures across Species. J Am Soc Nephrol 2019; 30: 767–781. [DOI] [PMC free article] [PubMed] [Google Scholar]
- 24.Conway BR, O’Sullivan ED, Cairns C, et al. Kidney Single-Cell Atlas Reveals Myeloid Heterogeneity in Progression and Regression of Kidney Disease. J Am Soc Nephrol 2020; 31: 2833–2854. [DOI] [PMC free article] [PubMed] [Google Scholar]
- 25.Alpers CE, Hudkins KL. Mouse models of diabetic nephropathy. Current opinion in nephrology and hypertension 2011; 20: 278–284. [DOI] [PMC free article] [PubMed] [Google Scholar]
- 26.Breyer MD, Bottinger E, Brosius FC 3rd, et al. Mouse models of diabetic nephropathy. J Am Soc Nephrol 2005; 16: 27–45. [DOI] [PubMed] [Google Scholar]
- 27.Brosius FC 3rd, Alpers CE, Bottinger EP, et al. Mouse models of diabetic nephropathy. J Am Soc Nephrol 2009; 20: 2503–2512. [DOI] [PMC free article] [PubMed] [Google Scholar]
- 28.Fu J, Akat KM, Sun Z, et al. Single-Cell RNA Profiling of Glomerular Cells Shows Dynamic Changes in Experimental Diabetic Kidney Disease. J Am Soc Nephrol 2019; 30: 533–545. [DOI] [PMC free article] [PubMed] [Google Scholar]
- 29.Navarro-Gonzalez JF, Mora-Fernandez C, Muros de Fuentes M, et al. Inflammatory molecules and pathways in the pathogenesis of diabetic nephropathy. Nat Rev Nephrol 2011; 7: 327–340. [DOI] [PubMed] [Google Scholar]
- 30.Xu J, Huang Y, Li F, et al. FVB mouse genotype confers susceptibility to OVE26 diabetic albuminuria. American journal of physiology Renal physiology 2010; 299: F487–494. [DOI] [PMC free article] [PubMed] [Google Scholar]
- 31.Zheng S, Noonan WT, Metreveli NS, et al. Development of late-stage diabetic nephropathy in OVE26 diabetic mice. Diabetes 2004; 53: 3248–3257. [DOI] [PubMed] [Google Scholar]
- 32.Hong Q, Zhang L, Das B, et al. Increased podocyte Sirtuin-1 function attenuates diabetic kidney injury. Kidney Int 2018; 93: 1330–1343. [DOI] [PMC free article] [PubMed] [Google Scholar]
- 33.Arazi A, Rao DA, Berthier CC, et al. The immune cell landscape in kidneys of patients with lupus nephritis. Nat Immunol 2019; 20: 902–914. [DOI] [PMC free article] [PubMed] [Google Scholar]
- 34.Rogers NM, Ferenbach DA, Isenberg JS, et al. Dendritic cells and macrophages in the kidney: a spectrum of good and evil. Nature reviews Nephrology 2014; 10: 625 – 643. [DOI] [PMC free article] [PubMed] [Google Scholar]
- 35.Liu M, Tong Z, Ding C, et al. Transcription factor c-Maf is a checkpoint that programs macrophages in lung cancer. Journal of Clinical Investigation 2020; 130: 2081–2096. [DOI] [PMC free article] [PubMed] [Google Scholar]
- 36.Baitsch D, Bock HH, Engel T, et al. Apolipoprotein E induces antiinflammatory phenotype in macrophages. Arterioscler Thromb Vasc Biol 2011; 31: 1160–1168. [DOI] [PMC free article] [PubMed] [Google Scholar]
- 37.Rantakari P, Patten DA, Valtonen J, et al. Stabilin-1 expression defines a subset of macrophages that mediate tissue homeostasis and prevent fibrosis in chronic liver injury. Proceedings of the National Academy of Sciences of the United States of America 2016; 113: 9298–9303. [DOI] [PMC free article] [PubMed] [Google Scholar]
- 38.Subramanian A, Vernon K, Zhou Y, et al. Obesity-instructed TREM2high macrophages identified by comparative analysis of diabetic mouse and human kidney at single cell resolution. bioRxiv 2021: 2021.2005.2030.446342. [Google Scholar]
- 39.Cochain C, Vafadarnejad E, Arampatzi P, et al. Single-Cell RNA-Seq Reveals the Transcriptional Landscape and Heterogeneity of Aortic Macrophages in Murine Atherosclerosis. Circulation research 2018; 122: 1661–1674. [DOI] [PubMed] [Google Scholar]
- 40.Keren-Shaul H, Spinrad A, Weiner A, et al. A Unique Microglia Type Associated with Restricting Development of Alzheimer’s Disease. Cell 2017; 169: 1276–1290 e1217. [DOI] [PubMed] [Google Scholar]
- 41.Turnbull IR, Gilfillan S, Cella M, et al. Cutting edge: TREM-2 attenuates macrophage activation. J Immunol 2006; 177: 3520–3524. [DOI] [PubMed] [Google Scholar]
- 42.Deczkowska A, Weiner A, Amit I. The Physiology, Pathology, and Potential Therapeutic Applications of the TREM2 Signaling Pathway. Cell 2020; 181: 1207–1217. [DOI] [PubMed] [Google Scholar]
- 43.Nordlohne J, Hulsmann I, Schwafertz S, et al. A flow cytometry approach reveals heterogeneity in conventional subsets of murine renal mononuclear phagocytes. Sci Rep 2021; 11: 13251. [DOI] [PMC free article] [PubMed] [Google Scholar]
- 44.Kawakami T, Lichtnekert J, Thompson LJ, et al. Resident renal mononuclear phagocytes comprise five discrete populations with distinct phenotypes and functions. J Immunol 2013; 191: 3358–3372. [DOI] [PMC free article] [PubMed] [Google Scholar]
- 45.Yao W, Chen Y, Li Z, et al. Single Cell RNA Sequencing Identifies a Unique Inflammatory Macrophage Subset as a Druggable Target for Alleviating Acute Kidney Injury. Adv Sci (Weinh) 2022; 9: e2103675. [DOI] [PMC free article] [PubMed] [Google Scholar]
- 46.Zilionis R, Engblom C, Pfirschke C, et al. Single-Cell Transcriptomics of Human and Mouse Lung Cancers Reveals Conserved Myeloid Populations across Individuals and Species. Immunity 2019; 50: 1317–1334 e1310. [DOI] [PMC free article] [PubMed] [Google Scholar]
- 47.Jordao MJC, Sankowski R, Brendecke SM, et al. Single-cell profiling identifies myeloid cell subsets with distinct fates during neuroinflammation. Science 2019; 363. [DOI] [PubMed] [Google Scholar]
- 48.Zhang L, Li Z, Skrzypczynska KM, et al. Single-Cell Analyses Inform Mechanisms of Myeloid-Targeted Therapies in Colon Cancer. Cell 2020; 181: 442–459 e429. [DOI] [PubMed] [Google Scholar]
- 49.Pombo Antunes AR, Scheyltjens I, Lodi F, et al. Single-cell profiling of myeloid cells in glioblastoma across species and disease stage reveals macrophage competition and specialization. Nat Neurosci 2021; 24: 595–610. [DOI] [PubMed] [Google Scholar]
- 50.Li C, Menoret A, Farragher C, et al. Single cell transcriptomics based-MacSpectrum reveals novel macrophage activation signatures in diseases. JCI Insight 2019; 5. [DOI] [PMC free article] [PubMed] [Google Scholar]
- 51.Fan Y, Yi Z, D’Agati VD, et al. Comparison of Kidney Transcriptomic Profiles of Early and Advanced Diabetic Nephropathy Reveals Potential New Mechanisms for Disease Progression. Diabetes 2019; 68: 2301–2314. [DOI] [PMC free article] [PubMed] [Google Scholar]
- 52.Miao Z, Balzer MS, Ma Z, et al. Single cell regulatory landscape of the mouse kidney highlights cellular differentiation programs and disease targets. Nat Commun 2021; 12: 2277. [DOI] [PMC free article] [PubMed] [Google Scholar]
- 53.Yonemoto S, Machiguchi T, Nomura K, et al. Correlations of tissue macrophages and cytoskeletal protein expression with renal fibrosis in patients with diabetes mellitus. Clin Exp Nephrol 2006; 10: 186–192. [DOI] [PubMed] [Google Scholar]
- 54.You H, Gao T, Cooper TK, et al. Macrophages directly mediate diabetic renal injury. American journal of physiology Renal physiology 2013; 305: F1719–1727. [DOI] [PMC free article] [PubMed] [Google Scholar]
- 55.Wang Y, Harris DC. Macrophages in renal disease. J Am Soc Nephrol 2011; 22: 21–27. [DOI] [PubMed] [Google Scholar]
- 56.Wang X, Yao B, Wang Y, et al. Macrophage Cyclooxygenase-2 Protects Against Development of Diabetic Nephropathy. Diabetes 2017; 66: 494–504. [DOI] [PMC free article] [PubMed] [Google Scholar]
- 57.Devaraj S, Tobias P, Kasinath BS, et al. Knockout of toll-like receptor-2 attenuates both the proinflammatory state of diabetes and incipient diabetic nephropathy. Arterioscler Thromb Vasc Biol 2011; 31: 1796–1804. [DOI] [PMC free article] [PubMed] [Google Scholar]
- 58.Zheng D, Wang Y, Cao Q, et al. Transfused macrophages ameliorate pancreatic and renal injury in murine diabetes mellitus. Nephron Exp Nephrol 2011; 118: e87–99. [DOI] [PubMed] [Google Scholar]
- 59.Sun H, Tian J, Xian W, et al. Pentraxin-3 Attenuates Renal Damage in Diabetic Nephropathy by Promoting M2 Macrophage Differentiation. Inflammation 2015; 38: 1739–1747. [DOI] [PubMed] [Google Scholar]
- 60.Lee S, Huen S, Nishio H, et al. Distinct macrophage phenotypes contribute to kidney injury and repair. J Am Soc Nephrol 2011; 22: 317–326. [DOI] [PMC free article] [PubMed] [Google Scholar]
- 61.Lech M, Grobmayr R, Ryu M, et al. Macrophage phenotype controls long-term AKI outcomes--kidney regeneration versus atrophy. J Am Soc Nephrol 2014; 25: 292–304. [DOI] [PMC free article] [PubMed] [Google Scholar]
Associated Data
This section collects any data citations, data availability statements, or supplementary materials included in this article.
Supplementary Materials
Data Availability Statement
The data supporting the findings of this study are publicly available through the Gene Expression Omnibus repository (GSE195799).


