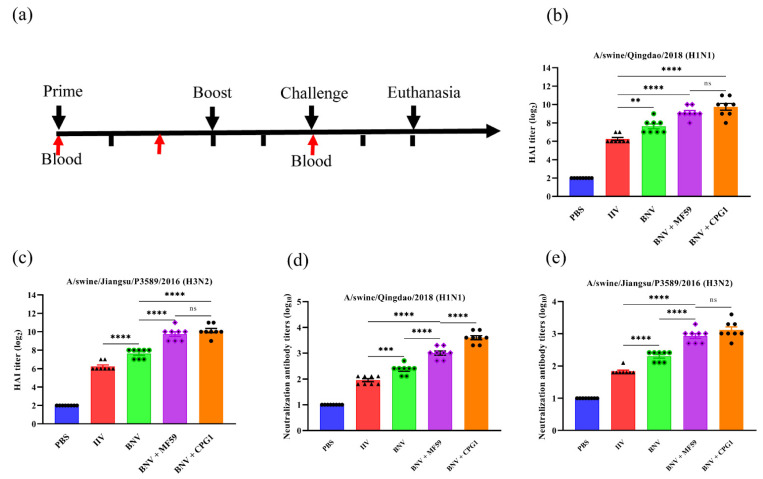
Figure 3.
HAI and VN antibody responses in BNV immunized mice. (a) Schematic flow diagram of the animal immunization and challenge. (b,c) HAI antibody titers in mice after immunization with swine influenza bivalent nanoparticle vaccines (n = 8). The results were calculated by the value of log2. Each symbol represents an individual mouse, and the horizontal bar indicates the geometric mean of the group. (d,e) VN antibody titers in mice after immunization with swine influenza bivalent nanoparticle vaccines (n = 8). The results were calculated by the value of log10. Each symbol represents an individual mouse, and the horizontal bar indicates the geometric mean of the group. Values are presented as mean ± standard deviation (S.D). Statistical significance analysis was performed using one-way ANOVA and then multiple comparison tests (** p < 0.01; *** p < 0.001; **** p < 0.0001; ns, p > 0.05), and n.s. indicates no significance between the two compared groups (n = 8). Three parallel experiments in each group were conducted.

