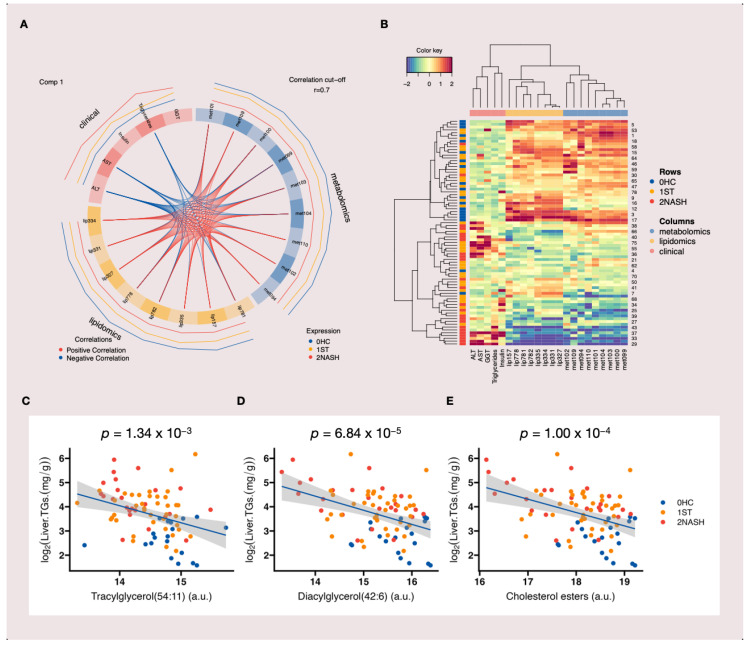
Figure 5.
Our multiblock integrative analysis for clinical, metabolomic and lipidomic data: (A) the circos plot showing the integrative frameworks and the positive (red lines) and negative (blue lines) correlations (cutoff r = 0.7) between selected variables from each block, represented on the side quadrants (the selected feature names were coded as “metxxx” for metabolomic data and “lipxxx” for lipidomic data); (B) the clustered image map (CIM) for the variables selected by our multiblock sPLS-DA of the first component in which the Euclidean distance and complete linkage methods were used (the CIM shows the samples in the rows (as indicated by their stages of MAFLD on the left-hand side of the plot) and the selected features in the columns (as indicated by their data type at the top of the plot); (C–E) the three main lipids that matched the selected features from the multiblock analysis and correlation with liver TG content. Note: a.u., arbitrary unit.

