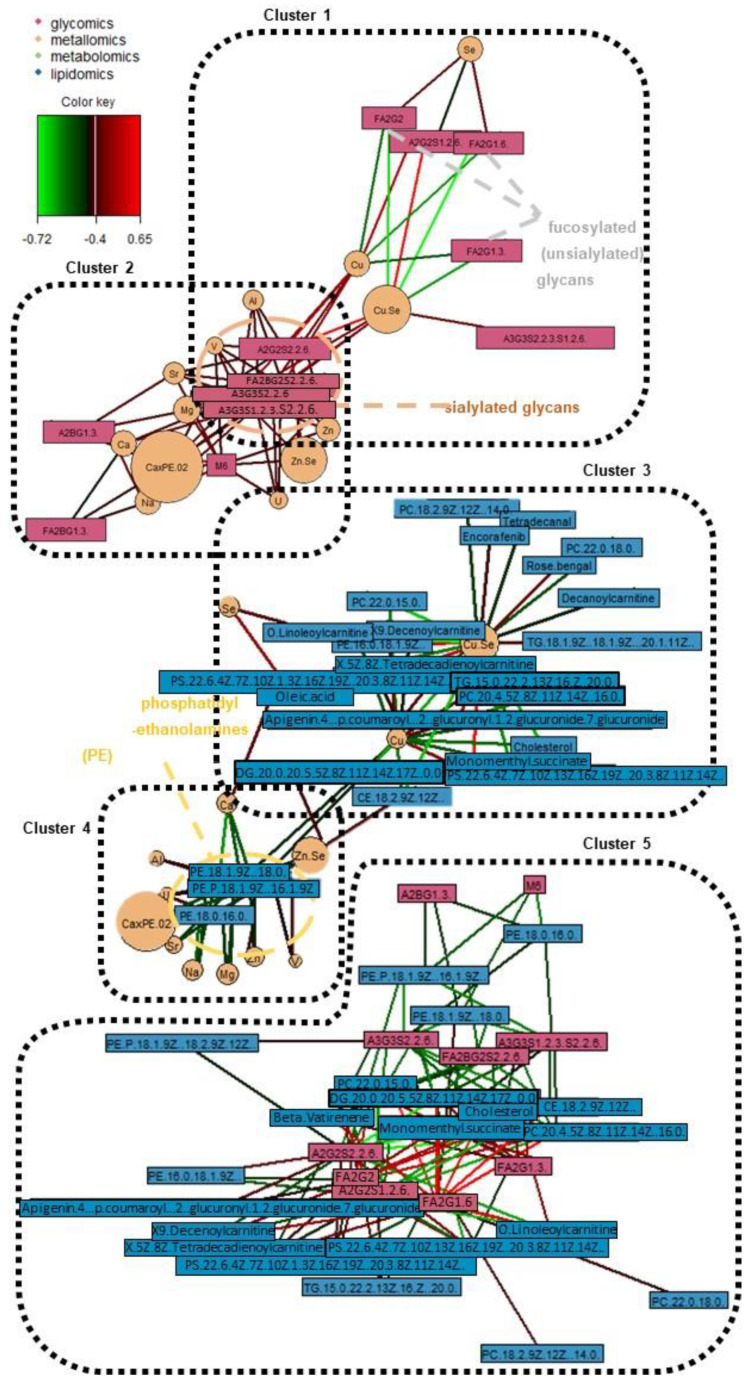
Figure 5.
Relevance networks of significant omics features across various bi-omics combinations (all r ≥ 0.4; p-value < 0.05). The color key indicates the correlation coefficient values annotated by the connection lines between variables. Red colored connection lines denote positive correlations, while green colored connection lines denote negative correlations between variables. The intensity of the colors is scaled according to the magnitude of the correlation coefficient values.

