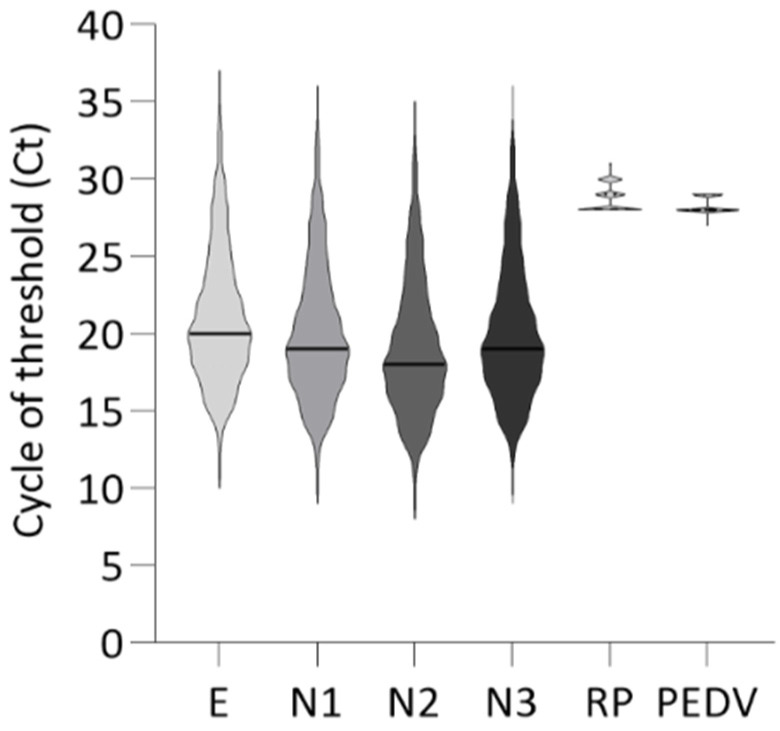
Figure 3.
Violin plot of the cycle threshold (Ct) value of multiplex RT-rPCR. The violin plot shows the cycle threshold (Ct) values obtained for each positive SARS-CoV-2 sample tested (n = 835). For each plot, the continuous line indicates the median value: E = 20; N1 = 19; N2 = 18; N3 = 19; RP = 28; PEDV = 28. No amplification curve was obtained for HCoV-HKU-1-PR or upE_TqPR. E = envelope gene; N1-N3 = nucleocapsid gene; RP = RNaseP gene; PEDV = porcine epidemic diarrhea virus. The data were plotted using GraphPad Prism 9.3.1.

