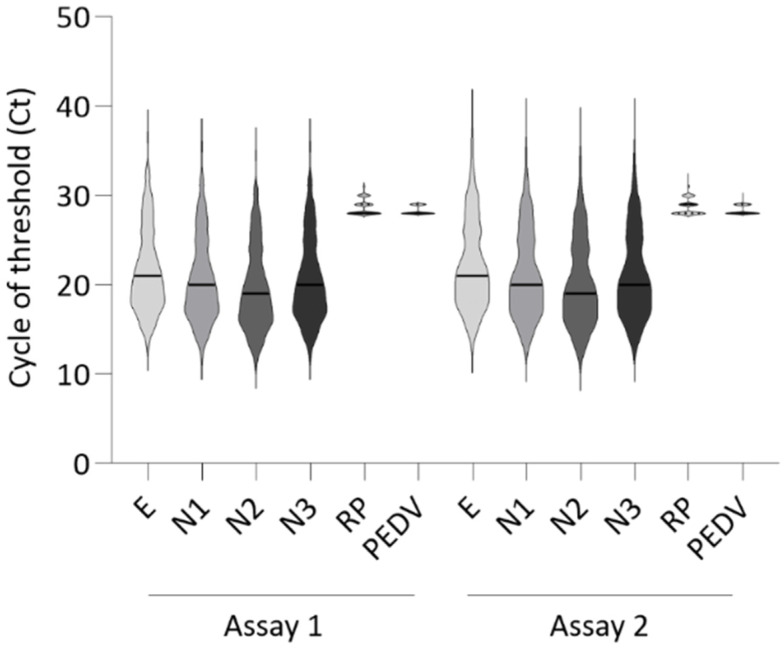
Figure 4.
Comparison of cycle threshold (Ct) values of two multiplex RT-rPCR sessions performed at different times. The violin plot shows the cycle threshold (Ct) values obtained during two different assays performed on 321 positive SARS-CoV-2 samples at time zero (Assay 1) and after six months (Assay 2). The plot shows that the Ct value is very similar between the two independently performed assays. This result confirmed the stability of multiplex RT-rPCR master mix conferred by Enzyme Stabilizer. The continuous line inside the plot indicates the median value. Assay 1: E = 21; N1 = 20; N2 = 19; N3 = 20; RP = 28; PEDV = 28. Assay 2: E = 21; N1 = 20; N2 = 19; N3 = 20; RP = 28; PEDV = 28. No significant difference (p < 0.05) was revealed by t-test. E = envelope gene; N1–N3 = nucleocapsid gene; RP = RNaseP gene; PEDV = porcine epidemic diarrhea virus. The data were plotted using GraphPad Prism 9.3.1.

