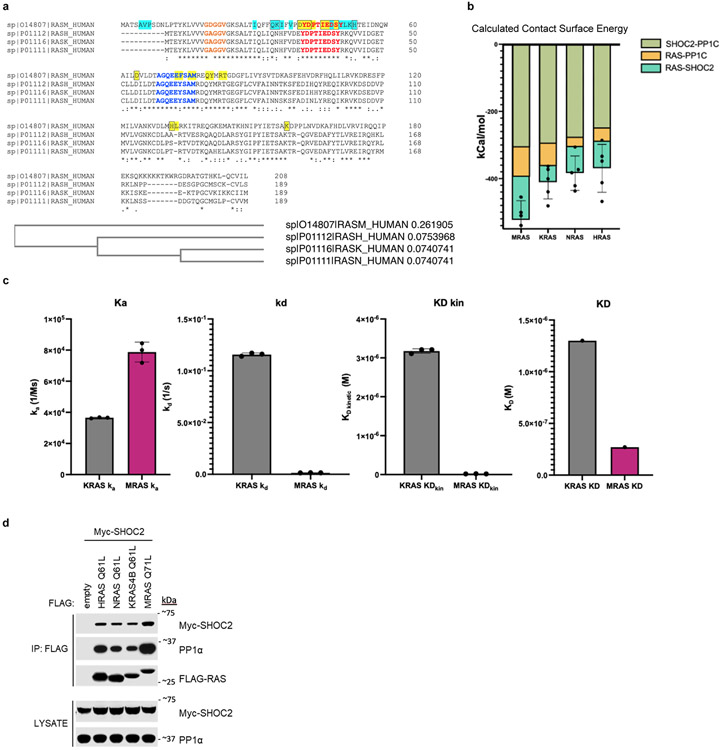
Extended Data Figure 7. Evaluation of RAS isoforms in context of SHOC2 holophosphatase complex formation.
a, Multiple sequence alignment analysis (EMBL-EBI ClustalW) of RAS isoforms (MRAS, KRAS, HRAS, NRAS). Switch I (red), Switch II (blue), and P-loop (orange) are annotated. MRAS residues that interact with PP1C (cyan highlighted) and SHOC2 (yellow highlighted) are boxed if they contribute ≤ −1.5kcal/mol of calculated paired interaction. b, Mean interaction energy calculated through molecular dynamic simulation of RAS isoforms (n = average of 5 representative frames/RAS isoform) and error bars represent standard deviation of the mean. c, BLI experimentation of MRAS and KRAS complex with activated SHOC2-PP1C. Mean (n= 3 technical replicates, representative of 3 independent experiments) for binding constants (Ka, kd, KD kin) and error bars (standard deviation) are presented. d, Immunoprecipitation of various exogenously expressed oncogenic RAS isoforms from 293T cells co-transfected with FLAG-tagged RAS and Myc-tagged SHOC2 (representative of 3 biological replicates).

