Abstract
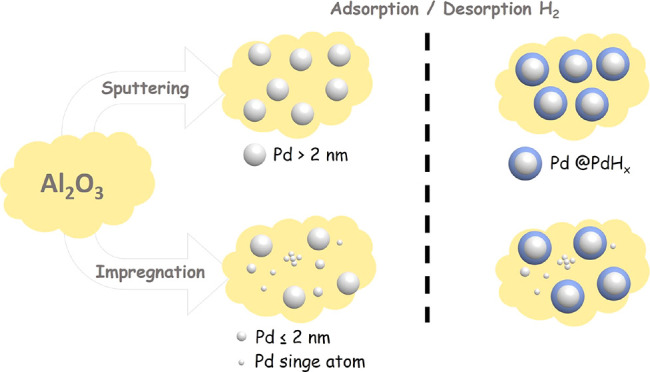
A key step in creating efficient and long-lasting catalysts is understanding their deactivation mechanism(s). On this basis, the behavior of a series of Pd/corundum materials during several hydrogen adsorption/desorption cycles was studied using temperature-programmed desorption coupled with mass spectrometry and aberration-corrected transmission electron microscopy. The materials, prepared by impregnation and by sputtering, presented uniform well-dispersed Pd nanoparticles. In addition, single atoms and small clusters of Pd were only detected in the materials prepared by impregnation. Upon exposure to hydrogen, the Pd nanoparticles smaller than 2 nm and the single atoms did not present any change, while the larger ones presented a core–shell morphology, where the core was Pd and the shell was PdHx. The results suggest that the long-term activity of the materials prepared by impregnation can be attributed solely to the presence of small clusters and single atoms of Pd.
1. Introduction
Known since 1866,1 palladium hydrides (PdHx) have been extensively studied as they serve as an excellent model of solute-driven phase transitions, exhibiting fast kinetics at accessible temperatures and pressures.2 The absorption of hydrogen on Pd is governed by three steps: (i) the dissociation of H2 into atoms and their chemisorption on the Pd surface, (ii) the diffusion of hydrogen on the Pd surface, and (iii) the diffusion into the bulk metallic structure.3 Two distinct phases are formed during the absorption process: an α-phase at a lower hydrogen concentration, where x < 0.01, and a β-phase at higher concentrations, x ∼0.07,4−6 with a boundary line reported at 273 °C and 2.4 MPa at 0.01 < x < 0.07.7 Interestingly, the phase coexistence occurs only in bulk Pd, while for a single Pd nanocrystal, there is a sudden α-to-β transformation.8 While in the bulk PdHx the atomic hydrogen is stored in the energetically favored octahedral sites in the face-centered cubic structure, at the nanoscale, there is no change in symmetry but a dilation of the Pd lattice.9
The adsorption of hydrogen in the Pd structure induces both elastic and plastic deformations which, in turn, will lead to dislocations in the material; it is considered that these changes are size-dependent.10 Griessen et al. demonstrated that the hydrogen absorption process on Pd nanoparticles is a coherent process, while the desorption one is mostly incoherent, as in the bulk material.11 While the first process does not modify the Pd lattice, during the second one, lattice mismatches are possible. Thus, it comes as no surprise that the interactions between the hydrogen absorption and desorption with Pd will have a strong effect on its catalytic activity.
In our previous work, corundum catalytic membrane reactors (CMRs) containing Pd as the active phase were employed in the in situ generation of hydrogen peroxide,12 phenol oxidation,13 phenol hydrogenation,14 chromium(VI) reduction,15 and ibuprofen hydrogenation.14 In all cases, the Pd-CMRs prepared by impregnation did not lose their catalytic activity after several uses, while the ones prepared by sputtering suffered very fast deactivation. In this study, we investigate the changes that might occur when Pd nanoparticles on corundum powder are exposed to hydrogen. Although both methods produce uniform nanoparticles, the impregnation method leads to single atoms and small clusters which are the main active species. Moreover, we show that the loss in activity is due to the formation of a core–shell palladium hydride structure on the Pd nanoparticles with sizes larger than 2 nm. Although core–shell palladium hydride nanoparticles have been previously reported,8,16−21 from the best of our knowledge, this is the first time they are correlated with catalytic deactivation.
2. Materials and Methods
2.1. Sample Preparations
2.1.1. Method 1—By Impregnation
Palladium was added on the corundum powder using an impregnation method already reported in the literature.12−15 In a typical procedure, a known amount of PdCl2 (Johnson Matthey, 59.83% Pd) was added, under continuous stirring, to Milli-Q water; HCl (37%, Sigma-Aldrich) was added dropwise to facilitate the dissolution of the metal salt. The impregnation was done in such a way to obtain 2 wt % Pd with respect to the mass of corundum powder. The resulting solid was dried for 5 h at 120 °C, calcined at 450 °C in air, overnight, and reduced under H2 (20 standard cubic centimeters per minute—sccm, 3 h at 350 °C). The amount of Pd added was determined from the weight difference between the original and impregnated powder. The material was denoted as Pdi.
2.1.2. Method 2—By Sputtering
A thin layer of corundum powder was placed onto a Petri dish and introduced into the vacuum chamber of a K575X sputter coater (Quorum Technologies). Palladium was pulverized from a Hauner Metallische Werkstoffe palladium target with 95% purity. The background vacuum was set to 10–5 Pa, the deposition was carried with pure argon, and the sputtering current was maintained at 30 mA. Three sputtering times were chosen as follows: 30, 90, and 150 s. To determine the amount of Pd deposited on the powder, the procedures were run under the same conditions but using a piece of glass. The thickness of the Pd layer on the glass was calculated from the X-ray reflectometry by the fast Fourier transformation method. All the samples were dried for 2 h at 120 °C; the samples were divided in two: one part was calcined at 350 °C for 6 h and the other one at 600 °C for 6 h; all samples were reduced in hydrogen, 20 sccm for 2 h at 350 °C. The materials were denoted as Pds-a-b, where a represents the sputtering time and b the calcination temperature.
2.2. Analysis and Characterization
Conventional transmission electron microscopy (TEM) was run on a JEOL model 1011 equipment. Samples were prepared by dispersion in ethanol using sonication and cast onto copper grids coated with carbon mesh. The size of the Pd particles was determined using ITEM Olympus software. High-angle annular dark-field and annular bright-field scanning TEM (HAADF-STEM and ABF-STEM) analyses were run of an aberration-corrected JEM ARM 200 cF equipment. Using these complementary techniques, a better visualization of the potential structural changes that might occur in the samples after hydrogen exposure will be possible, through a better discrimination of the Pd nanoparticles and the Al2O3 support, since in the HAADF-STEM images, Pd nanoparticles have a higher contrast, while elements with smaller Z, such as Al, are easily identifiable in the ABF technique.
X-ray diffraction (XRD) measurements were performed on a Bruker-AXS D8-Discover diffractometer equipped with a parallel incident beam (Göbel mirror), a vertical Θ–Θ goniometer, an XYZ motorized stage-mounted Eulerian cradle, diffracted beam Soller slits, and a scintillation counter as a detector. The samples prepared by impregnation were analyzed using an angular step of 0.02° at 47.9 s per step at 25 °C; the angular 2Θ diffraction range was 36.6–44.2° for the samples prepared by impregnation and between 36 and 48° for the ones prepared by sputtering. The X-ray diffractometer was operated at 40 kV and 40 mA to generate Cu Kα radiation (wavelength of 1.54056 Å).
The hydrogen absorption/desorption behavior of Pd was run in an in-house equipment with the following configuration: a tubular furnace, in which a quartz reactor containing the sample is placed vertically; four gas (H2, O2, Ar, and synthetic air) lines were connected to the upper part of the reactor, and the flow of the gas was controlled using a mass flow controller (Alicat); and the bottom part of the reactor was connected to a mass spectrometer, OmniStar Pfeiffer Vacuum. Typically, two–four cycles of hydrogen saturation were run, followed by hydrogen desorption. Table 1 presents the steps carried out for each cycle.
Table 1. Typical Cycle of Hydrogen Adsorption.
| temperature (°C) | time (min) | flow of H2 (sccm) | flow of Ar (sccm) | purpose |
|---|---|---|---|---|
| 60 | 60 | 5 | 45 | saturation with H2 |
| 60 | 120 | 0 | 51.2 | purging the lines |
| 60–460 | 80 | 0 | 51.2 | temperature-programmed desorption |
| 460 | 20 | 0 | 51.2 | elimination of any H2 residue in the sample |
3. Results and Discussion
Our previous studies12−15 have shown that the CMRs containing Pd added by sputtering suffered a faster deactivation than those prepared by impregnation. To investigate why this happened, we have prepared Pd/corundum powder materials using the same methods employed for the preparation of the CMRs and analyzed them before and after the hydrogen absorption/desorption cycles. Table 2 presents the percentage of Pd deposited on the powder, along with the mean size of the nanoparticles before the hydrogen absorption/desorption cycles, computed from conventional TEM analysis.
Table 2. Weight Percent of Pd and the Mean Size of the Nanoparticles.
As expected, increasing the sputtering time will increase the amount of Pd deposited on the corundum powder (Table 2, rows 2–7), slightly affecting the particle mean size (e.g., at 350 °C, Table 2, rows 2, 4, and 6). On the other hand, an increase in the calcination temperature from 350 to 600 °C did favor sintering (Table 2, rows 3, 5, and 7). Although a higher content of Pd was deposited using the impregnation method (Table 2, row 1), the nanoparticles have the same mean size as those obtained from sputtering at exposure times of 90 and 150 s and calcined at 600 °C (Table 2, rows 3, 5, and 7).
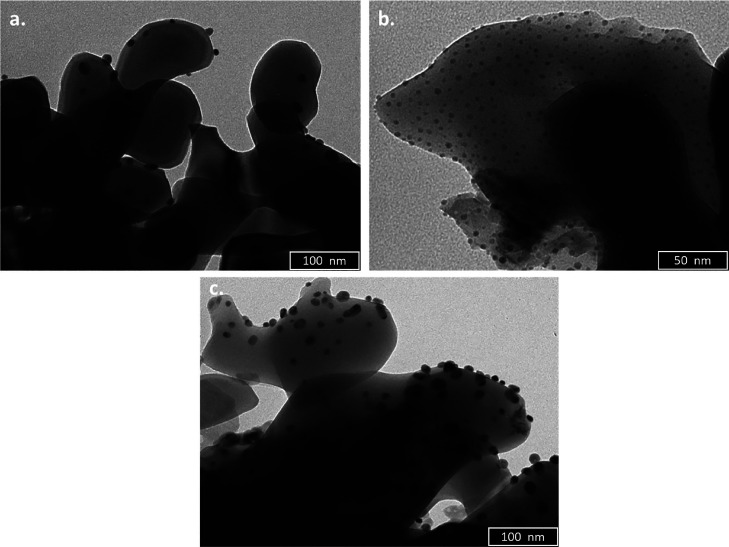
No matter the preparation method (impregnation or sputtering), the Pd nanoparticles have similar morphologies, mainly spherical and well dispersed (Figure 1). As there was no visible difference between the materials prepared using different sputtering times, only the ones prepared for 150 s are presented in this article.
Figure 1.
TEM images for (a) Pdi material; (b) Pds-150-350 material, and (c) Pds-150-600 material.
The X-ray diffractograms of all the studied materials present two peaks at 37.7 and 43.3° 2Θ corresponding to the corundum support (Figure 2a). It is well known that XRD is a bulk measurement and the signals are directly connected to the size of the nanoparticles and their concentration in the material.22,23 As expected, the diffraction peak at around 40.15°, specific to Pd(111), was clearly visible for the material prepared by impregnation (Figure 2b) and was too weak for the ones prepared by sputtering (Figure 2c,d). In these circumstances, we have only presented the diffractograms of the Pds materials containing the highest content of Pd.
Figure 2.
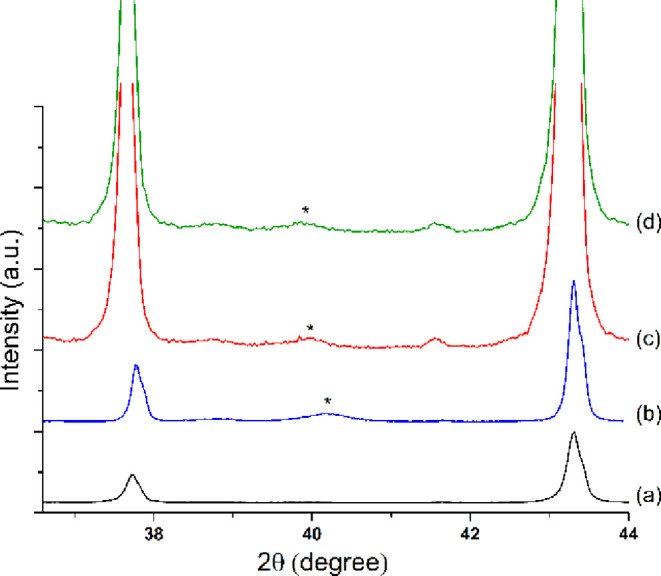
XRD patterns for (a) pure corundum, (b) Pdi, (c) Pds-150-350, and (d) Pds-150-600; *—highlights the peak positions corresponding to the Pd metal (JCPDS #01-088-2335). Diffractograms (c,d) are zoomed in to highlight the peaks corresponding to Pd.
All materials were subjected to two or three cycles of hydrogen absorption and desorption, as explained in Section 2.2. Previous studies have shown that when Pd is exposed to H2, three hydrogen species are formed: a near-surface H, a surface-chemisorbed H, and a bulk-dissolved one. While first species is desorbed at very low temperatures, around −123 °C, the bulk-dissolved one is desorbed at temperatures above 130 °C.24 The first cycle run on the Pdi material (Figure 3) presented two main peaks, one at 109 °C attributed to the desorption of the chemisorbed hydrogen and another one, larger, at around 435 °C corresponding to the hydrogen dissolved in the Pd lattice. Surprisingly, when the second and the third cycles were run, no bulk-dissolved hydrogen was detected and only the chemisorbed one was observed. These results indicate that the activity of the CMRs prepared by impregnation is completely attributed to the chemisorbed hydrogen and not the one diffused into the Pd lattice.
Figure 3.
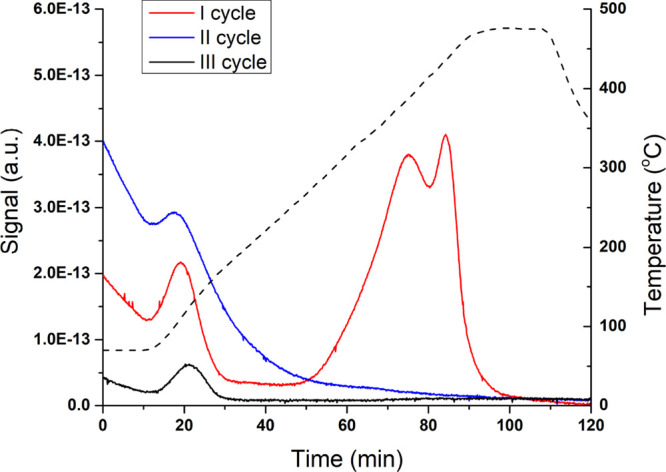
TPD-MS results for the Pdi materials (prepared by impregnation). The dotted line represents the temperature ramp, and its corresponding Y axes are in the right.
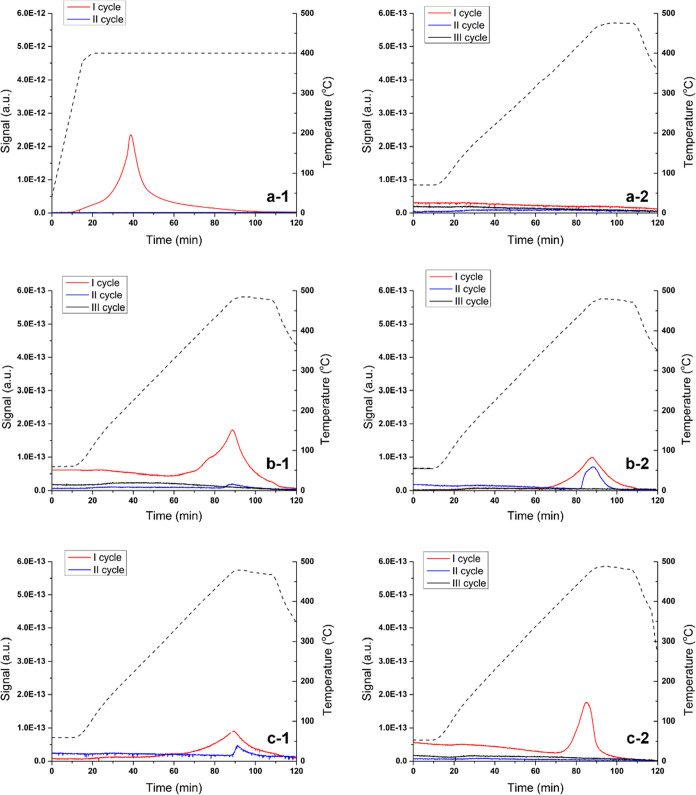
The temperature-programmed desorption-mass spectrometry (TPD-MS) profiles of the six materials prepared by sputtering are presented in Figure 4. In the first cycle, all the samples [with the exception of the Pds-30-600 material—Figure 4(a-2)] present the desorption peak corresponding to the bulk-dissolved hydrogen and none of them show the one due to the chemisorbed species. As the bulk-dissolved H cannot exist without the chemisorbed one,9 it is safe to consider that the desorption peak corresponding to this H is under the detection limit of the mass detector—which also explains the absence of the peaks for the Pds-30-600 material. After running a second or third cycle of the hydrogen adsorption/desorption process, the peak corresponding to the bulk-dissolved hydrogen is either decreasing or disappearing, demonstrating that the materials are losing their activity. This is in accordance with the catalytic activity observed using the CMRs prepared by the same method.12−15 It is important to underline that the possibility of a hydrogen spillover effect is extremely low as less-severe conditions were used in this study compared to the ones where the phenomenon was detected.25−27
Figure 4.
TPD-MS profiles for the materials prepared by sputtering: (a-1) Pds-30-350; (a-2) Pds-30-600; (b-1) Pds-90-350; (b-2) Pds-90-600; (c-1) Pds-150-350; and (c-2) Pds-150-600. The dotted line represents the temperature ramp, and its corresponding Y axes are in the right.
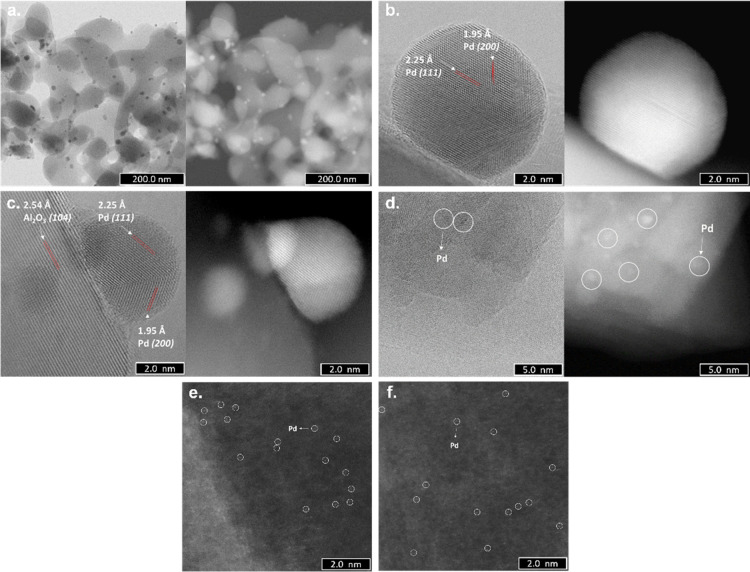
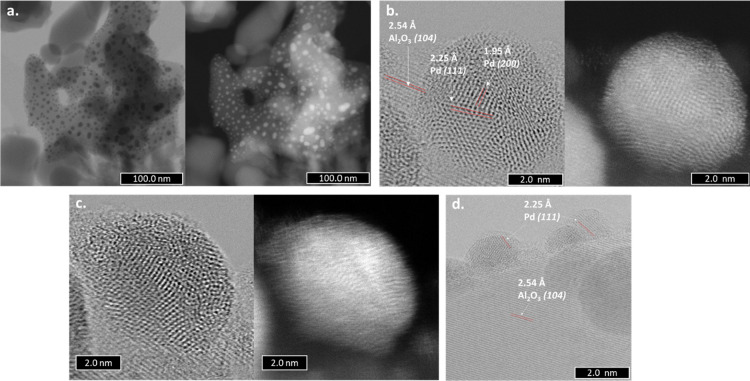
As the XRD analyses of all materials did not present any visible changes before and after exposure to hydrogen (not shown here), we decided to investigate the materials that showed the most distinctive activity by ABF-STEM and HAADF-STEM: the Pdi and the Pds-30-350. The Pdi material presented very well-dispersed Pd nanoparticles (6–10 nm) (Figure 5a), perfectly crystalline with monodomains with sharp edges. Two lattice fringes with the interplaner distances of 1.95 and 2.25 Å corresponding to the Pd(200) and Pd(111) planes, respectively, were identified in nanoparticles of 1–2 nm in size, along with a lattice fringe of 2.50 Å for the Al2O3(104) plane28 (Figure 5b,c). These indicate the [110] growth direction of the Pd nanoparticles.29 In addition, clusters and Pd single atoms were observed, as can be seen in Figure 5d–f.
Figure 5.
ABF-STEM (left side) and HAADF-STEM (right side) images of the Pdi materials: (a) well-dispersed Pd nanoparticles with sizes between 6 and 10 nm; (b,c) Pd nanoparticles of 1–2 nm; (d) clusters of Pd atoms and HAADF-STEM images; and (e,f) Pd single atoms. For a better visualization, white circles were used.
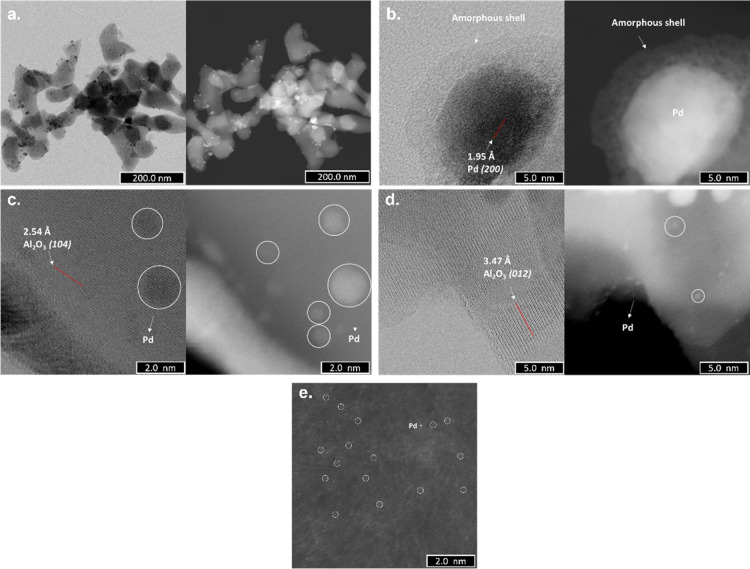
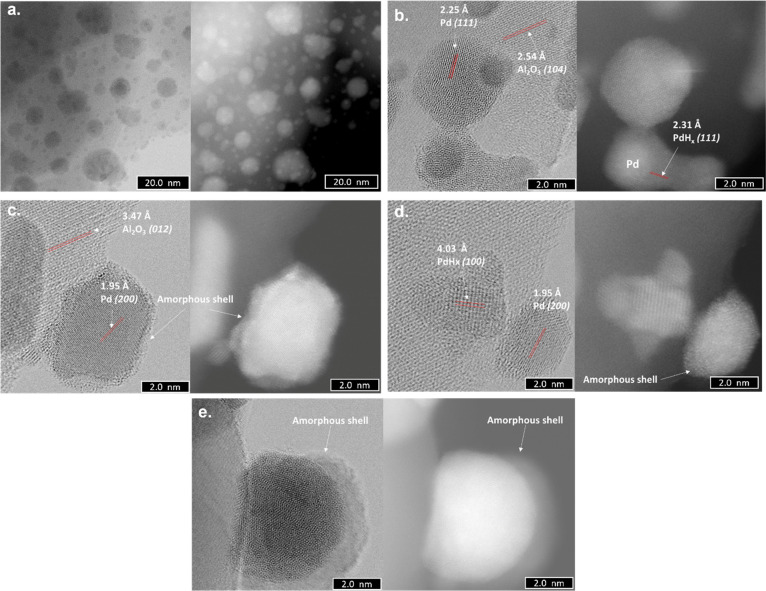
After three cycles of hydrogen adsorption and desorption, the large nanoparticles present a core–shell structure, with Pd as the core and an amorphous material as the shell (Figure 6a,b). Intriguingly, this change is not detected for the Pd nanoparticles of 1–2 nm. Moreover, an abundant number of clusters and single atoms of Pd have been detected (Figure 6c–e).
Figure 6.
ABF-STEM (left side) and HAADF-STEM (right side) images of the Pdi materials after three cycles of hydrogen adsorption/desorption: (a) well-dispersed Pd nanoparticles with sizes between 6 and 10 nm; (b,c) Pd nanoparticles of 1–2 nm; (d) clusters of Pd atoms and HAADF-STEM images; and – Pd single atoms. For a better visualization, white circles were used. For the Al2O3 lattice fringes, see ref (30).
The material prepared by exposure to sputtering for 30 s followed by calcination at 350 °C presents poorly ordered Pd nanoparticles with numerous crystalline domains (Figure 7); these make them highly stressed from a structural point of view. Compared to the Pdi material, in this case, no clusters or single atoms were detected.
Figure 7.
ABF-STEM (left side) and HAADF-STEM (right side) images of the Pds-30-350 materials: (a) poorly ordered Pd nanoparticles and (b–d) (only ABF-STEM) Pd nanoparticles with numerous crystalline domains.
After one cycle of hydrogen adsorption/desorption, all the Pd nanoparticles found in the Pds-30-350 material present the same core–shell structure as detected in the Pdi ones (Figure 8). In some cases, the shell presented lattice fringes of 2.31 and 4.03 Å corresponding to PdHx(111) and (100) planes, respectively.31 It can be concluded that the disappearance of the peak corresponding to the bulk-dissolved hydrogen after one cycle of H2 absorption/desorption process in the TPD-MS profiles for all materials is due to the formation of these core–shell structures.
Figure 8.
ABF-STEM (left side) and HAADF-STEM (right side) images of the Pds-30-350 materials after exposure to hydrogen: (a,c,e) Pd nanoparticles with a core–shell structure and (b,d) shell corresponding to the palladium hydride.
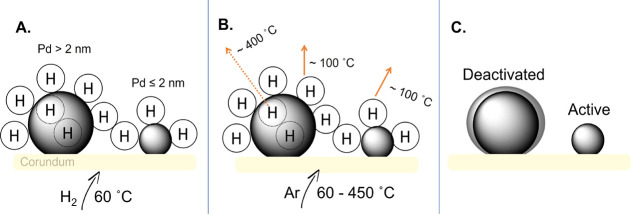
The hydride formation of Pd is a four-step process, consisting of the following: adsorption of gaseous hydrogen molecules, their dissociation into atoms, penetration of these atoms into the subsurface, and the dissolution in the interstitial sites of the bulk.32 It has been already shown that the formation of palladium hydride is directly related with the particle size, where large particles provide more interstitial places for hydride formation, while the smaller ones are prone to chemisorbed hydrogen.17 Thus, when Pd/corundum materials prepared by either impregnation or sputtering are exposed for the first time to hydrogen, the particles with sizes larger than 2 nm will be able to absorb and dissolute some of the H atoms (Figure 9A); the penetration of the interstitial sites will cause an expansion of the Pd lattice which, in return, will affect the decomposition of the palladium hydride under the studied conditions. Consequently, during the desorption process, the release of the dissolved hydrogen is accompanied by the formation of a palladium hydride shell which blocks the adsorption of hydrogen in the next cycles (Figure 9B,C). In contrast, the Pd nanoparticles with sizes less than 2 nm are not able to dissolve hydrogen atoms, thus they maintain their activity after several hydrogen adsorption/desorption cycles.
Figure 9.
Mechanism of Pd/corundum deactivation.
4. Conclusions
Based on our previous findings, we have studied the behavior of Pd/corundum materials prepared by impregnation (Pdi) and by sputtering (Pds) under two or three cycles of hydrogen adsorption and desorption using TPD coupled with MS. The results indicate that, after a first cycle, the Pdi material desorbed both the chemisorbed and the interstitial dissolved hydrogen, while the Pds desorbed only the latter one. When subsequent cycles were run, the materials prepared by sputtering presented very low or almost no activity, while for the impregnated materials, only the chemisorbed hydrogen was detected.
Microscopic analysis has showed that the as-prepared Pdi and Pds materials contain well-defined Pd nanoparticles, but the Pdi presented scattered Pd single atoms and clusters of single atoms. Intriguingly, after hydrogen exposure, all Pd nanoparticles with sizes larger than 2 nm exhibited an amorphous palladium hydride shell, while the smaller ones and the single atoms maintained their original structures. The formation of the new core–shell morphology hinders the chemisorption of new hydrogen atoms, thus decreasing the catalytic activity. The findings of the present paper pave the way toward the design of more active Pd catalysts.
Acknowledgments
V.P.-V. expresses her gratitude for the economic support given by SENESCYT and Universidad de Cuenca. J.L. is a Serra Húnter Fellow and is grateful to the ICREA Academia program and project MICINN/FEDER PID2021-124572OB-C31.
Author Contributions
V.P.-V., O.O., and D.G.C. contributed equally, thus equal first authors. The manuscript was written through contributions of all authors. All authors have given approval to the final version of the manuscript.
The authors declare no competing financial interest.
References
- Graham T. XVIII. On the Absorption and Dialytic Separation of Gases by Colloid Septa. Philos. Trans. R. Soc. London 1866, 156, 399–439. 10.1098/rstl.1866.0018. [DOI] [Google Scholar]
- Narayan T. C.; Hayee F.; Baldi A.; Leen Koh A.; Sinclair R.; Dionne J. A. Direct Visualization of Hydrogen Absorption Dynamics in Individual Palladium Nanoparticles. Nat. Commun. 2017, 8, 14020. 10.1038/ncomms14020. [DOI] [PMC free article] [PubMed] [Google Scholar]
- Cabrera A. L.; Aguayo-Soto R. Hydrogen Absorption in Palladium Films Sensed by Changes in Their Resistivity. Catal. Lett. 1997, 45, 79–83. 10.1023/a:1019078419537. [DOI] [Google Scholar]
- Owen E. A.; Jones J. I. The Effect of Pressure and Temperature on the Occlusion of Hydrogen by Palladium. Proc. Phys. Soc. 1937, 49, 587–602. 10.1088/0959-5309/49/5/313. [DOI] [Google Scholar]
- Jewell L.; Davis B. Review of Absorption and Adsorption in the Hydrogen–Palladium System. Appl. Catal., A 2006, 310, 1–15. 10.1016/j.apcata.2006.05.012. [DOI] [Google Scholar]
- Johnson N. J. J.; Lam B.; MacLeod B. P.; Sherbo R. S.; Moreno-Gonzalez M.; Fork D. K.; Berlinguette C. P. Facets and Vertices Regulate Hydrogen Uptake and Release in Palladium Nanocrystals. Nat. Mater. 2019, 18, 454–458. 10.1038/s41563-019-0308-5. [DOI] [PubMed] [Google Scholar]
- Guigue B.; Geneste G.; Leridon B.; Loubeyre P. An X-Ray Study of Palladium Hydrides up to 100 GPa: Synthesis and Isotopic Effects. J. Appl. Phys. 2020, 127, 075901. 10.1063/1.5138697. [DOI] [Google Scholar]
- Syrenova S.; Wadell C.; Nugroho F. A. A.; Gschneidtner T. A.; Diaz Fernandez Y. A.; Nalin G.; Świtlik D.; Westerlund F.; Antosiewicz T. J.; Zhdanov V. P.; Moth-Poulsen K.; Langhammer C. Hydride Formation Thermodynamics and Hysteresis in Individual Pd Nanocrystals with Different Size and Shape. Nat. Mater. 2015, 14, 1236–1244. 10.1038/nmat4409. [DOI] [PubMed] [Google Scholar]
- Narehood D. G.; Kishore S.; Goto H.; Adair J. H.; Nelson J. A.; Gutierrez H. R.; Eklund P. C. X-Ray Diffraction and H-Storage in Ultra-Small Palladium Particles. Int. J. Hydrogen Energy 2009, 34, 952–960. 10.1016/j.ijhydene.2008.10.080. [DOI] [Google Scholar]
- Ndaya C. C.; Javahiraly N.; Brioude A. Recent Advances in Palladium Nanoparticles-Based Hydrogen Sensors for Leak Detection. Sensors 2019, 19, 4478. 10.3390/s19204478. [DOI] [PMC free article] [PubMed] [Google Scholar]
- Griessen R.; Strohfeldt N.; Giessen H. Thermodynamics of the Hybrid Interaction of Hydrogen with Palladium Nanoparticles. Nat. Mater. 2016, 15, 311–317. 10.1038/nmat4480. [DOI] [PubMed] [Google Scholar]
- Osegueda O.; Dafinov A.; Llorca J.; Medina F.; Suerias J. In Situ Generation of Hydrogen Peroxide in Catalytic Membrane Reactors. Catal. Today 2012, 193, 128–136. 10.1016/j.cattod.2012.01.040. [DOI] [Google Scholar]
- Osegueda O.; Dafinov A.; Llorca J.; Medina F.; Sueiras J. Heterogeneous Catalytic Oxidation of Phenol by In-Situ Generated Hydrogen Peroxide Applying Novel Catalytic Membrane Reactors. Chem. Eng. J. 2015, 262, 344–355. 10.1016/j.cej.2014.09.064. [DOI] [Google Scholar]
- Pinos V. P.; Crivoi D. G.; Medina F.; Sueiras J. E.; Dafinov A. I. New Tuneable Catalytic Membrane Reactor for Various Reactions in Aqueous Media. ChemistrySelect 2016, 1, 124–126. 10.1002/slct.201500005. [DOI] [Google Scholar]
- Pinos V.; Dafinov A.; Medina F.; Sueiras J. Chromium(VI) Reduction in Aqueous Medium by Means of Catalytic Membrane Reactors. J. Environ. Chem. Eng. 2016, 4, 1880–1889. 10.1016/j.jece.2016.03.008. [DOI] [Google Scholar]
- Zhdanov V. P.; Kasemo B. Kinetics of the Formation of a New Phase in Nanoparticles. Chem. Phys. Lett. 2008, 460, 158–161. 10.1016/j.cplett.2008.05.067. [DOI] [Google Scholar]
- Langhammer C.; Zhdanov V. P.; Zorić I.; Kasemo B. Size-Dependent Kinetics of Hydriding and Dehydriding of Pd Nanoparticles. Phys. Rev. Lett. 2010, 104, 135502. 10.1103/PhysRevLett.104.135502. [DOI] [PubMed] [Google Scholar]
- Langhammer C.; Zhdanov V. P.; Zorić I.; Kasemo B. Size-Dependent Hysteresis in the Formation and Decomposition of Hydride in Metal Nanoparticles. Chem. Phys. Lett. 2010, 488, 62–66. 10.1016/j.cplett.2010.01.071. [DOI] [Google Scholar]
- Ren H.; Zhang T.-Y. H. Concentrations and Stresses in Pd Nanoparticles. Mater. Lett. 2014, 130, 176–179. 10.1016/j.matlet.2014.05.104. [DOI] [Google Scholar]
- Wadell C.; Pingel T.; Olsson E.; Zorić I.; Zhdanov V. P.; Langhammer C. Thermodynamics of Hydride Formation and Decomposition in Supported Sub-10nm Pd Nanoparticles of Different Sizes. Chem. Phys. Lett. 2014, 603, 75–81. 10.1016/j.cplett.2014.04.036. [DOI] [Google Scholar]
- Bugaev A. L.; Guda A. A.; Lomachenko K. A.; Shapovalov V. V.; Lazzarini A.; Vitillo J. G.; Bugaev L. A.; Groppo E.; Pellegrini R.; Soldatov A. V.; van Bokhoven J. A.; Lamberti C. Core–Shell Structure of Palladium Hydride Nanoparticles Revealed by Combined X-Ray Absorption Spectroscopy and X-Ray Diffraction. J. Phys. Chem. C 2017, 121, 18202–18213. 10.1021/acs.jpcc.7b04152. [DOI] [Google Scholar]
- Wojcieszak R.; Genet M. J.; Eloy P.; Ruiz P.; Gaigneaux E. M. Determination of the Size of Supported Pd Nanoparticles by X-Ray Photoelectron Spectroscopy. Comparison with X-Ray Diffraction, Transmission Electron Microscopy, and H 2 Chemisorption Methods. J. Phys. Chem. C 2010, 114, 16677–16684. 10.1021/jp106956w. [DOI] [Google Scholar]
- Holder C. F.; Schaak R. E. Tutorial on Powder X-Ray Diffraction for Characterizing Nanoscale Materials. ACS Nano 2019, 13, 7359–7365. 10.1021/acsnano.9b05157. [DOI] [PubMed] [Google Scholar]
- Yu W.-Y.; Mullen G. M.; Mullins C. B. Hydrogen Adsorption and Absorption with Pd–Au Bimetallic Surfaces. J. Phys. Chem. C 2013, 117, 19535–19543. 10.1021/jp406736b. [DOI] [Google Scholar]
- Bettahar M. M. The Hydrogen Spillover Effect. A Misunderstanding Story. Catal. Rev. 2022, 64, 87–125. 10.1080/01614940.2020.1787771. [DOI] [Google Scholar]
- Techner S. J.; Mazabrard A. R.; Pajonk G.; Gardes G. E. E.; Hoang-Van C. Hydrogen Spillover in Catalytic Reactions: I. Activation of Alumina. J. Colloid Interface Sci. 1977, 58, 88–99. 10.1016/0021-9797(77)90373-3. [DOI] [Google Scholar]
- Kramer R.; Andre M. Adsorption of Atomic Hydrogen on Alumina by Hydrogen Spillover. J. Catal. 1979, 58, 287–295. 10.1016/0021-9517(79)90266-5. [DOI] [Google Scholar]
- Wang S.; Xie F.; Wu X.; Ma Y.; Du H.; Wu G. Cathodic Plasma Electrolytic Deposition of ZrO2/YSZ Doped Al2O3 Ceramic Coating on TiAl Alloy. Ceram. Int. 2019, 45, 18899–18907. 10.1016/j.ceramint.2019.06.125. [DOI] [Google Scholar]
- Xu D.; Liu X.; Lv H.; Liu Y.; Zhao S.; Han M.; Bao J.; He J.; Liu B. Ultrathin Palladium Nanosheets with Selectively Controlled Surface Facets. Chem. Sci. 2018, 9, 4451–4455. 10.1039/C8SC00605A. [DOI] [PMC free article] [PubMed] [Google Scholar]
- Zhu L.; Liu L.; Sun C.; Zhang X.; Zhang L.; Gao Z.; Ye G.; Li H. Low Temperature Synthesis of Polyhedral α-Al2O3 Nanoparticles through Two Different Modes of Planetary Ball Milling. Ceram. Int. 2020, 46, 28414–28421. 10.1016/j.ceramint.2020.07.346. [DOI] [Google Scholar]
- Sarac B.; Ivanov Y. P.; Karazehir T.; Mühlbacher M.; Kaynak B.; Greer A. L.; Sarac A. S.; Eckert J. Ultrahigh Hydrogen-Sorbing Palladium Metallic-Glass Nanostructures. Mater. Horiz. 2019, 6, 1481–1487. 10.1039/C9MH00316A. [DOI] [Google Scholar]
- Huang H.; Bao S.; Chen Q.; Yang Y.; Jiang Z.; Kuang Q.; Wu X.; Xie Z.; Zheng L. Novel Hydrogen Storage Properties of Palladium Nanocrystals Activated by a Pentagonal Cyclic Twinned Structure. Nano Res. 2015, 8, 2698–2705. 10.1007/s12274-015-0776-0. [DOI] [Google Scholar]


