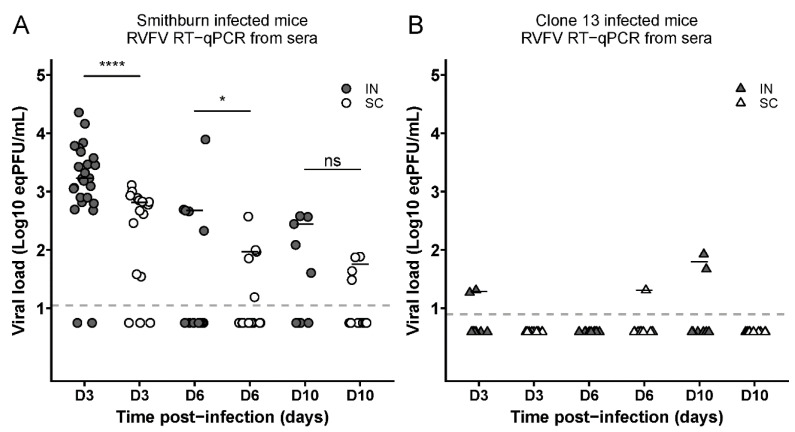
Figure 2.
Intranasally SB-infected mice display higher viremia than those subcutaneously infected. The graphs report the viral loads (expressed as eqPFU/mL) in the sera of intranasally (IN)- or subcutaneously (SC)-infected mice with the SB (A) or Cl.13 (B) strain, collected at D3 (n: SB-IN = 25; SB-SC = 17; Cl.13-IN = 11; and Cl.13-SC = 11), D6 (n: SN-IN = 15; SB-SC = 17; Cl.13-IN = 11 and Cl.13-SC = 11) and D10 (n: SN-IN = 10; SB-SC = 16; Cl.13-IN = 11; and Cl.13-SC = 11) p.i. Dashed lines indicate the threshold of virus detection [log10 (eqPFU/mL) = 1.049 for SB and 0.895 for Cl.13]. Negative sera are shown below these lines for each virus at half the value of their detection limits. For SB data, statistical analyses were performed using Wilcoxon–Mann–Whitney test (*: p < 0.05; ****: p < 0.0001 and ns: not significant).

