Abstract
Purpose
This study was performed to elucidate the mechanisms of morphological abnormalities in a Leber congenital amaurosis 16 (LCA16) cell model using KCNJ13 knockout (KO) retinal pigment epithelial cells derived from human iPS cells (hiPSC-RPE).
Methods
In KCNJ13 KO and wild-type hiPSC-RPE cells, ZO-1 immunofluorescence was performed, and confocal images were captured. The area and perimeter of each cell were measured. To detect cell death, ethidium homodimer III (EthD-III) staining and LDH assay were used. Scanning electron microscopy (SEM) was used to observe the cell surface. The expression levels of oxidative stress-related genes were examined by quantitative PCR. To explore the effects of oxidative stress, tert-butyl hydroperoxide (t-BHP) was administered to the hiPSC-RPE cells. Cell viability was tested by MTS assay, whereas oxidative damage was monitored by oxidized (GSSG) and reduced glutathione levels.
Results
The area and perimeter of KCNJ13-KO hiPSC-RPE cells were enlarged. EthD-III-positive cells were increased with more dead cells in the protruded region. The KO RPE had significantly higher LDH levels in the medium. SEM observations revealed aggregated cells having broken cell surfaces on the KO RPE sheet. The KCNJ13-deficient RPE showed increased expression levels of oxidative stress-related genes and total glutathione levels. Furthermore, t-BHP induced a significant increase in cell death and GSSG levels in the KO RPE.
Conclusions
We suggest that in the absence of the Kir.7.1 potassium channel, human RPE cells are vulnerable to oxidative stress and ultimately die. The dying/dead cells form aggregates and protrude from the surviving KCNJ13-deficient RPE sheet.
Keywords: Leber congenital amaurosis 16, KCNJ13, Kir7.1, RPE, retinal pigment epithelium
Leber congenital amaurosis 16 (LCA16) is a retinal dystrophy caused by abnormalities in the RPE due to mutations in the KCNJ13 gene.1–3 LCA16 causes clumpy pigment deposits between the RPE and the sensory retina.1,3,4 We have previously established a cellular model for LCA16 by knocking out the KCNJ13 gene in human iPS cells and inducing their differentiation to retinal pigment epithelium (RPE).5 The KCNJ13 knockout (KO) hiPSC-RPE has some areas protruding from the monolayer epithelial sheet.5 This protruding appearance recapitulates the clumpy pigment deposits seen in the LCA16 patients. However, the mechanism by which protrusion occurs in the KCNJ13-KO RPE and the properties of morphological changes in the mutant RPE are unknown.
The RPE cell is polygonal in shape and lines up in a pavement-like pattern beneath the neural retina. With aging and pathological conditions, the RPE undergoes morphological changes, such as enlargement of the cell area and loss of morphological uniformity.6–8 It has been reported that the RPE causes abnormal cell-to-cell alignment and cell morphology in the event of cell death6 and that cell death is likely involved in morphological changes in KCNJ13 KO RPE as at least one cause.5 Also, the expression levels of the genes involved in the oxidative stress response are increased in kcnj13 KO zebrafish.9 Because the RPE plays a variety of metabolic roles in the subretinal space and is exposed to oxidative stress,10 it has various antioxidant mechanisms.10–12 Based on these previous findings, we hypothesized that the antioxidant mechanisms might be impaired in KCNJ13 KO hiPSC-RPE cells and that cell death due to oxidative stress would be involved in the changes in the protrusion of KCNJ13 KO RPE cells. To test this hypothesis, we analyzed cell death and oxidative stress responses in KCNJ13 KO hiPSC-RPE cells and sought to elucidate the mechanism of retinal morphological changes in LCA16.
Methods
Induction of Differentiation of KCNJ13 KO hiPSC-RPE
The hiPSC line 454E2,13 generated from healthy human dental pulp cells, was obtained from the RIKEN BioResource Center (Ibaraki, Japan). The hiPSCs were maintained and differentiated as previously described (Supplementary Methods).5 Transepithelial electrical resistance (TEER) was measured (Supplementary Methods) and confirmed to be higher than 200 Ω · cm2. We also confirmed that both wild-type (WT) and KO cells showed pigmentation and a cobblestone appearance (Supplementary Fig. S1) and expressed BEST1 and CRALBP, markers of RPE, indicating that these cells were highly differentiated as RPE.5
Analysis of Cell Morphology
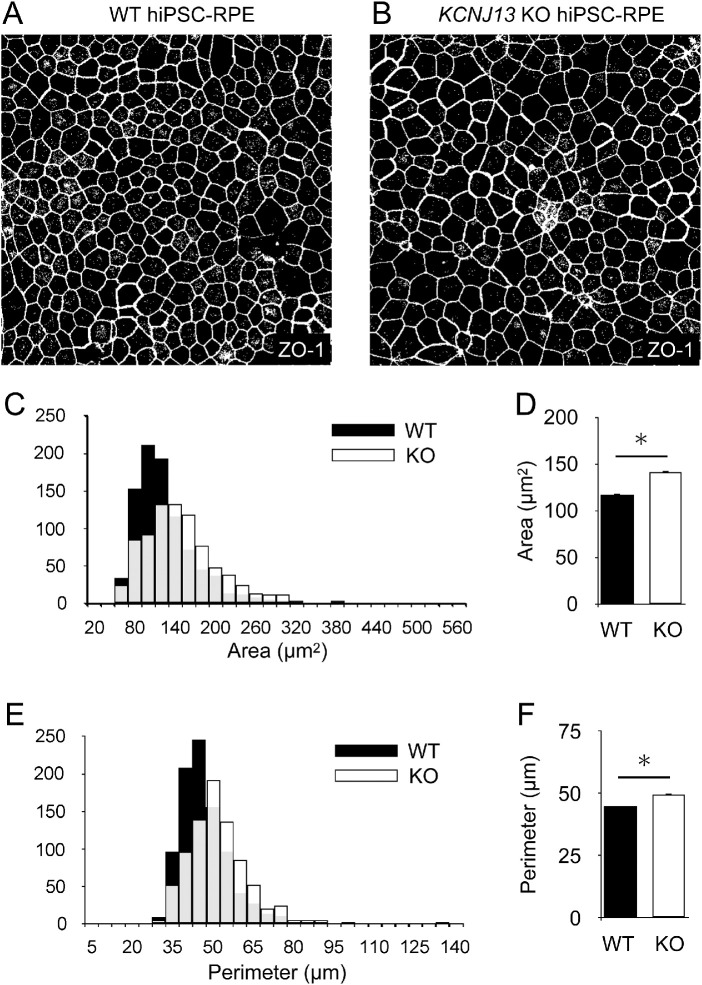
Briefly, after immunostaining for ZO-1 in RPE seeded on transwells, only the ZO-1 signal was extracted and converted to gray scale. The area and perimeter of the cells were automatically measured with Image J (Figs. 1A, 1B, Supplementary Methods).
Figure 1.
Cell size is enlarged in the KCNJ13 KO RPE. (A, B) Representative images of WT and KO hiPSC-RPE cells. Immunostaining of ZO-1 was performed, and maximum projection images for ZO-1 signals were transferred to grayscale in ImageJ. The polygonal area surrounded by the white line was measured as the area per cell. (C) Histograms of the area per cell for WT and KO cells are shown. (D) Comparison of the mean area per cell is shown. (E) Histograms of the perimeter per cell of WT and KO cells are shown. (F) Comparison of the mean perimeter per cell (WT, n = 827; KO, n = 918 in C–F). Data are shown as the mean ± SEM. *P < 0.05 (Student's t test).
Cell Death Detection by Ethidium Homodimer III Staining
We modified the method used by Kimura et al.,14 and cell death detection was performed according to the instructions for the Apoptotic/Necrotic/Healthy Cells Detection Kit (PK-CA707-30018; Promocell, Germany). Briefly, WT and KCNJ13 KO hiPSC-RPE cells (12-well Transwells, 0.4 µm) were seeded at 5 × 10⁵ cells/well and cultured for four weeks. The cells were washed twice with binding buffer. We incubated the cells in staining solution (200 µM ethidium homodimer III, 500 µg/mL Hoechst 33342) for 15 minutes at room temperature and washed the cells with binding buffer one or two times. The RPE cells were placed under a coverslip and observed using an LSM 780 confocal microscope equipped with ZEN 2009 software.
LDH Assay
Cell death assays were performed using a Cytotoxicity Detection Kit plus (LDH) (Roche, Switzerland) (Supplementary Methods).
Scanning Electron Microscopy
Samples were treated with a modified method used by Shahi et al.15 and Kanzaki et al (Supplementary Methods).5 The hiPSC-RPE cells were visualized with a scanning electron microscope (SEM) (S-4800; Hitachi, Tokyo, Japan).
Quantitative Analysis of Gene Expression by qRT–PCR
Quantitative real-time PCR (qRT-PCR) was performed as previously described.5 Briefly, mRNA was isolated from hiPSC-RPE cells, cDNA was synthesized by standard procedures, and qRT-PCR was performed according to the manufacturer's instructions (StepOne; ThermoFisher, St. Louis, MO, USA). The qRT–PCR primers used to amplify the oxidative stress marker genes and internal standard, 18S ribosomal RNA (18S rRNA), were listed in Table.
Table.
Sequences of Primers Used
| Gene Symbol | Gene Name | Forward | Reverse | Amplicon Size (bp) |
|---|---|---|---|---|
| CAT | Catalase | tcatcagggatcccatattgtt | ccttcagatgtgtctctgaggattt | 72 |
| CLCN2 | Chloride voltage-gated channel 2 (ClC2) | catcgagggctctgtcaca | attggcatttgtcgtcgctg | 181 |
| FATP2 | Fatty acid transport protein 2 | cgccagacgccacacaagccttt | cagggacttcgcgcggatgttgt | 239 |
| FATP4 | Fatty acid transport protein 4 | tgctgcatggcatgacggtggtg | tggggtatgtggaagcggctgga | 231 |
| GCLC | Glutamate-cysteine ligase catalytic subunit | ggcgatgaggtggaatac | aaagggtaggatggtttgg | 135 |
| GPX1 | Glutathione peroxidase 1 | caaccagtttgggcatcag | gttcacctcgcacttctcg | 139 |
| GPX4 | Glutathione peroxidase 4 | gcacatggttaacctggaca | ctgcttcccgaactggttac | 171 |
| GSR | Glutathione-disulfide reductase | tgccagcttaggaataaccag | cctgcaccaacaatgacg | 82 |
| HMOX1 | Heme oxygenase 1 | ggcagagggtgatagaagagg | agctcctgcaactcctcaaa | 72 |
| SLC2A1 | Solute carrier family 2 member 1 | ctggcatcaacgctgtcttc | gttgacgataccggagccaa | 97 |
| SLC7A11 | Solute carrier family 7 member 11 (xCT) | tcattggagcaggaatcttca | ttcagcataagacaaagctcca | 127 |
| SOD1 | Superoxide dismutase 1 | tcatcaatttcgagcagaagg | caggccttcagtccttt | 77 |
| SOD2 | Superoxide dismutase 2 | cgtgactttggttcctttgac | agtgtccccgttccttattga | 108 |
| STRA6 | Signaling receptor and transporter of retinol | acactccacagccaggattc | gccagcaggtaggagacatc | 162 |
| 18S rRNA | 18s ribosomal RNA | gtaacccgttgaaccccatt | ccatccaatcggtagtaggg | 150 |
Glutathione Assay
The hiPSC-RPE cells were seeded in six-well plates at 2 × 10⁶ cells/well. Cells were treated with t-BHP as described below and washed with PBS to quantify the amount of oxidized glutathione (GSSG) or GSSG/reduced glutathione (GSH) with a Glutathione Quantification Kit (Dojindo Molecular Technologies, Inc., Kumamoto, Japan). A portion of the harvested cells was lysed in lysis buffer (Tris-HCl 50 mM pH 7.6, CaCl2 5 mM, NaCl 150 mM, 0.02% NaN3, 1% Triton X-100) and clarified with centrifugation. The supernatant was collected, and the protein concentration was determined with the Lowry method.
Western Blot Analysis
Western blot analysis was performed according to previous studies.5,16,17 Primary antibodies used were as follows: anti-Keap1 (1:1000; Cell Signaling Technology, Danvers, MA, USA), anti-xCT (1:1000; Cell Signaling Technology), and anti-cyclophilin B (1:1000; Cell Signaling Technology).
T-BHP Treatment and MTS Assay
The hiPSC-RPE cells were seeded in 96-well plates at a density of 1 × 10⁵ cells/well and cultured for four weeks. The medium (SFRM supplemented with FGF2 and SB431542) was then removed; 0 mM, 1.5 mM, 5 mM, or 15 mM tert-butyl-hydroperoxide (t-BHP) (Sigma–Aldrich Corp., St. Louis, MO, USA) was added to SFRM; and the cells were treated for one hour on days 1-5. The cells were washed with medium (SFRM supplemented with FGF2 and SB431542) after t-BHP treatment. The cytotoxicity test was performed on Day 8 using MTS (CellTiter 96; Promega Corporation, Madison, WI, USA).18
Statistics
Statistical analysis was performed using SPSS Statistics (IBM, Armonk, NY, USA). Unpaired Student's t test was employed for the following: Comparison of cell area and perimeter between WT and KCNJ13 KO hiPSC-RPE cells, comparison of the percentage of ethidium homodimer III-positive cells per field of view, comparison of the percentage of ethidium homodimer III–positive cells at protruding sites, LDH assay analysis, comparison of the relative expression level of each gene in qPCR, comparison of each protein expression in Western blot analysis, and comparison of total glutathione. One-way ANOVA followed by Tukey test was used for comparative analysis of MTS assay results after t-BHP treatment, the amount of GSSG, the amount of reduced GSH and comparison of each gene in qPCR in cells stimulated with various concentrations of t-BHP. P < 0.05 indicated significance.
Results
Increased Cell Size of the KCNJ13 KO hiPSC-RPE
KCNJ13 KO hiPSC-RPE cells arrange in a single layer of sheets, causing morphological abnormalities where some cells protrude.5 To verify whether morphological changes occurred in individual cells as well as in the protruded regions in KCNJ13 KO cells, the area and perimeter of the cells marked by the ZO-1 signal were analyzed. The histogram peaks for cell area and perimeter (Figs. 1C, 1E, respectively) in the KO cells were shifted to the right of that observed for the wild-type cells. In addition, KCNJ13 KO hiPSC-RPE cells had significantly larger mean area and perimeter than those of wild-type hiPSC-RPE cells (area, WT: 116.85 ± 1.64 µm2, KO: 140.82 ± 2.06 µm2; perimeter, WT: 44.76 ± 0.34 µm, KO: 49.58 ± 0.41 µm; P < 0.001 for both) (Figs. 1D, 1F).
Protruding KCNJ13 KO RPE Cells Undergo Cell Death
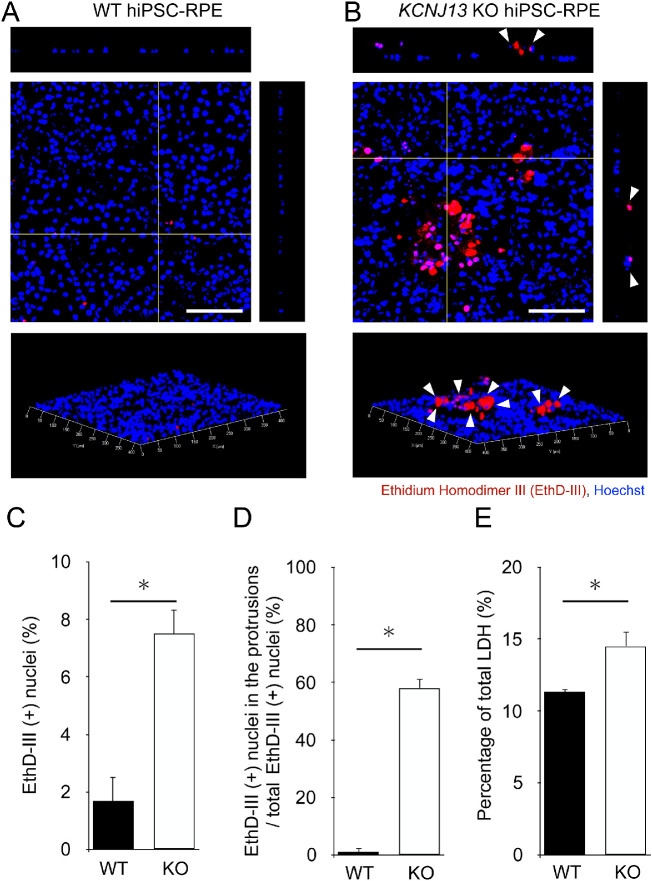
A single RPE cell layer is known to increase in size when cell death is induced for living cells to maintain the integrity of the monolayer.6 Therefore there is a possibility that morphological changes in KCNJ13 KO hiPSC-RPE reflect cell death. To test this hypothesis, we analyzed whether there was a difference in the amount and rate of cell death between the two genotypes. The hiPSC-RPE cells stained with ethidium homodimer III and Hoechst 33342 showed few ethidium homodimer III-positive cells in the WT (Fig. 2A). In KCNJ13 KO cells, ethidium homodimer III-positive cells were present among the protruding cells (white arrowheads in Fig. 2B), and the cell nuclei in the protrusions were stained (Supplementary Fig. S2B). The percentage of ethidium homodimer III-positive cells among the total cells was significantly higher in KCNJ13 KO hiPSC-RPE cells than in WT cells (WT: 1.68% ± 0.85%, KO: 7.51% ± 0.82%, P = 0.010, Fig. 2C). Furthermore, the percentage of ethidium homodimer III-positive cells in the protrusions was significantly higher in KCNJ13 KO hiPSC-RPE cells (WT: 1.11% ± 1.11%, KO: 58.10% ± 3.24%, P = 0.008, Fig. 2D). Because the RPE is capable of phagocytosis and dead cells do not always remain persistently, we further analyzed the induction of cell death using the LDH assay, which measures the amount of LDH released on cell lysis and from damaged cells. The KO cell population released a significantly greater amount of LDH (WT: 11.30% ± 0.20%, KO: 14.51% ± 1.01%; P = 0.020; Fig. 2E). These results indicated that cell death occurred at the protrusion in KCNJ13 KO iPS-RPE cells.
Figure 2.
Numbers of dead cells are increased in the KCNJ13 KO RPE. (A, B) Ethidium homodimer III staining (red) of WT and KO hiPSC-RPE cells. Nuclei were stained with Hoechst 33342 (blue). In KO RPE cells, ethidium homodimer III–positive cells were prominently observed (white arrowheads). (C) Percentage of ethidium homodimer III–positive cells in the total number of RPE cells per area. (D) Percentage of ethidium homodimer III-positive cells present at the site of protrusion in the total number of ethidium homodimer III-positive cells per area. (E) The percentage of total LDH was calculated by comparing the levels of released LDH in the experimental samples to the total levels of lysed WT cells (positive control, set to 100%). (n = 3 for each genotype in C, D; n = 4 for each in E). Data are shown as the mean ± SEM. *P < 0.05 (Student's t test). Scale bars: 100 µm.
KCNJ13 KO hiPSC-RPE Cells at the Protruded Region have Abnormal Cell Surfaces
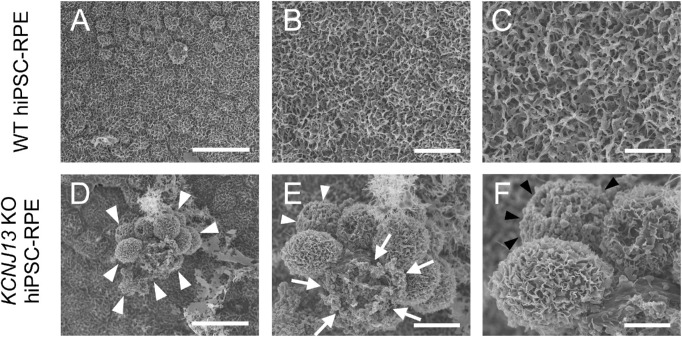
To observe how morphological abnormalities were occurring in the cells of the protrusion, the cell surface was visualized using SEM. WT hiPSC-RPE cells showed polygonal morphology, with microvilli developing on the surface and the apical side of the cell (Figs. 3A–3C, Supplementary Figs. S3A, S3B). In contrast, a part of KO RPE showed some protruding cell clumps (arrowheads in Fig. 3D), some without microvilli, and some cells that appeared to have died (arrows in Fig. 3E) or lost intercellular adhesion with blood cell-like appearance (arrowheads in Figs. 3E, 3F).
Figure 3.
Scanning electron microscopy (SEM) of the apical surface of WT and KCNJ13 KO RPE. (A–C) SEM images of WT hiPSC-RPE cells. (D–F) SEM images of KCNJ13 KO hiPSC-RPE cells. (A) The cell shape of WT hiPSC-RPE cells is polygonal, and the cells exhibit a paving stone-like arrangement. (B, C) Enlarged images for (A, B), respectively. Well-developed microvilli are seen on the cell surface. (D) KCNJ13 KO hiPSC-RPE sheet has a partially protruding cell aggregate (white arrowheads). (E, F) Enlarged images for (D, E), respectively. Scale bars: 25 µm (A, D), 10 µm (B, E), 5 µm (C, F).
Although cell death occurred in a portion of the RPE, TEER measurements showed that the permeability of the cell sheet did not increase, but rather decreased, suggesting that the barrier function was enhanced (Supplementary Fig. S4). Next, the effect of RPE on transepithelial transport properties, another important function of RPE, was investigated by analyzing the expression of following genes: CLCN2 was significantly downregulated in KO cells, whereas STRA6,19 FATP2, FATP4,20 and SLC2A121 were not significantly changed (Supplementary Figs. S5 and S6).
Antioxidative Responses Observed in KCNJ13 KO hiPSC-RPE Cells
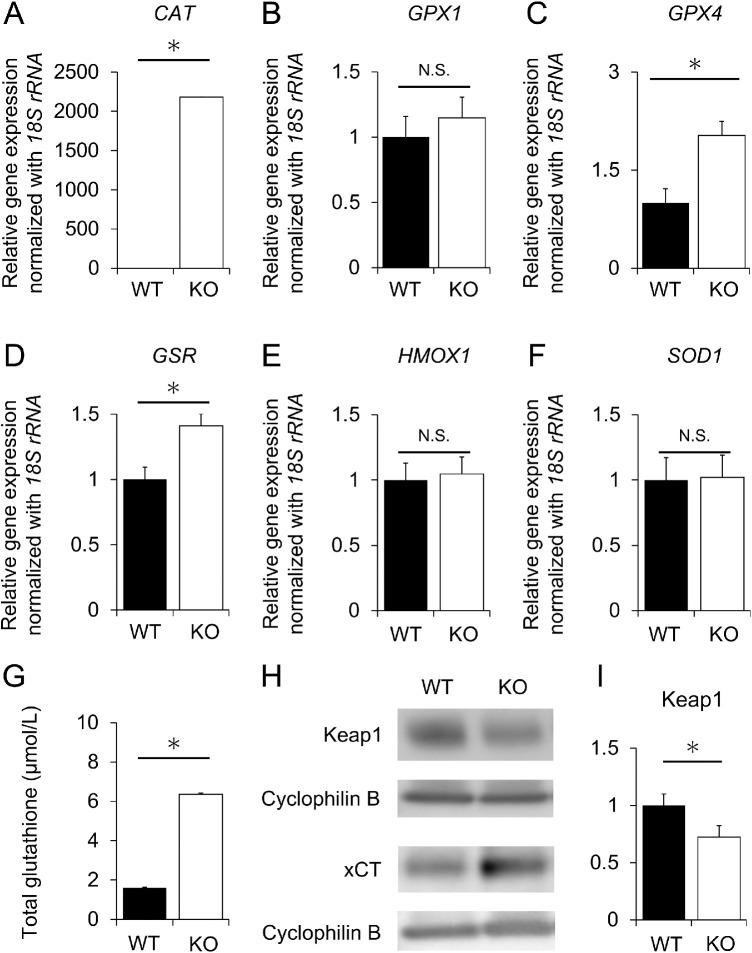
To investigate the possible involvement of oxidative stress in cell death, qRT-PCR was performed to determine the levels of six oxidative stress marker genes: CAT,22–25 GPX1,26 GPX4,27 GSR,28 HMOX1,29 and SOD1 (Supplementary Fig. S7).30 The expression levels of CAT, GPX4 and GSR genes were significantly higher in the KO than in WT hiPSC-RPE cells (P < 0.001, P = 0.011, and P = 0.009, respectively, Figs. 4A, 4C, and 4D), while those of GPX1, HMOX1, and SOD1 showed no significant change (P = 0.402, P = 0.783 and P = 0.921, respectively, Figs. 4B, 4E, and 4F). Furthermore, the level of total glutathione was significantly higher in KCNJ13 KO hiPSC-RPE cells than in WT hiPSC-RPE cells (WT: 1.60 ± 0.27 µmol/L, KO: 6.36 ± 0.62 µmol/L, P < 0.001) (Fig. 4G). Western blot analysis showed that Keap1 protein expression was decreased and xCT protein expression was increased in KO cells (Keap1, WT: 1 ± 0.10, KO: 0.73 ± 0.08, P = 0.030) (Figs. 4H, 4I). These results suggest that oxidative stress is induced in KCNJ13-deficient RPE cells.
Figure 4.
Expression of oxidative stress marker genes in WT and KO RPE as revealed by qPCR, glutathione assay and Western blotting. Relative expression levels of CAT (A), GPX1 (B), GPX4 (C), GSR (D), HMOX1 (E), and SOD1 (F). 18S rRNA was used as an internal control. The expression level of each gene in WT hiPSC-RPE cells was set as 1. (G) Quantitative comparison of total glutathione levels. (H, I) Protein expression of Keap 1 and xCT. (n = 6, each for WT or KO in A-F, n = 3, each for WT and KO in G, n = 7 each for WT or KO in I). Data are shown as the mean ± SEM. *P < 0.05 (Student's t test). N.S., not significant.
Oxidative Stress Tolerance is Decreased in KCNJ13 KO hiPSC-RPE Cells
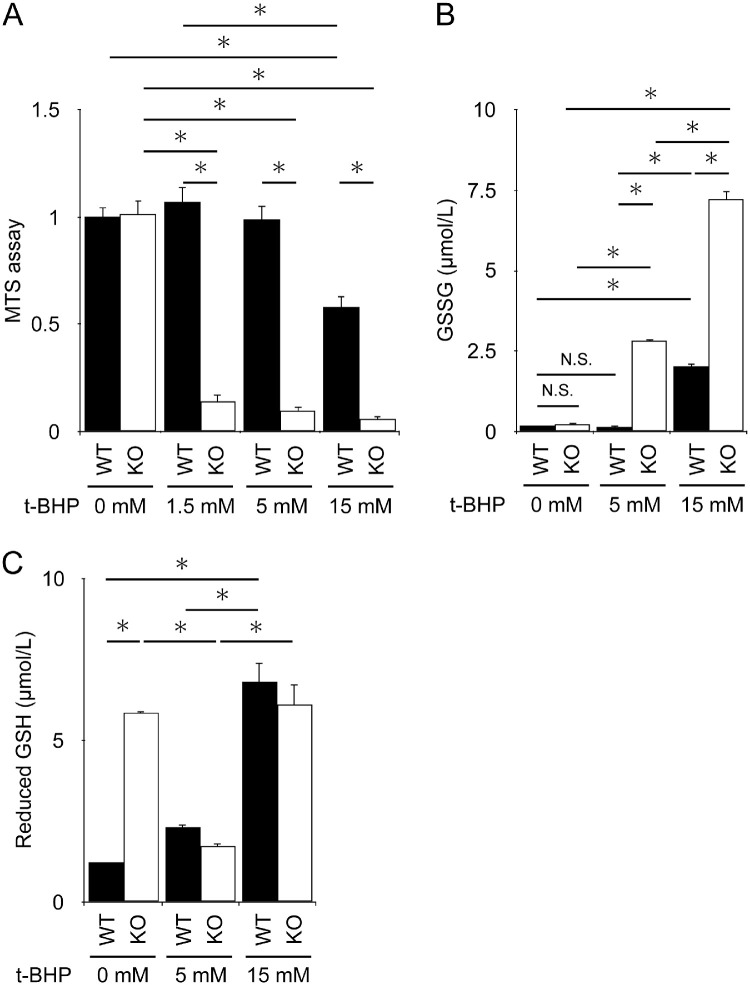
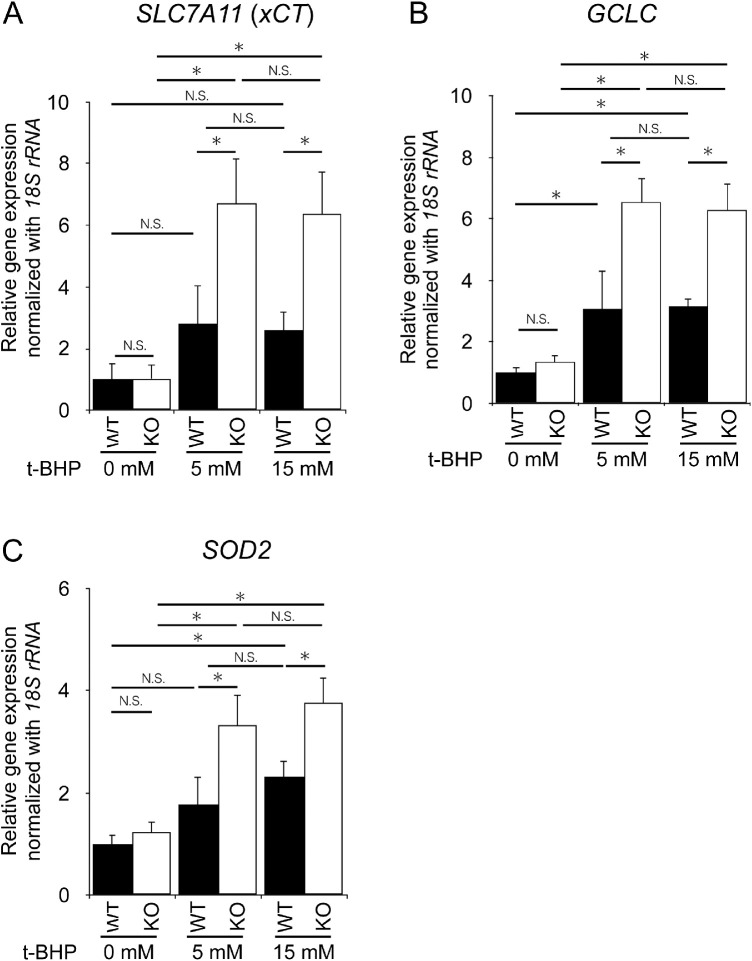
To examine whether there is a difference in response to induced oxidative damage between WT and KO cells, both hiPSC-RPE cells were treated with various concentrations of t-BHP, and the number of viable cells was counted. The MTS assay showed that viable cell counts were reduced in a t-BHP dose-dependent manner in both genotypes. However, they were significantly lower in KO cells than in WT cells at all concentrations (Fig. 5A). The levels of GSSG were not increased at a concentration of 5 mM t-BHP in WT cells, whereas they were significantly increased in KO cells (Fig. 5B). Reduced GSH levels were significantly higher even in untreated KCNJ13 KO-hiPSC-RPE cells than in WT cells. At 5 mM (Fig. 5C), reduced GSH levels were significantly decreased in KO cells, which is likely attributed to its conversion to GSSG by higher oxidative stress (Fig. 5B). In contrast, 15 mM t-BHP increased both GSSG and reduced GSH levels, indicating a strong induction of GSH by an increased antioxidant response and its oxidation in both WT and KO cells (Figs. 5B, 5C). Notably, GSSG was induced approximately threefold more in KO cells than in WT cells (Fig. 5B). Gene expression in RPE cells stimulated with various concentrations of t-BHP was further analyzed. There was no difference in SLC7A11, GCLC, and SOD2 expression between WT and KO RPE without stimulation. However, when stimulated with 5 mM or 15 mM t-BHP, SLC7A11, GCLC, and SOD2 gene expression was significantly increased in KO cells (Fig. 6). These results indicate that antioxidant response and cell death are strongly induced by t-BHP in KO cells compared to WT cells, implying that KO cells are more susceptible to oxidative stress than WT cells.
Figure 5.
Increased cell death and glutathione levels in KCNJ13 KO RPE during t-BHP-induced oxidative stress. (A) Average absorbance results of MTS assay. WT samples without t-BHP treatment (0 mM) were set as 1 for the mean absorbance value. (B, C) The level of GSSG (B) and GSH (C) upon t-BHP treatment. (n = 6 each for WT or KO in A, n = 3 each for WT or KO in B, C). Data are shown as the mean ± SEM. *P < 0.05 (one-way ANOVA followed by the Tukey test).
Figure 6.
Changes in antioxidant gene expression during t-BHP-induced oxidative stress. Relative expression levels of SLC7A11 (A), GCLC (B), and SOD2 (C). The 18S rRNA was used as an internal control. The expression level of each gene in WT hiPSC-RPE cells was set as 1 (n = 4, each for WT or KO in A-C). Data are shown as the mean ± SEM. *P < 0.05 (one-way ANOVA followed by the Tukey test).
Discussion
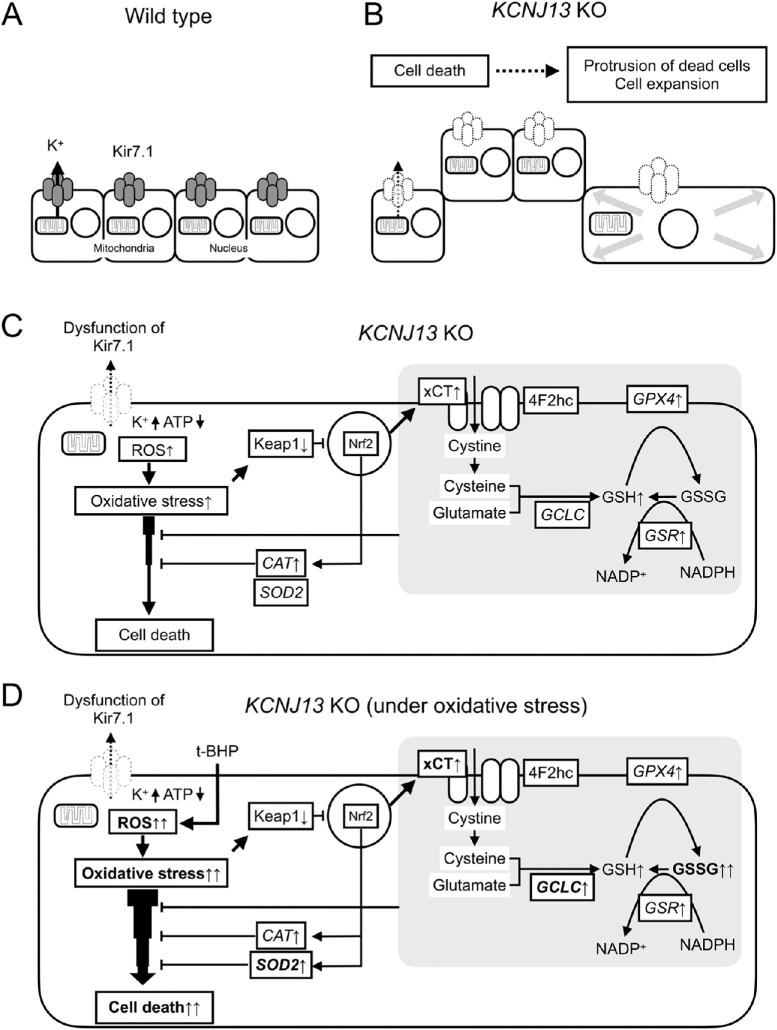
In this study, the following three findings were obtained: (1) KCNJ13 gene deletion leads to abnormal cell morphology, (2) dead cells exist in the protruded region of KCNJ13 KO hiPSC-RPE cells, (3) KCNJ13 KO cells are subjected to oxidative stress and exhibit increased expression of antioxidant genes, and KCNJ13 KO RPE cells are vulnerable to oxidative stress. These results support our hypothesis that vulnerability to oxidative stress due to KCNJ13 gene deletion is responsible for cell protrusion and cell death in the RPE (Fig. 7).
Figure 7.
Possible mechanisms of cell death and morphological changes in KCNJ13 KO RPE. Cell alignment of WT (A) and KCNJ13 KO (B) RPE. (B) Dead/dying cells are excluded from the RPE in a sheet-like arrangement and exhibit a protruding morphology. Expansion of cells around the protruding cells occurs. (C) Loss of Kir7.1 likely results in reduced mitochondrial ATP and induction of oxidative stress in the cell, leading to cell death. (D) KCNJ13 KO RPE under oxidative stress. Antioxidant response and cell death are strongly induced by oxidative stress in KO cells compared to WT cells, suggesting that KO RPE is more susceptible to oxidative stress than WT cells.
Dead RPE cells are extruded from the monolayer, and the surrounding cells promote hypertrophy.6,7 The enlarged surrounding cells ultimately replace the lost cells. These previous findings are consistent with this study, and collectively it is supported that cell death may be involved in the morphological abnormalities in KCNJ13 KO RPE. In this regard, cells have interactions called cell competition that eliminate less-fit loser cells from the surrounding winner cells.31 What triggers cell competition in the KCNJ13 KO RPE cell population is not certain. The main driver of cell competition is thought to be heterogeneity in fitness, with which proliferative activity correlates.32 On the other hand, it is known that nonneural bioelectric signaling via potassium channels can control cellular growth rates.33 Mamaeva et al.34 showed the localization of potassium channels Kir4.1 and Maxi-K in addition to Kir7.1 within the human iPSC-derived RPE sheet and the heterogeneity of their distributions. It is tempting to speculate that mosaic differences in the concentration of cytoplasmic potassium ions would trigger cell competition among the KCNJ13 KO RPE population. In addition, as we reported previously,5 some cells in the protruding region underwent epithelial-mesenchymal transition, which may have also contributed to the morphological change. On the other hand, surprisingly, TEER was significantly increased in KO cells (Supplementary Fig. S4), indicating that barrier function was increased rather than decreased. This suggests that intercellular adhesion might be enhanced in KO cells, but further analysis is required. Taken together, these findings suggest that KCNJ13 KO RPE cells are predisposed to cell death and that the resulting cell death is responsible for the protruding cell morphology. This result would be supported by electron microscopic images of disrupted cell surfaces with disintegrated microvilli.
This study suggests that KCNJ13 KO RPE may be exposed to an oxidative stress other than physiological stress; the KO RPE had increased transcription levels of CAT, GSR, and GPX4, as well as in the levels of total glutathione. In addition, Keap1 protein expression was decreased and xCT protein expression was increased in the KO cells (Fig. 4). CAT,22–25 GSR,28 and GPX427 are enzymes involved in the antioxidant activities of the RPE and have been reported to be upregulated when oxidative stress occurs in the RPE.28 Keap1 is the regulatory protein of transcription factor Nrf2, the master regulator of antioxidant response. When oxidant stress is applied, Keap1 expression is decreased and Nrf2 is translocated to nuclei, and various antioxidant pathways are activated.35–38 SLC7A11 is a downstream gene of the Keap1-Nrf2 system and encodes xCT, a light-chain subunit of the cystine/glutamate transporter involved in the production of glutathione.39,40 Besides, in the t-BHP-treated KO RPE, oxidative stress is enhanced and the expression levels of the CAT gene are upregulated.25 RPE consumes GSH to alleviate oxidative stress when it occurs. Correspondingly, RPE increases the synthesis of glutathione.26 Taken together, our present study suggests that in the absence of KCNJ13, the RPE is being exposed to oxidative stress. According to Toms et al.,9 kcnj13 KO zebrafish exhibit increased expression levels of the oxidative stress markers sod1 and sod2, indicating an increase in reactive oxygen species (ROS). This finding is similar to those of the present study in that antioxidant enzymes are upregulated. Because Kir7.1 mediates efflux of potassium ions from the cytoplasm to the apical extracellular space of the RPE, KCNJ13 KO hiPSC-RPE likely has an excess amount of potassium ions in the cell. It has been reported that mitochondria have potassium ion channels and that ROS are produced by the influx of potassium ions into mitochondria.41,42 Therefore the influx of excess intracellular potassium ions into the mitochondria may likely induce oxidative stress in the RPE, in which mitochondria are abundant.38 However, no morphological abnormalities were observed in the mitochondria of an LCA16 (p.W53*) patient-derived iPS-RPE.15 Further analysis of morphology and function of mitochondria in our KCNJ13-deficient (p.D50fs/R52fs) hiPSC-RPE is warranted.5 Furthermore, ATP levels are reduced in the kcnj13 mutant retina9 and ATP reduction in the RPE leads to ROS production.43 In addition, the loss of Kir7.1 might lead to higher ATP consumption by the Na+/K+-ATPase itself because the enzyme has to transport against a K+ gradient plus the Na+ gradient.9 The relationship between Kir7.1 and Na-K ATPase requires further analysis. Taken together, one cause of the oxidative stress condition in KCNJ13 KO RPE may be the depletion of mitochondrial ATP and induction of ROS production, beginning with the accumulation of intracellular potassium ions due to defective potassium efflux.
It is widely known that t-BHP induces oxidative stress when added to the RPE.25,44,45 Our results (Figs. 5, 6) showed that KNCJ13 KO RPE cells are susceptible to cell death in response to chemical oxidative stress, implying their vulnerability to oxidative stress initiated by light.38 GSSG is significantly increased in RPE stimulated with t-BHP. In KCNJ13 KO RPE, the expression of antioxidant genes SLC7A11,39,40 GCLC,38 and SOD29,26 were significantly increased compared to wild-type RPE with the same level of oxidative stimulation. This may indicate that KO RPEs suffer more severe intracellular oxidative stress in response to the same intensity of oxidative stimulation compared to wild-type RPE. Because the RPE is juxtaposed to choroidal circulation containing oxygen from which free radicals are produced upon light irradiation,46 it is constantly exposed to oxidative stress. The RPE undergoes cell death when subjected to oxidative stress.25,44,45,47,48 Because the RPE is constantly under oxidative stress due to KCNJ13 gene deletion as described above, cell death may occur when extra oxidative stress is added during physiological metabolism. It has been reported that oxidative stress in the RPE induces necrosis49–51 and apoptosis.52–54 Because ethidium homodimer III stains cells in necrosis or late apoptosis, it is assumed that necrosis or late apoptosis occurs in the absence of KCNJ13. On the other hand, the loss of Kir7.1 channel function will depolarize RPE cells, which would lead to cell death.15 The relationship between depolarization and cell death requires further investigation.
Limitations of this study are as follows. Truncated Kir7.1 protein expressed in KCNJ13 KO cells in this study is similar to that of an LCA16 patient (p.W53∗) reported by Pattnaik et al.2 and may exhibit a similar phenotype. However, the types of genetic mutations in LCA16 vary1 and not all of them are reproduced. In addition, it is not suitable to apply this cell to readthrough drug therapy, and we can only analyze pathological conditions at the protein level in this experimental system.
In summary, KCNJ13 gene deletion makes the RPE less tolerant to oxidative stress and more prone to cell death when the RPE is subjected to oxidative stress inducers. It is suggested that the resulting dead and dying cells are eliminated from the monolayer, some of which show protruding morphology, and the surrounding RPE cells are enlarged.
Supplementary Material
Acknowledgments
The authors thank Kumiko Kikuchi and Shiori Ikeda for technical laboratory assistance and Central Research Laboratory, Okayama University Medical School for confocal laser microscopy and scanning electron microscopy.
Supported by grants from JSPS KAKENHI [19K09625](to H.F.), [19K18878](to M.H.), [21K09700](to Y.M.), and [20K21655](to H.O.).
Disclosure: Y. Kanzaki, None; H. Fujita, None; K. Sato, None; M. Hosokawa, None; H. Matsumae, None; Y. Morizane, None; H. Ohuchi, None
References
- 1. Sergouniotis PI, Davidson AE, Mackay DS, et al.. Recessive mutations in KCNJ13, encoding an inwardly rectifying potassium channel subunit, cause leber congenital amaurosis. Am J Hum Genet. 2011; 89: 183–190. [DOI] [PMC free article] [PubMed] [Google Scholar]
- 2. Pattnaik BR, Shahi PK, Marino MJ, et al.. A novel KCNJ13 nonsense mutation and loss of Kir7.1 channel function causes leber congenital amaurosis (LCA16). Hum Mutat. 2015; 36: 720–727. [DOI] [PubMed] [Google Scholar]
- 3. Perez-Roustit S, Marquette V, Bocquet B, et al.. Leber congenital amaurosis with large retinal pigment clumps caused by compound heterozygous mutations in KCNJ13. Retin Cases Brief Rep. 2017; 11: 221–226. [DOI] [PubMed] [Google Scholar]
- 4. Khan AO, Bergmann C, Neuhaus C, Bolz HJ.. A distinct vitreo-retinal dystrophy with early-onset cataract from recessive KCNJ13 mutations. Ophthalmic Genet. 2015; 36: 79–84. [DOI] [PubMed] [Google Scholar]
- 5. Kanzaki Y, Fujita H, Sato K, et al.. KCNJ13 gene deletion impairs cell alignment and phagocytosis in retinal pigment epithelium derived from human-induced pluripotent stem cells. Invest Opthalmol Vis Sci. 2020; 61: 38. [DOI] [PMC free article] [PubMed] [Google Scholar]
- 6. Longbottom R, Fruttiger M, Douglas RH, Martinez-Barbera JP, Greenwood J, Moss SE.. Genetic ablation of retinal pigment epithelial cells reveals the adaptive response of the epithelium and impact on photoreceptors. Proc Natl Acad Sci USA. 2009; 106: 18728–18733. [DOI] [PMC free article] [PubMed] [Google Scholar]
- 7. Rosenblatt J, Raff MC, Cramer LP.. An epithelial cell destined for apoptosis signals its neighbors to extrude it by an actin- and myosin-dependent mechanism. Curr Biol. 2001; 11: 1847–1857. [DOI] [PubMed] [Google Scholar]
- 8. Jiang Y, Qi X, Chrenek MA, et al.. Analysis of mouse RPE sheet morphology gives discriminatory categories. Adv Exp Med Biol. 2014; 801: 601–607. [DOI] [PMC free article] [PubMed] [Google Scholar]
- 9. Toms M, Burgoyne T, Tracey-White D, et al.. Phagosomal and mitochondrial alterations in RPE may contribute to KCNJ13 retinopathy. Sci Rep. 2019; 9: 3793. [DOI] [PMC free article] [PubMed] [Google Scholar]
- 10. Álvarez-Barrios A, Álvarez L, García M, Artime E, Pereiro R, González-Iglesias H.. Antioxidant defenses in the human eye: a focus on metallothioneins. Antioxidants (Basel). 2021; 10: 89. [DOI] [PMC free article] [PubMed] [Google Scholar]
- 11. Handa JT. How does the macula protect itself from oxidative stress? Mol Aspects Med. 2012; 33: 418–435. [DOI] [PMC free article] [PubMed] [Google Scholar]
- 12. Sternberg P, Davidson PC, Jones DP, Hagen TM, Reed RL, Drews- Botsch C.. Protection of retinal pigment epithelium from oxidative injury by glutathione and precursors. Invest Ophthalmol Vis Sci. 1993; 34: 3661–3668. [PubMed] [Google Scholar]
- 13. Kosmidou C, Efstathiou NE, Hoang MV, et al.. Issues with the specificity of immunological reagents for NLRP3: implications for age-related macular degeneration. Sci Rep. 2018; 8: 461. [DOI] [PMC free article] [PubMed] [Google Scholar]
- 14. Kimura S, Morizane Y, Toshima S, et al.. Cytotoxic effects of alteplase, a recombinant tissue plasminogen activator, on human retinal pigment epithelial cells. Jpn J Ophthalmol. 2021; 65: 731–739. [DOI] [PubMed] [Google Scholar]
- 15. Shahi PK, Hermans D, Sinha D, et al.. Gene augmentation and readthrough rescue channelopathy in an iPSC-RPE model of congenital blindness. Am J Hum Genet. 2019; 104: 310–318. [DOI] [PMC free article] [PubMed] [Google Scholar]
- 16. Matoba R, Morizane Y, Shiode Y, et al.. Suppressive effect of AMP-activated protein kinase on the epithelial-mesenchymal transition in retinal pigment epithelial cells. PLoS One. 2017; 12(7): e0181481. [DOI] [PMC free article] [PubMed] [Google Scholar]
- 17. Morizane Y, Thanos A, Murakami Y, et al.. AMP-activated protein kinase suppresses matrix metalloproteinase-9 expression in mouse embryonic. 2011; 286: 16030–16038. [DOI] [PMC free article] [PubMed] [Google Scholar]
- 18. Rabin DM, Rabin RL, Blenkinsop TA, Temple S, Stern JH.. Chronic oxidative stress upregulates drusen-related protein expression in adult human RPE stem cell-derived RPE cells: a novel culture model for dry AMD. Aging (Albany NY). 2013; 5: 51–66. [DOI] [PMC free article] [PubMed] [Google Scholar]
- 19. Harrison EH. Mechanisms of transport and delivery of vitamin A and carotenoids to the retinal pigment epithelium. Mol Nutr Food Res. 2019; 63(15): 1–7. [DOI] [PubMed] [Google Scholar]
- 20. Tachikawa M, ichi Akanuma S, Imai T, et al.. Multiple cellular transport and binding processes of unesterified docosahexaenoic acid in outer blood–retinal barrier retinal pigment epithelial cells. Biol Pharm Bull. 2018; 41: 1384–1392. [DOI] [PubMed] [Google Scholar]
- 21. Senanayake P de S, Calabro A, Hu JG, et al.. Glucose utilization by the retinal pigment epithelium: Evidence for rapid uptake and storage in glycogen, followed by glycogen utilization. Exp Eye Res. 2006; 83: 235–246. [DOI] [PubMed] [Google Scholar]
- 22. Tate DJ, Miceli M V., Newsome DA.. Phagocytosis and H2O2 induce catalase and metallothionein gene expression in human retinal pigment epithelial cells. Invest Ophthalmol Vis Sci. 1995; 36: 1271–1279. [PubMed] [Google Scholar]
- 23. Liles MR, Newsome DA, Oliver PD.. Antioxidant enzymes in the aging human retinal pigment epithelium. Arch Ophthalmol. 1991; 109: 1285–1288. [DOI] [PubMed] [Google Scholar]
- 24. Miceli M V., Liles MR, Newsome DA.. Evaluation of oxidative processes in human pigment epithelial cells associated with retinal outer segment phagocytosis. Exp Cell Res. 1994; 214: 242–249. [DOI] [PubMed] [Google Scholar]
- 25. Cai H, Gong J, Abriola L, et al.. High-throughput screening identifies compounds that protect RPE cells from physiological stressors present in AMD. Exp Eye Res. 2019; 185(April): 107641. [DOI] [PubMed] [Google Scholar]
- 26. Marie M, Bigot K, Angebault C, et al.. Light action spectrum on oxidative stress and mitochondrial damage in A2E-loaded retinal pigment epithelium cells. Cell Death Dis. 2018; 9: 287. [DOI] [PMC free article] [PubMed] [Google Scholar]
- 27. Tong Y, Wang S.. Not all stressors are equal: mechanism of stressors on RPE cell degeneration. Front Cell Dev Biol. 2020; 8(Nov): 591067. [DOI] [PMC free article] [PubMed] [Google Scholar]
- 28. Hwang N, Kwon MY, Woo JM, Chung SW.. Oxidative stress-induced pentraxin 3 expression human retinal pigment epithelial cells is involved in the pathogenesis of age-related macular degeneration. Int J Mol Sci. 2019; 20(23): 1–12. [DOI] [PMC free article] [PubMed] [Google Scholar]
- 29. Homma K, Toda E, Osada H, et al.. Taurine rescues mitochondria-related metabolic impairments in the patient-derived induced pluripotent stem cells and epithelial-mesenchymal transition in the retinal pigment epithelium. Redox Biol. 2021; 41: 101921. [DOI] [PMC free article] [PubMed] [Google Scholar]
- 30. Zhong Y, Li J, Wang JJ, et al.. X-box binding protein 1 is essential for the anti-oxidant defense and cell survival in the retinal pigment epithelium. PLoS One. 2012; 7(6): e38616. [DOI] [PMC free article] [PubMed] [Google Scholar]
- 31. Ellis SJ, Gomez NC, Levorse J, Mertz AF, Ge Y, Fuchs E.. Distinct modes of cell competition shape mammalian tissue morphogenesis. Nature. 2019; 569(7757): 497–502. [DOI] [PMC free article] [PubMed] [Google Scholar]
- 32. Clavería C, Torres M.. Cell competition: mechanisms and physiological roles. Annu Rev Cell Dev Biol. 2016; 32: 411–439. [DOI] [PubMed] [Google Scholar]
- 33. Levin M. Bioelectric signaling: reprogrammable circuits underlying embryogenesis, regeneration, and cancer. Cell. 2021; 184: 1971–1989. [DOI] [PubMed] [Google Scholar]
- 34. Mamaeva D, Jazouli Z, DiFrancesco ML, et al.. Novel roles for voltage-gated T-type Ca2+ and ClC-2 channels in phagocytosis and angiogenic factor balance identified in human iPSC-derived RPE. FASEB J. 2021; 35: 1–18. [DOI] [PubMed] [Google Scholar]
- 35. Sachdeva MM, Cano M, Handa JT.. Nrf2 signaling is impaired in the aging RPE given an oxidative insult. Exp Eye Res. 2014; 119: 111–114. [DOI] [PMC free article] [PubMed] [Google Scholar]
- 36. Tonelli C, Chio IIC, Tuveson DA.. Transcriptional regulation by Nrf2. Antioxidants Redox Signal. 2018; 29(17): 1727–1745. [DOI] [PMC free article] [PubMed] [Google Scholar]
- 37. Ananth S, Miyauchi S, Thangaraju M, et al.. Selenomethionine (Se-Met) induces the cystine/glutamate exchanger SLC7A11 in cultured human retinal pigment epithelial (RPE) cells: implications for antioxidant therapy in aging retina. Antioxidants (Basel). 2020; 10: 1–17. [DOI] [PMC free article] [PubMed] [Google Scholar]
- 38. Plafker SM, O'Mealey GB, Szweda LI.. Mechanisms for countering oxidative stress and damage in retinal pigment epithelium. Int Rev Cell Mol Biol. 2012; 298: 135–177. [DOI] [PMC free article] [PubMed] [Google Scholar]
- 39. Koppula P, Zhang Y, Zhuang L, Gan B.. Amino acid transporter SLC7A11/xCT at the crossroads of regulating redox homeostasis and nutrient dependency of cancer. Cancer Commun. 2018; 38: 12. [DOI] [PMC free article] [PubMed] [Google Scholar]
- 40. Gnana-Prakasam JP, Thangaraju M, Liu K, et al.. Absence of iron-regulatory protein Hfe results in hyperproliferation of retinal pigment epithelium: Role of cystine/glutamate exchanger. Biochem J. 2009; 424: 243–252. [DOI] [PMC free article] [PubMed] [Google Scholar]
- 41. Andrukhiv A, Costa AD, West IC, Garlid KD.. Opening mitoKATP increases superoxide generation from complex I of the electron transport chain. Am J Physiol Heart Circ Physiol. 2006; 291: 2067–2074. [DOI] [PubMed] [Google Scholar]
- 42. Heinen A, Camara AKS, Aldakkak M, Rhodes SS, Riess ML, Stowe DF.. Mitochondrial Ca2+-induced K+ influx increases respiration and enhances ROS production while maintaining membrane potential. Am J Physiol Cell Physiol. 2007; 292: 148–156. [DOI] [PubMed] [Google Scholar]
- 43. Schütt F, Aretz S, Auffarth GU, Kopitz J.. Moderately reduced ATP levels promote oxidative stress and debilitate autophagic and phagocytic capacities in human RPE cells. Invest Ophthalmol Vis Sci. 2012; 53: 5354–5361. [DOI] [PubMed] [Google Scholar]
- 44. Sreekumar PG, Ishikawa K, Spee C, et al.. The mitochondrial-derived peptide humanin protects RPE cells from oxidative stress, senescence, and mitochondrial dysfunction. Invest Ophthalmol Vis Sci. 2016; 57: 1238–1253. [DOI] [PMC free article] [PubMed] [Google Scholar]
- 45. Wang H-J, Huang Y-W, Tobwala S, Pfaff A, Aronstam R, Ercal N.. The role of N-acetylcysteine amide in defending primary human retinal pigment epithelial cells against tert-butyl hydroperoxide- induced oxidative stress. Free Radicals Antioxid. 2017; 7: 172–177. [Google Scholar]
- 46. Rózanowska M, Jarvis-Evans J, Korytowski W, Boulton ME, Burke JM, Sarna T.. Blue light-induced reactivity of retinal age pigment. In vitro generation of oxygen-reactive species. J Biol Chem. 1995; 270: 18825–18830. [DOI] [PubMed] [Google Scholar]
- 47. Glotin AL, Calipel A, Brossas JY, Faussat AM, Tréton J, Mascarelli F.. Sustained versus transient ERK1/2 signaling underlies the anti- and proapoptotic effects of oxidative stress in human RPE cells. Invest Ophthalmol Vis Sci. 2006; 47: 4614–4623. [DOI] [PubMed] [Google Scholar]
- 48. Bailey TA, Kanuga N, Romero IA, Greenwood J, Luthert PJ, Cheetham ME.. Oxidative stress affects the junctional integrity of retinal pigment epithelial cells. Invest Ophthalmol Vis Sci. 2004; 45: 675–684. [DOI] [PubMed] [Google Scholar]
- 49. Hanus J, Zhang H, Wang Z, Liu Q, Zhou Q, Wang S.. Induction of necrotic cell death by oxidative stress in retinal pigment epithelial cells. Cell Death Dis. 2013; 4(12): 1–11. [DOI] [PMC free article] [PubMed] [Google Scholar]
- 50. Kim MH, Chung J, wook Yang J, Chung SM, Kwag NH, Yoo JS. Hydrogen peroxide-induced cell death in a human retinal pigment epithelial cell line, ARPE-19. Korean J Ophthalmol. 2003; 17: 19–28. [DOI] [PubMed] [Google Scholar]
- 51. Li GY, Fan B, Zheng YC.. Calcium overload is a critical step in programmed necrosis of ARPE-19 cells induced by high-concentration H2O2. Biomed Environ Sci. 2010; 23: 371–377. [DOI] [PubMed] [Google Scholar]
- 52. Szatmári-Tóth M, Ilmarinen T, Mikhailova A, et al.. Human embryonic stem cell-derived retinal pigment epithelium-role in dead cell clearance and inflammation. Int J Mol Sci. 2019; 20(4). [DOI] [PMC free article] [PubMed] [Google Scholar]
- 53. Liu L, wei Wu X. Nobiletin protects human retinal pigment epithelial cells from hydrogen peroxide–induced oxidative damage. J Biochem Mol Toxicol. 2018; 32(5): e22052. [DOI] [PubMed] [Google Scholar]
- 54. Kim JH, Kim JH, Jun HO, et al.. Protective effect of clusterin from oxidative stress-induced apoptosis in human retinal pigment epithelial cells. Invest Ophthalmol Vis Sci. 2010; 51: 561–566. [DOI] [PubMed] [Google Scholar]
Associated Data
This section collects any data citations, data availability statements, or supplementary materials included in this article.


