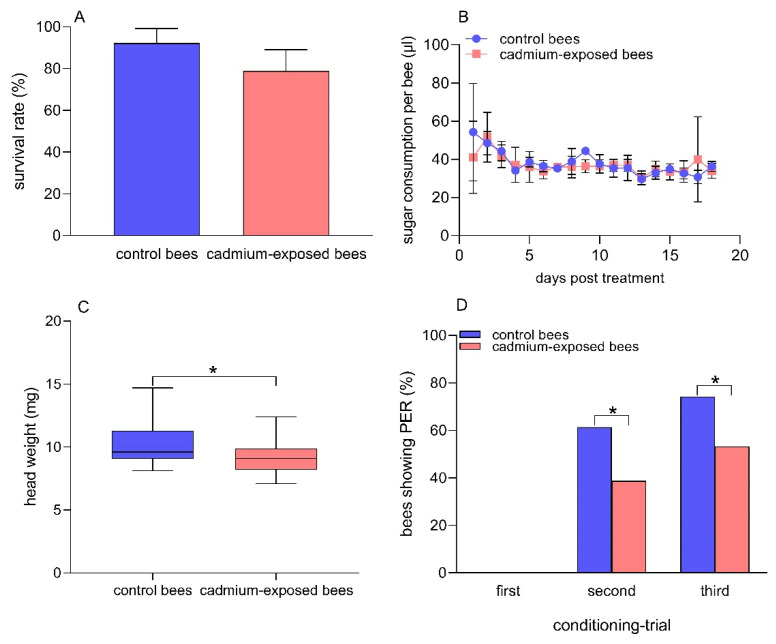
Figure 1.
Comparison between cadmium-exposed and control bees in survival rate (A) sugar consummation per bee; (B) head weight; (C) Student’s t-test, n = 21 in both groups of bees, and the percentage of bees showing PER when presented with the CS +, 1-nonanol; (D) Fisher’s exact test, n = 70 for control bees, n = 62 for cadmium-exposed bees after chronic Cd exposure. (*) p < 0.05.

