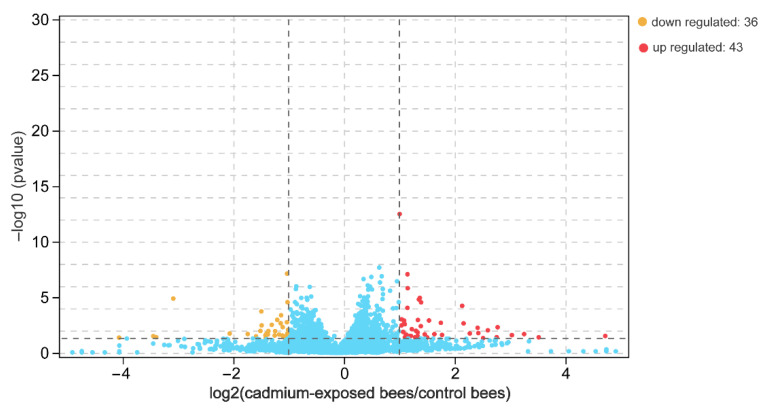
Figure 2.
Differentially expressed genes in the brain between cadmium-exposed bees and control bees based on a p-value < 0.05 and an absolute fold-change > 2. Red and yellow indicate the up- and downregulated genes in cadmium-exposed bees, respectively; blue indicates no differentially expressed genes.

