Background.
The COVID-19 pandemic is the first sustained respiratory disease pandemic to arise since the start of solid organ transplantation (SOT). Prior studies have demonstrated that SOT recipients are at greater risk for severe complications of infection and are less likely to respond to vaccination.
Methods.
The Scientific Registry of Transplant Recipients Standard Analysis Files was used to assess the cumulative excess mortality in SOT recipients during the first 20 mo of the pandemic.
Results.
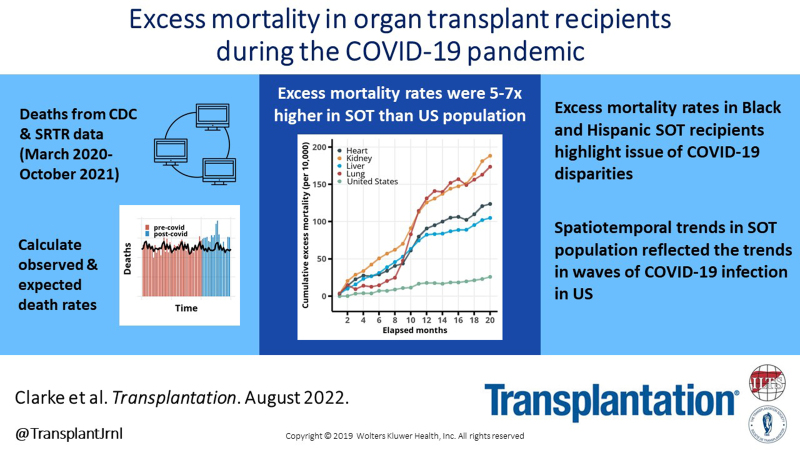
Compared with excess mortality rates in the US population (25.9 deaths/10 000; confidence interval [CI], 10.9-41.1), the excess mortality per 10 000 was higher in all SOT groups: kidney (188.5; CI, 150.7-225.6), lung (173.6; CI, 17-334.7), heart (123.7; CI, 56-191.4), and liver (105.1; CI, 64.6-146). The higher rates persisted even with attempts to control for population age structure and renal allograft failure. Excess mortality was also higher in Black (236.8; CI, 186.1-287) and Hispanic (256.9; CI, 208.1-305.2) organ recipients compared with other racial and ethnic groups in the Scientific Registry of Transplant Recipients and compared with the Black and Hispanic populations in the United States.
Conclusions.
Studies of excess mortality provide insight into the health and survival of specialized populations like SOT recipients during major health events like the COVID-19 pandemic.
INTRODUCTION
The emergence of the COVID-19 pandemic raised justifiable concern for the fate of solid organ transplant (SOT) recipients.1 The near uniform use of immunosuppression among SOT recipients was an obvious, but not exclusive, reason for concern. Additional considerations included more severe disease, preexisting leukopenia from antimetabolite medications, and reduced vaccine efficacy.2 SOT recipients also require a reliable healthcare system, and disruptions during the pandemic pose unique risks to the medical management of the allograft and the multitude of other medical conditions.
SOT recipients have a greater mortality risk from COVID-19 than the general population. Hospitalized SOT recipients with COVID-19 pneumonia experience a mortality rate 2.5 times higher than SOT recipients hospitalized for non–COVID-19–related pneumonia.3 In a US collaborative study that followed SOT recipients with COVID-19 (the majority of which were kidney transplant recipients), 42.9% required hospitalization and 1.5% experienced graft loss.4 In France, liver transplant recipients with COVID-19 experienced 30-d mortality rates of at least 20%.5
Although these and other studies have expanded the understanding of the risks of the COVID-19 pandemic to the SOT recipients, population-based excess mortality calculations can identify potential effects of the pandemic beyond those from direct SARS-CoV-2 infections. Excess mortality during the COVID-19 pandemic has been studied in the US population,6,7 SOT waitlist candidates,8 and US SOT recipients9; however, not all studies have accounted for population size when comparing mortality in the SOT group to allow for a meaningful comparison between these populations. The purpose of this study is to quantify the spatiotemporal trends in excess mortality rates in heart, kidney, liver, and lung SOT recipients in the United States and compare those rates to the overall US population.
MATERIALS AND METHODS
Study Design
The US all-cause mortality rates were obtained from CDC WONDER,10 and COVID-19 mortality rates were obtained from the Centers for Disease Control and Prevention National Center for Health Statistics (CDC NCHS).11 National and state-level US population data were obtained from the US Census Bureau.12 The 2019 US Census population estimate was used to calculate per capita rates. A death from COVID-19 was counted when the ICD-10 code U07.1 was listed as the underlying cause of death.
This study used data from the Scientific Registry of Transplant Recipients (SRTR). The SRTR data system includes data on all donors, waitlisted candidates, and the transplant recipients in the United States, submitted by the members of the Organ Procurement and Transplantation Network. The Health Resources and Services Administration, US Department of Health and Human Services‚ provides oversight to the activities of the Organ Procurement and Transplantation Network and SRTR contractors. SRTR data from January 1, 2014, to October 31, 2021, was used. The ending date was chosen to be 60 d before the file release date (December 2021) to minimize the effects of delayed reporting of deaths. Patient-level data were converted to time series, population-level data with monthly intervals by calculating the number of deaths occurring each month. Prevalence was calculated from all living SOT recipients at the beginning of each month. Subjects were included from the date of their first recorded transplant and assigned to the organ group based on the first organ received. Those whose first transplant event involved the simultaneous transplant of 2 or more organs were excluded from analysis. When multiple death dates were present for a single subject, the earliest reported death date was used. Recipients of both living and deceased organ donors were included. Kidney transplant recipients were stratified by functional status of the allograft at the time of death.
The Washington University Human Research Protection Office reviewed the research plan and determined that it did not involve activities that are subject to Institutional Review Board oversight.
Statistical Analysis
Monthly time-series death counts from 2014 to 2019 in the 4 organ groups (heart, kidney, liver, and lung) and the US population were used to train a model using the Prophet R package.13 The model was used to forecast monthly death counts from March 1, 2020, to October 31, 2021. Excess mortality was calculated as the difference between observed and predicted death rates. The upper and lower 80% confidence intervals (CIs) of the forecast as output by the Prophet package provided the error estimates. Monthly prevalence data were used to calculate rates per 10 000 population for the SRTR data. Both SRTR and US cumulative excess mortality rates are reported per 10 000 patients or population, unless otherwise specified. The statistical significance of cumulative mortality compared with baseline was measured by checking that the CI at month 20 from March 1, 2020, did not cross zero. The statistical significance of the cumulative mortality between subgroups was defined as a lack of overlap between the respective CI of the subgroups.
The count of deaths attributed to COVID-19 in the SRTR database were taken from cause-of-death codes 2804 (heart and lung), 4959 (liver), and 3916 (kidney).
Spatiotemporal analysis of United Network for Organ Sharing (UNOS) region was based on the transplant center region‚ and the statewide analysis was based on the primary state of the recipient.
Code used in the calculation is available at https://github.com/jacobaclarke/transplant-excess-mortality. R version 4.1.1 (The R Foundation for Statistical Comput ing, Vienna Austria) was used for all analyses.
Web Application
Using the data from the above studies, a web-based application for data visualization was created. It is available at https://transplant.jacobaclarke.com.
RESULTS
Study Population
All mortality counts in the SRTR were taken from the at-risk population, which consisted of 52 028 heart, 340 711 kidney, 129 412 liver, and 28 687 lung transplant recipients. The mean age of organ recipients was youngest in the heart (45.6 y; SD 20.3) and oldest in the lung cohort (55 y; SD 14.5). Transplant recipients were predominantly male, age 40 or older, or non-Hispanic White (table 1).
TABLE 1.
Descriptive statistics of the SRTR population stratified by organ type
| Heart | Kidney | Liver | Lung | Overall | |
|---|---|---|---|---|---|
| N | 52 028 | 340 711 | 129 412 | 28 687 | 550 838 |
| Age at transplant | |||||
| Mean (SD) | 45.6 (20.3) | 46.7 (16.4) | 48.6 (18.3) | 55 (14.5) | 47.5 (17.3) |
| Median (min, max) | 52 (0, 78) | 49 (0, 96) | 54 (0, 84) | 59 (0, 84) | 51 (0, 96) |
| Sex, n (%) | |||||
| Female | 14 507 (27.9) | 136 292 (40) | 47 929 (37) | 11 922 (41.6) | 210 650 (38.2) |
| Male | 37 521 (72.1) | 204 419 (60) | 81 483 (63) | 16 765 (58.4) | 340 188 (61.8) |
| Age group, n (%) | |||||
| <25 y | 9523 (18.3) | 36 091 (10.6) | 15 606 (12.1) | 1528 (5.3) | 62 748 (11.4) |
| 25–44 y | 8425 (16.2) | 103 480 (30.4) | 18 987 (14.7) | 4063 (14.2) | 134 955 (24.5) |
| 45–64 y | 26 921 (51.7) | 153 032 (44.9) | 76 779 (59.3) | 15 083 (52.6) | 271 815 (49.3) |
| ≥65 y | 7159 (13.8) | 48 108 (14.1) | 18 040 (13.9) | 8013 (27.9) | 81 320 (14.8) |
| Race, n (%) | |||||
| Asian | 1746 (3.4) | 20 963 (6.2) | 5836 (4.5) | 611 (2.1) | 29 156 (5.3) |
| Black | 9876 (19) | 85 787 (25.2) | 11 324 (8.8) | 2607 (9.1) | 109 594 (19.9) |
| White | 39 732 (76.4) | 227 742 (66.8) | 110 314 (85.2) | 25 249 (88) | 403 037 (73.2) |
| Other | 666 (1.3) | 6201 (1.8) | 1904 (1.5) | 220 (0.8) | 8991 (1.6) |
| Missing | 8 (0.02) | 18 (.01) | 34 (0.03) | 0 (0) | 60 (0.01) |
| Ethnicity, n (%) | |||||
| Hispanic | 5036 (9.7) | 56 724 (16.6) | 19 268 (14.9) | 2279 (7.9) | 83 307 (15.1) |
| Non-Hispanic | 46 992 (90.3) | 283 987 (83.4) | 110 144 (85.1) | 26 408 (92.1) | 467 531 (84.9) |
| Age at death | |||||
| Mean (SD) | 59.4 (19.1) | 63.9 (12.3) | 62.0 (13.9) | 61.1 (14.0) | 62.7 (13.8) |
| Monthly observed deaths per 10 000 | |||||
| Mean (SD) | 41.3 (5.4) | 28.0 (5.0) | 31.3 (4.3) | 86.6 (10.6) | 46.8 (24.5) |
SD, Standard deviation; SRTR, Scientific Registry of Transplant Recipients.
The entire time series from January 1, 2014, to October 31, 2021, included 94 mo of data during which the average monthly and unadjusted all-cause mortality (per 10 000 transplant population) revealed that the lung group had the greatest monthly mortality (86.6 deaths; SD 10.6), followed by heart (41.3; SD 5.4), liver (31.3; SD 4.3), and kidney (28.0; SD 5.0) (Table 1).
Excess Mortality
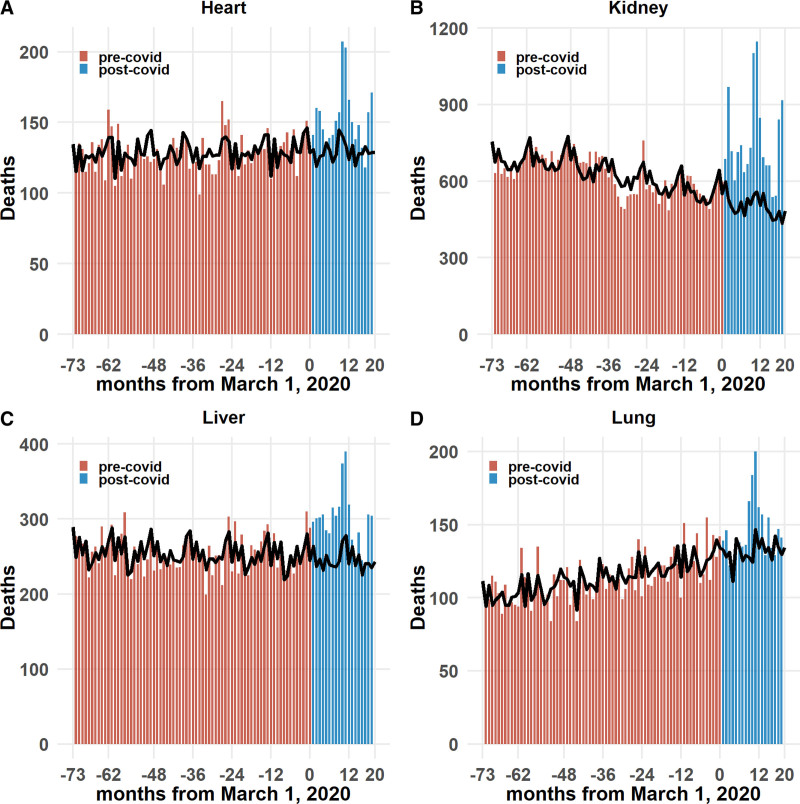
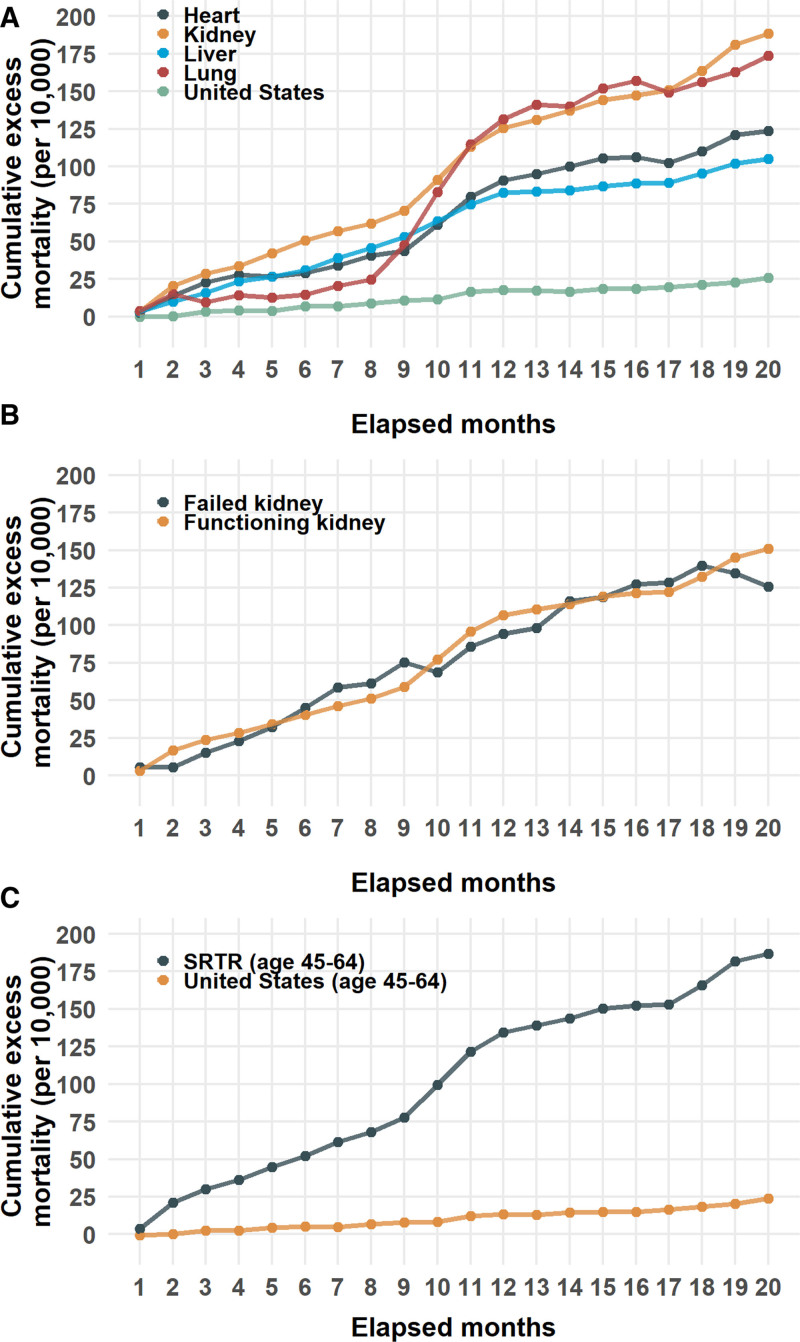
Observed and expected mortality counts for the SOT populations are shown in figure 1. Over the 20 mo studied, beginning March 1, 2020, all organ groups experienced significant excess mortality. The cumulative excess mortality rate (per 10 000 organ transplant recipients or population) was greatest in kidney recipients (188.5; CI, 150.7-225.6), followed by lung (173.6; CI, 17.0-334.7), heart (123.7; CI, 56.0-191.4), and liver (105.1; 95% CI, 64.6-146.0). The cumulative excess mortality rates for each organ group were much significantly higher than for the general US population (25.9; CI, 10.9-41.1) (Figure 2A and Table 2).
FIGURE 1.
Monthly observed (bars) and expected (line) mortality in transplant recipients grouped by organ (January 1, 2014–October 31, 2021): (A) heart, (B) kidney, (C) liver, and (D) lung. Horizontal axis is the number of months either before or after March 1, 2020.
FIGURE 2.
Cumulative excess mortality (per 10 000) from months 1–20 from March 1, 2020. A, Heart, kidney, liver, and lung organ groups and the US population. B, Kidney transplant recipients stratified by functioning or failed allografts. C, Age 45–64 during the interval of January 1, 2014–October 31, 2021 (SRTR) or at time of death (United States). CDC, Center for Disease Control and Prevention; SRTR, Scientific Registry of Transplant Recipients.
TABLE 2.
Cumulative observed deaths, expected deaths, excess deaths, excess deaths per 10 000, and deaths from COVID-19 stratified by specified groups in the SRTR and US population
| Group | Observed deaths | Expected deaths (CI) | Excess deaths (CI) | Excess deaths per 10 000 (CI) | Deaths from COVID-19 | Excess deaths attributed to COVID-19 |
|---|---|---|---|---|---|---|
| Organ group | ||||||
| Heart (SRTR) | 3054 | 2587.1 (2331.3, 2842.8) | 466.9 (211.2, 722.7) | 123.7 (56, 191.4) | 330 (10.8%) | 71.10% |
| Kidney (SRTR) | 15 097 | 10 028 (9033.2, 11 044) | 5069 (4053, 6063.8) | 188.5 (150.7, 225.6) | 2443 (16.2%) | 48.30% |
| Liver (SRTR) | 5961 | 4913.8 (4505.7, 5318.3) | 1047.2 (642.7, 1455.3) | 105.1 (64.6, 146) | 454 (7.6%) | 43.40% |
| Lung (SRTR) | 2930 | 2637.8 (2367.6, 2900.7) | 292.2 (29.3, 562.4) | 173.6 (17, 334.7) | 293 (10%) | 100.30% |
| United States (CDC) | 5 733 899 | 4 883 990.8 (4 395 010.2, 5 378 536.9) | 849 908.2 (355 362.1, 1 338 888.8) | 25.9 (10.8, 40.8) | 698 349 (12.2%) | 82.20% |
| Kidney allograft function | ||||||
| Functioning allograft | 25 658 | 19 476 (18 423.4, 20 531) | 6182 (5127, 7234.6) | 150.8 (125.1, 176.5) | 3434 (13.4%) | 55.70% |
| Failed allograft | 540 | 476 (368.6, 585.1) | 64 (–45.1, 171.4) | 125.9 (–88.4, 336.8) | 5 (0.9%) | 7.80% |
| Age 45–64 | ||||||
| Heart (SRTR) | 1754 | 1457.1 (1264.7, 1651.8) | 296.9 (102.2, 489.3) | 157.3 (53.9, 259.3) | 228 (13%) | 77.10% |
| Kidney (SRTR) | 7890 | 5210.2 (4594.5, 5826.6) | 2679.8 (2063.4, 3295.5) | 230.3 (177.3, 283.2) | 1462 (18.5%) | 54.70% |
| Liver (SRTR) | 3807 | 3078.7 (2787.5, 3370.3) | 728.3 (436.7, 1019.5) | 125.6 (75.5, 175.6) | 313 (8.2%) | 43% |
| Lung (SRTR) | 1480 | 1343.5 (1169.1, 1520.4) | 136.5 (–40.4, 310.9) | 155.3 (–46, 353.7) | 159 (10.7%) | 116.50% |
| All organs (SRTR) | 14 931 | 11 151.5 (10 354.1, 11 953.9) | 3779.5 (2977.1, 4576.9) | 187 (147.3, 226.4) | 2162 (14.5%) | 57.30% |
| US (CDC) | 1 115 095 | 913 129.8 (821 340.4, 1 006 120.2) | 201 965.2 (108 974.8, 293 754.6) | 23.9 (12.9, 34.7) | ||
| Race and ethnicity | ||||||
| Black (SRTR) | 6043 | 4060.8 (3641,4484.9) | 1982.2 (1558.1, 2402) | 236.8 (186.1, 287) | 901 (14.9%) | 45.60% |
| White (SRTR) | 19 555 | 15 363.6 (14 427.2, 16 306.2) | 4191.4 (3248.8, 5127.8) | 135.8 (105.2, 166.1) | 2380 (12.2%) | 56.90% |
| Black (CDC) | 763 211 | 606 873.6 (546 528.9, 666 763) | 156 337.4 (96 448, 216 682.1) | 32.4 (20, 44.9) | 116 143 (15.2%) | 74.30% |
| Hispanic (SRTR) | 3804 | 2082.3 (1757.7, 2409.9) | 1721.7 (1394.1, 2046.3) | 256.9 (208.1, 305.2) | 866 (22.8%) | 50.30% |
| Non-Hispanic (SRTR) | 23 238 | 18 316.1 (17 204.1, 19 408.8) | 4921.9 (3829.2, 6033.9) | 138.1 (107.4, 169.4) | 2654 (11.4%) | 54.10% |
| Hispanic (CDC) | 534 315 | 379 281.3 (344 238, 414 631.7) | 155 033.7 (119 683.3, 190 077) | 24.7 (19.1, 30.3) | 133 911 (25.1%) | 86.40% |
Values are the results at month 20 from March 1, 2020 (data on COVID-19 deaths in the United States in age group 45–64 not available).
CDC, Centers for Disease Control and Prevention; CI, confidence interval; SRTR, Scientific Registry of Transplant Recipients.
Stratification of the kidney transplant group by the graft status at the time of death revealed a greater cumulative excess mortality in patients with functioning kidney allografts (150.8, CI, 125.1-176.5) compared with kidney allografts marked as failed (125.9, CI, –88.4 to 336.8) (Figure 2B and Table 2).
To explore the influence of age structure differences between the United States and SRTR population, an age-filtered analysis was performed comparing excess mortality between SOT recipients and US subjects 45–64 y of age. This age range was chosen because it is the most common age grouping in the SRTR (Figure S1, SDC, http://links.lww.com/TP/C561) that is also a prespecified age group in the NCHS. Analysis of this group showed a similar order of cumulative excess morality to the non age-stratified comparison. Those rates were 187.0 (CI, 147.3-226.4) in transplant recipients compared with 23.9 (CI, 13.0-34.8) in the US population (Figure 2C and Table 2). Even when stratifying by organ group, the cumulative excess mortality in this age group was higher than in the United States; however, not all differences reached the significance because of wider CI (Table 2 and Figure S2, SDC, http://links.lww.com/TP/C561).
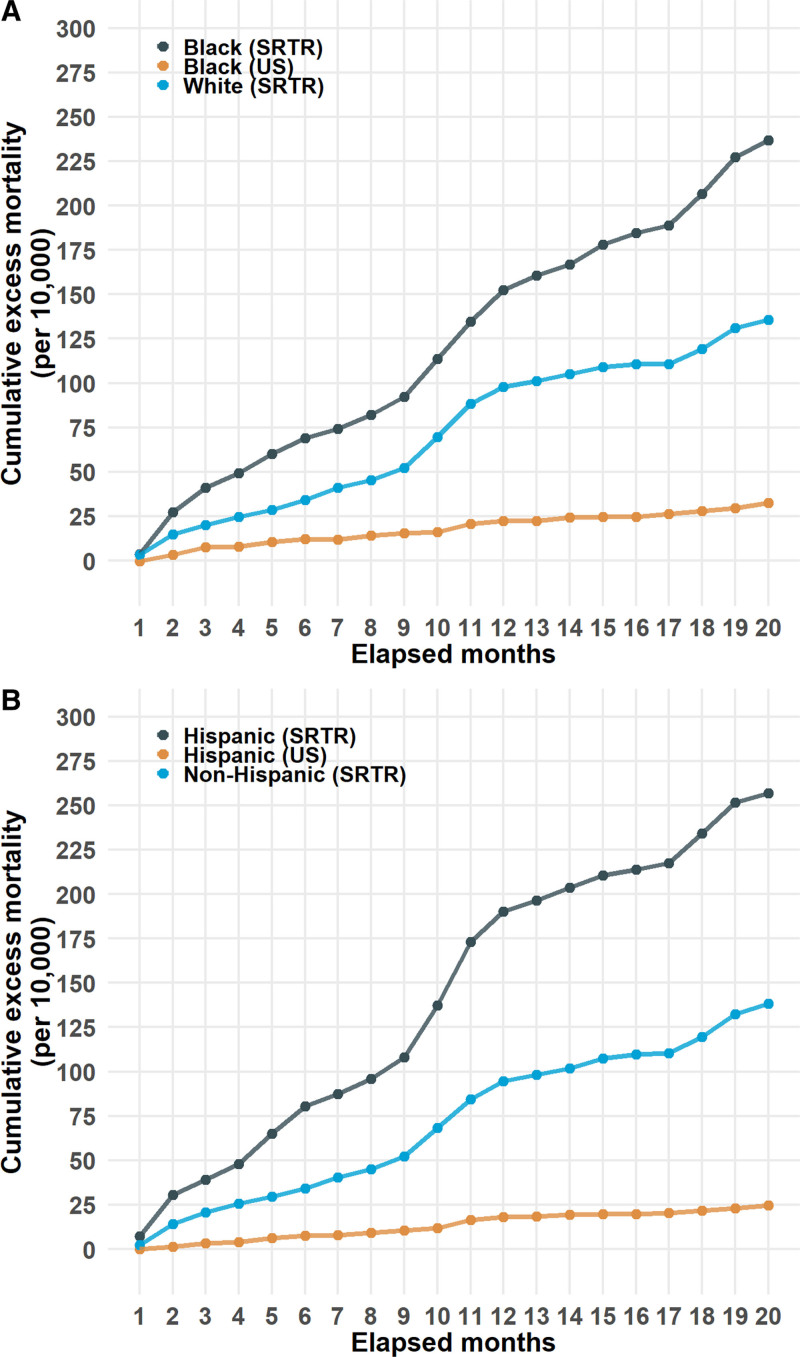
Black and Hispanic organ recipients comprised only 19.9% and 15.1% of all organ recipients, respectively; however, both groups had consistently higher cumulative excess mortality rates than the SOT group as a whole, and their equivalent (non age-adjusted) groups in the US population. Those rates in the SRTR were higher for Black organ recipients (236.8, CI, 186.1-287.0) compared with either White organ recipients (135.8, CI, 105.2-166.1) or the Black US population (32.4, CI, 20.0-44.9) (Figure 3A and Table 2). Similarly, the cumulative excess mortality in Hispanic (256.9, CI, 208.1-305.2) transplant recipients was higher than the non-Hispanic (138.1, CI, 107.4-169.4) transplant group and Hispanics in the US population (24.7, 19.1-30.3) (Figure 3b and Table 2). Stratification of race and ethnicity by organ type led to wide CI (Table S1, SDC, http://links.lww.com/TP/C561).
FIGURE 3.
Cumulative excess mortality (per 10 000) form months 1–20 from March 1, 2020, in (A) selected categories of race and (B) ethnicity in SRTR and US data. SRTR, Scientific Registry of Transplant Recipients.
Spatial and Temporal Trends in Excess Mortality
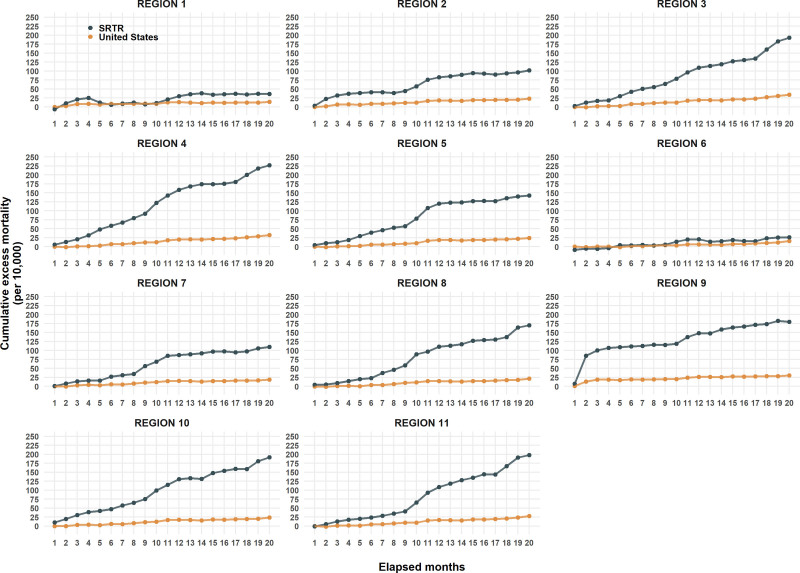
The rates of excess mortality varied by geography and time. UNOS regions 1 and 6 experienced the lowest rates, though still higher than the population rates of their respective regions. Region 4 experienced the highest rates, which were 7 times the population rate (non age-adjusted). The most visible temporal trend was the 12-fold increase in region 9 in the first 2 mo in both the SRTR and US populations. Most regions showed in rate in increase at months 8–9, and although the rate increases have been shallow after month 10, only region 9 has shown signs of decreasing (Table 3 and Figure 4).
TABLE 3.
Cumulative excess mortality rates per 10 000 stratified by UNOS region in the SRTR and US populations at month 20 from March 1, 2020
| UNOS region | Excess mortality per 10 000 (CI) | |
|---|---|---|
| SRTR | United States | |
| Region 1 | 36.1 (–60–132.8) | 13.8 (–2.8-30.3) |
| Region 2 | 101.8 (45.4-157.6) | 23.3 (6.4-40) |
| Region 3 | 193 (139.1-246.1) | 33.8 (17.2-50.5) |
| Region 4 | 226.9 (166.7-287.3) | 32.1 (19.2-44.8) |
| Region 5 | 142.5 (103.8-181.1) | 24.2 (12-36.6) |
| Region 6 | 26.3 (–63.4–116.3) | 15.7 (1.9-29.8) |
| Region 7 | 110 (62.9-157.5) | 19 (4.2-33.5) |
| Region 8 | 170.2 (98.1-244) | 21.3 (5.6-37.2) |
| Region 9 | 180 (105.2-256.7) | 30.4 (16-44.6) |
| Region 10 | 191.4 (124.8-258.9) | 23.9 (5.8-42) |
| Region 11 | 197.9 (140-255) | 27.9 (11.6-44.4) |
CDC, Centers for Disease Control and Prevention; CI, confidence interval; SRTR, Scientific Registry of Transplant Recipients; UNOS, United Network for Organ Sharing.
FIGURE 4.
Cumulative excess mortality (per 10 000) from months 1–20 from March 1, 2020, in SRTR and US population by UNOS region. CDC, Centers for Disease Control and Prevention; SRTR, Scientific Registry of Transplant Recipients; UNOS, United Network for Organ Sharing.
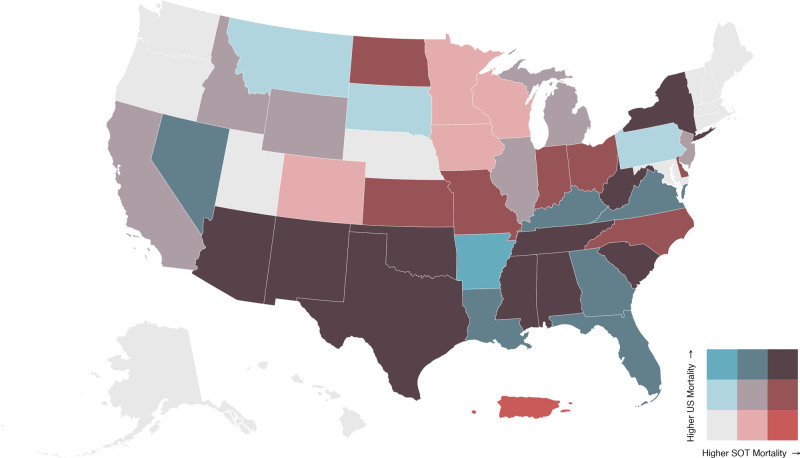
In 29 of all 51 states and territories in the spatial analysis, the tertile of general US excess mortality matched SOT excess mortality. Arkansas and Puerto Rico were uniquely the only areas where tertiles were opposites. Arkansas was in the first tertile of US mortality and third tertile of SOT mortality, whereas Puerto Rico was in the third tertile of US mortality and first tertile of SOT mortality (Figure 5).
FIGURE 5.
Biscale distribution map comparing excess mortality between SOT group with the US population as of October 31, 2021. SOT, solid organ transplant.
Excess Deaths Attributed to COVID-19
By the end of October 2021, 82.2% of the US excess mortality could be attributed to COVID-19 as the underlying cause of deaths. In the SRTR, excess deaths attributed to COVID-19 varied widely. The highest percentage was in lung recipients (100%) followed by heart (71.1%), kidney (48.3), and liver (43.4%) (Table 2).
DISCUSSION
Our results demonstrate that SOT recipients have experienced a much greater excess mortality during the COVID-19 pandemic compared with the general population. These rates have been greatest in the kidney transplant population followed by the lung transplant recipients. Heart and liver transplant recipients have had the lowest excess mortality rates‚ though all 4 organ recipients have experienced significantly higher mortality than before the COVID-19 pandemic.
Our findings are commensurate with a recent publication that also quantified the excess mortality in SOT recipients using the SRTR.9 It is expected that SOT recipients would have an excess mortality as they are but a subset of a larger population also experiencing an excess mortality. A more salient question is whether there is a difference in excess mortality between SOT recipients and the general population because it is those differences that would inform adjustments in policies and procedures to protect SOT recipients from COVID-19 mortality.
This study demonstrates the excess mortality in all transplant groups was much higher than the US population during the same time period and that the difference persisted even when the analysis was limited to those aged 45–64 y. This age group was chosen because the greatest number of transplant recipients in all SOT groups were within this age group. Even when stratifying by age, the same transplant-type rank order persisted. This makes the argument that the difference in excess mortality between transplant recipients and the US population is not simply the result of a difference in age structure of the groups.
The SRTR data also captures the increased mortality rates associated with renal allograft failure. One analysis of the end stage renal disease population from February 1 to August 31, 2020, reported an estimated excess mortality per 1000 patients of 10.8–16.6 in dialysis patients and 2.6–5.5 in kidney transplant recipients.14 In our study, no distinction in cumulative mortality could be made between functioning and failed renal allografts. Subjects with failed renal allografts comprised only 14.7% of kidney transplant recipients‚ and, as a result, restricting the analysis to failed allografts lead to broad confidence intervals. A more accurate conclusion is that kidney failure is unlikely to be a principal driver of the differences in excess mortality between the SRTR and US populations because kidney recipients with functioning renal allografts far outnumbered those with failed allografts.
Race and ethnicity also play a role in excess mortality in both the US and SRTR populations. To increase the accuracy of the prediction model, the organ groups were combined for analysis. Excess mortality rates in both Black and Hispanic subgroups were 10-fold higher than the respective rates in the US population. This result is consistent with prior studies that have demonstrated disparities in racial and ethnic subgroups associated with COVID-19 in a number of contexts.15-17
Both the CDC and SRTR allow identification of deaths from COVID-19 infection. In the United States, previous publications have found that the contribution of COVID-19 as the underlying cause of death has been substantial: 72.4% of the excess deaths from March 1, 2020, to January 2, 2021, were attributed COVID-19.6 We confirmed this finding and found it had reached a peak of 96% with 4 additional months of data before settling at 82% by month 20 of the pandemic.
The percentage of excess deaths from COVID-19, however, varied widely in the 4 organ groups with the highest levels in lung recipients and the lowest in liver recipients. Although it is reasonable to speculate that a lower percentage of deaths directly attributed to COVID-19 in the SOT population could be from non–COVID-19 diseases amplified by disruptions in health care, a more prosaic explanation may be from the underreporting of COVID-10 deaths.
In the NCHS data, COVID-19 deaths are based on death certificates. In the SRTR dataset, transplant programs enter data into the UNet Organ Transplant Program Web Platform. A potential lack of awareness of SRTR codes for COVID-19 deaths, the limited availability of diagnostic testing that complicated the early phase of the pandemic, and deaths transplant kidney recipients identified outside of healthcare settings because of inadequate hospital beds are all potential contributors to an underreporting of COVID-19 deaths in the SRTR. An additional reasonable assumption is that lung transplant programs may have been more attuned to deaths from a respiratory virus than other organ groups. Thus, although the very high percentage of excess deaths attributed to a respiratory pathogen in lung recipients could well reflect the unique susceptibilities of this group, one would need to acknowledge that the lower rates in the other organs could be as much from systemic underreporting of COVID-19 related deaths as a sign of the indirect effects of the pandemic. Almost certainly underreporting is why COVID-19 is reported as the cause of death in only 5 of the 540 posttransplant kidney recipients identified as having a failed allograft. Underreporting is also likely to explain why the kidney transplant recipients had both the highest excess mortality and, using the SRTR, a relatively low percent of the excess deaths directly from COVID-19 despite the widely acknowledged effect of COVID-19 on this population‚ evident from the analysis of other datasets.18 And although underreporting can be seen as a limitation of registry data, within the context of the pandemic, it too may be an outcome of a disrupted health care system.
The COVID-19 pandemic is unique in that, unlike all other pandemics, it is the first major and sustained infectious disease pandemic to arise at a time when the therapeutic induction of a sustained immunosuppressed state is a widespread and standard medical practice. The CDC recognized the first COVID-19 death in the United States on January 9, 2020, and the first wave of infection mainly affected the northeast followed by a second wave in the summer of 2020 that centered on the south and west. A third wave, evident by October 2020, affected most states. These phases occurred prior to the widespread rollout of vaccines and the emergence of the delta (B.1.617.2) variant that became the dominant strain in September 2021.19 The spatiotemporal trends by UNOS region highlight these waves. The dramatic increase in excess mortality in region 9 for both SOT and the general population was particularly centered on New York City. The slight increase in many programs by month 8 corresponds to the third wave. In comparison, states with low rates of infection in the general population are the states that make up UNOS regions 1 and 6 with excess mortality rates close to rates in their general population. The fact that not all regions shared the same fate could reflect regional variations in public health interventions that resulted in mitigating the excess death increases in the SOT population.
The early concerns that SOT recipients would be at a higher-than-average risk for COVID-19–related morbidity and mortality has largely been confirmed in clinical studies. This study on excess mortality and, in particular, the comparative analysis with the general population adds to this body of knowledge. What makes excess mortality particularly helpful is that it can still provide insight into even when patient-level data are limited.
SOT recipients clearly experienced an increased excess mortality during the first 20 mo of the pandemic. The patterns of mortality reflect known risk factors for age, race, and ethnicity. Analysis that extends this study beyond 20 mo may be useful to provide insight into the role of novel therapeutics (antivirals and monoclonal antibodies), vaccination, the emergence of novel variants, and changes in public health policy on SOT recipients. The data also reinforce the necessity of leveraging all beneficial therapies in reducing the mortality risk to SOT recipients during the pandemic.
Supplementary Material
Footnotes
T.L.W. is an employee of Pfizer, Inc. The other authors declare no conflicts of interest.
J.A.C. participated in the research design, performance of the research, data analysis, and writing of the article. T.A.W. participated in the research design, data analysis, and writing of the article. K.K. participated in the research design, performance of the research, data analysis, and writing of the article.
The data reported here have been supplied by the Hennepin Healthcare Research Institute as the contractor for the Scientific Registry of Transplant Recipients (SRTR). The interpretation and reporting of these data are the responsibility of the author(s) and in no way should be seen as an official policy of or interpretation by the SRTR or the US Government.
Supplemental Visual Abstract; http://links.lww.com/TP/C560.
Supplemental digital content (SDC) is available for this article. Direct URL citations appear in the printed text, and links to the digital files are provided in the HTML text of this article on the journal’s Web site (www.transplantjournal.com).
REFERENCES
- 1.Zhu N, Zhang D, Wang W, et al. A novel coronavirus from patients with pneumonia in china, 2019. N Engl J Med. 2020;382:727–733. [DOI] [PMC free article] [PubMed] [Google Scholar]
- 2.Hall VG, Ferreira VH, Ku T, et al. Randomized trial of a third dose of mRNA-1273 vaccine in transplant recipients. N Engl J Med. 2021;385:1244–1246. [DOI] [PMC free article] [PubMed] [Google Scholar]
- 3.Jering KS, McGrath MM, Mc Causland FR, et al. Excess mortality in solid organ transplant recipients hospitalized with COVID-19: A large-scale comparison of SOT recipients hospitalized with or without COVID-19. Clin Transplant. 2022;36:e14492. [DOI] [PMC free article] [PubMed] [Google Scholar]
- 4.Vinson AJ, Agarwal G, Dai R, et al. COVID-19 in solid organ transplantation: results of the National COVID Cohort Collaborative. Transplant Direct. 2021;7:e775. [DOI] [PMC free article] [PubMed] [Google Scholar]
- 5.Dumortier J, Duvoux C, Roux O, et al. ; French Solid Organ Transplant COVID Registry; Groupe de Recherche Français en Greffe de Foie (GReF²). Covid-19 in liver transplant recipients: the French SOT COVID registry. Clin Res Hepatol Gastroenterol. 2021;45:101639. [DOI] [PMC free article] [PubMed] [Google Scholar]
- 6.Woolf SH, Chapman DA, Sabo RT, et al. Excess deaths from COVID-19 and other causes in the US, March 1, 2020, to January 2, 2021. JAMA. 2021;325:1786. [DOI] [PMC free article] [PubMed] [Google Scholar]
- 7.Rossen LM, Branum AM, Ahmad FB, et al. Excess deaths associated with COVID-19, by age and race and ethnicity—United States, January 26-October 3, 2020. MMWR Morb Mortal Wkly Rep. 2020;69:1522–1527. [DOI] [PMC free article] [PubMed] [Google Scholar]
- 8.Miller J, Wey A, Musgrove D, et al. Mortality among solid organ waitlist candidates during COVID-19 in the United States. Am J Transplant. 2021;21:2262–2268. [DOI] [PMC free article] [PubMed] [Google Scholar]
- 9.Massie AB, Werbel WA, Avery RK, et al. Quantifying excess deaths among solid organ transplant recipients in the COVID-19 era. Am J Transplant. 2022;22:2077–2082. [DOI] [PMC free article] [PubMed] [Google Scholar]
- 10.Centers for Disease Control and Prevention. CDC WONDER. 2022. Available at https://wonder.cdc.gov/. Accessed January 15, 2022.
- 11.Centers for Disease Control and Prevention. COVID-19 Death Data and Resources—National Vital Statistics System. 2021. Available at https://www.cdc.gov/nchs/nvss/covid-19.htm. Accessed January 15, 2022.
- 12.US Census Bureau Data. 2022. Available at https://www.census.gov/data. Accessed January 15, 2022.
- 13.Taylor SJ, Letham B. Forecasting at Scale. Am Stat. 2018;72:37–45. [Google Scholar]
- 14.Ziemba R. Excess death estimates in patients with end-stage renal disease — United States, February–August 2020. MMWR Morb Mortal Wkly Rep. 2021;70:825–829. [DOI] [PMC free article] [PubMed] [Google Scholar]
- 15.Rossen LM, Ahmad FB, Anderson RN, et al. Disparities in excess mortality associated with COVID-19—United States, 2020. MMWR Morb Mortal Wkly Rep. 2021;70:1114–1119. [DOI] [PMC free article] [PubMed] [Google Scholar]
- 16.Polyakova M, Udalova V, Kocks G, et al. Racial disparities in excess all-cause mortality during the early COVID-19 pandemic varied substantially across states. Health Aff (Millwood). 2021;40:307–316. [DOI] [PMC free article] [PubMed] [Google Scholar]
- 17.Clarke JA, Despotis AM, Ramirez RJ, et al. Head and neck cancer survival disparities by race and rural-urban context. Cancer Epidemiol Biomarkers Prev. 2020;29:1955–1961. [DOI] [PMC free article] [PubMed] [Google Scholar]
- 18.Salerno S, Messana JM, Gremel GW, et al. COVID-19 risk factors and mortality outcomes among medicare patients receiving long-term dialysis. JAMA Netw Open. 2021;4:e2135379. [DOI] [PMC free article] [PubMed] [Google Scholar]
- 19.Zhang X, Tan Y, Ling Y, et al. Viral and host factors related to the clinical outcome of COVID-19. Nature. 2020;583:437–440. [DOI] [PubMed] [Google Scholar]
Associated Data
This section collects any data citations, data availability statements, or supplementary materials included in this article.


