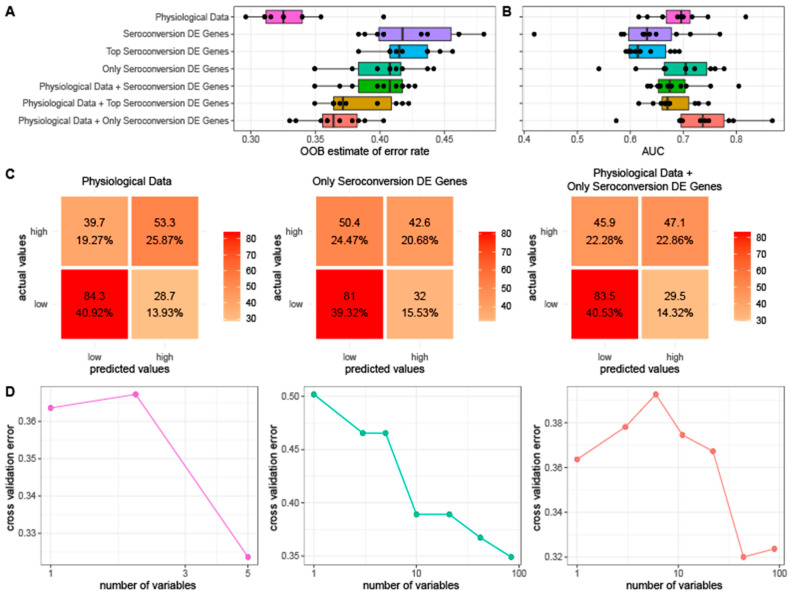
Figure 5.
Prediction performance of random forest models generated using physiological and differential gene expression data to predict seroconversion. The average (A) out-of-bag (OOB) error rate and (B) average area under the curve (AUC) values generated using 10 iterations of random forest models constructed using a combination of physiological data, expression data, and both combined. (C) The confusion matrices displaying true and false positives and negatives for the random forest models using physiological data (left), expression data from the 84 exclusively differentially expressed genes as a function of seroconversion, (middle), and both combined (right). (D) A cross validation analysis plotting a varying number of variables for the physiological data (left), expression data from the 84 exclusively differentially expressed genes as a function of seroconversion (middle), and both combined (right) random forest models against the resulting cross validation error.

