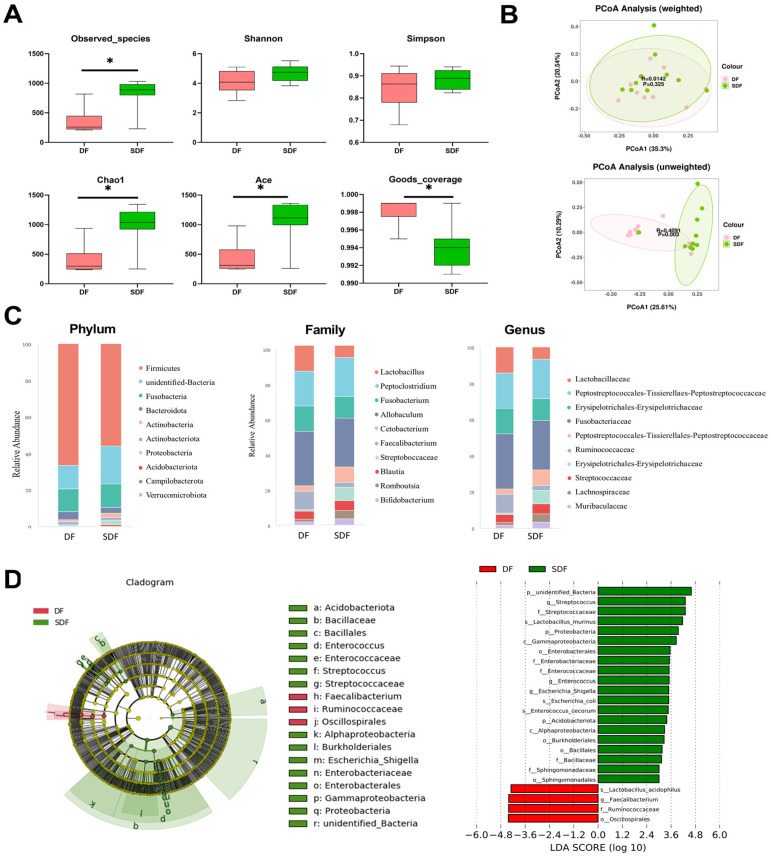
Figure 1.
Alpha diversity indices (Observed_species, Shannon, Simpson, Chao1, Ace and Goods_coverage) of fecal microbial communities of the DF and SDF groups on day 21 (A). The symbol (*) indicates statistically significant differences between two groups. Principal Coordinate Analysis (PCoA) based on weighted and unweighted UniFrac distances of fecal microbial communities of the DF and SDF groups on day 21 (B). Predominant fecal microbial communities and different bacteria at the phylum, family, and genus levels of the DF and SDF groups on day 21 (C). LEfSe analysis identified gut bacterial biomarkers of the DF and SDF groups on day 21 (D). The histogram of the LDA scores presents species (biomarker) whose abundance showed significant differences between different groups. The LDA score represents the effect size. In the cladogram, circles radiating from the inner side to outer side represent taxonomic level from phylum to genus (species). Each circle’s diameter is proportional to the taxon’s relative abundance. Yellow nodes refer to the bacteria that contributed a lot in the DF group and blue nodes refer to the bacteria dominant in the SDF group. DF = dry food; SDF = softened dry food.

