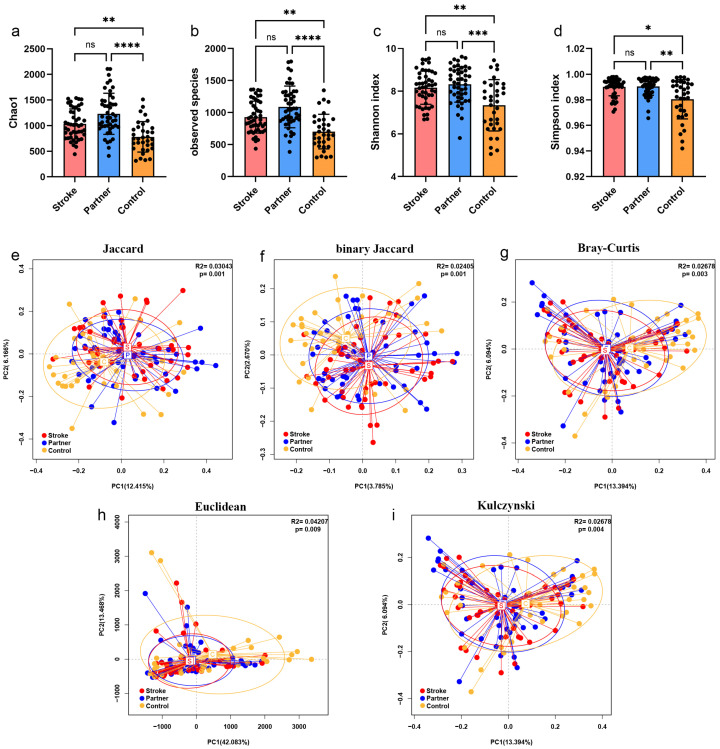
Figure 2.
Comparisons of microbial alpha- and beta-diversity between the three groups. (a–d) Comparison of alpha-diversity index Chao1, observed species, Shannon index and Simpson index between the three groups. The Shannon and Simpson indexes indicate the number and distribution of microbial species in a sample. The observed species index indicates the number of species in the sample. The Chao1 index indicates community richness. (e–i) Comparison of beta-diversity index abund Jaccard, binary Jaccard, Bray-Curtis, Euclidean, and Kulczynski index between the three groups. A smaller distance between two samples indicates a higher similarity. As a dimensionality reduction method, principal-coordinate analysis (PCoA) was used to describe the relationships among samples based on the distance matrix and visualize the unsupervised grouping pattern of the microbiome. Data were expressed as mean ± SD, * p < 0.05, ** p < 0.01, *** p < 0.001, **** p < 0.0001. ns, no significance.

