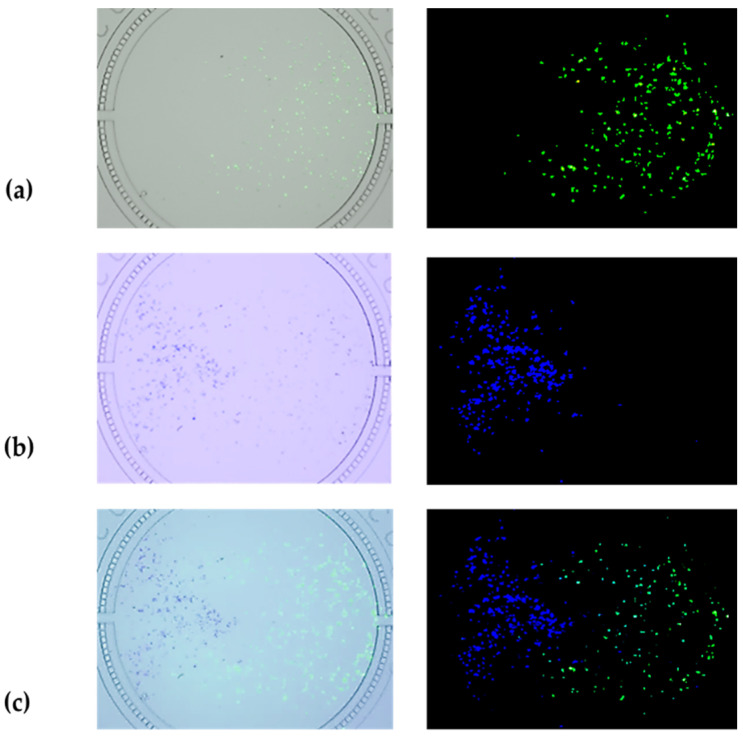
Figure 3.
The distribution of co-cultured HepG2 cells and HRGECs in the same one cell culture chamber of microfluidic chip. (a) Distribution of stained HRGECs with green in cell culture chamber (The merged image of GFP channel and Trans channel, and the image of GFP channel) (×4); (b) Distribution of stained HepG2 cells with blue in cell culture chamber (The merged image of DAPI channel and Trans channel, and the image of DAPI channel) (×4); (c) Distribution of stained HepG2 cells and stained HRGECs in the same one cell culture chamber (The merged image of DAPI, GFP and Trans channels, and the merged image of DAPI channel and GFP channel) (×4).

