


Keywords: differentiation, Erk1/2, extracellular matrix, fibronectin, lysolecithin-induced demyelination, oligodendrocyte, PI3K, poly-L-ornithine, proliferation, remyelination
Abstract
The extracellular matrix surrounding oligodendrocytes plays an important role during myelination and remyelination in the brain. In many cases, the microenvironment surrounding demyelination lesions contains inhibitory molecules, which lead to repair failure. Accordingly, blocking the activity of these inhibitory factors in the extracellular matrix should lead to more successful remyelination. In the central nervous system, oligodendrocytes form the myelin sheath. We performed primary cell culture and found that a natural increase in fibronectin promoted the proliferation of oligodendrocyte progenitors during the initial stage of remyelination while inhibiting oligodendrocyte differentiation. Poly-L-ornithine blocked these inhibitory effects without compromising fibronectin’s pro-proliferation function. Experiments showed that poly-L-ornithine activated the Erk1/2 signaling pathway that is necessary in the early stages of differentiation, as well as PI3K signaling pathways that are needed in the mid-late stages. When poly-L-ornithine was tested in a lysolecithin-induced animal model of focal demyelination, it enhanced myelin regeneration and promoted motor function recovery. These findings suggest that poly-L-ornithine has the potential to be a treatment option for clinical myelin sheath injury.
Introduction
Ensheathment of axons by myelin is essential for rapid nerve impulse conduction as well as for preserving axonal integrity and health. In the central nervous system (CNS), oligodendrocytes (OLs) are the only cell type responsible for myelin formation. During development, OL progenitor cells (OPCs) proliferate and migrate to their final destination, where they differentiate into OLs and wrap around the axons to form dense myelin structures (Bradl and Lassmann, 2010; Stadelmann et al., 2019; Tiane et al., 2019; Yang et al., 2020; Cherchi et al., 2021). OL development is regulated by a complicated interplay of intrinsic factors (transcription factors, microRNAs, epigenetic modulators) and extrinsic factors, including extracellular matrix (ECM) (Emery and Lu, 2015; Gaesser and Fyffe-Maricich, 2016; Galloway and Moore, 2016; Küspert and Wegner, 2016; Liu et al., 2016; Wheeler and Fuss, 2016).
The ECM is a complex system that surrounds all cells. ECM is primarily composed of glycoproteins, collagen, and glycosaminoglycans (Paolillo and Schinelli, 2019; Rilla et al., 2019). ECM can interact with cell adhesion molecules, regulatory factors, connexins, or other proteins to trigger diverse biological activities, such as cell proliferation, migration, differentiation, and survival. In addition to maintaining tissue structure, it also participates in biological reactions essential for normal homeostasis (Birch, 2018; Manou et al., 2019). The effects of ECM components on OLs are intricate. For instance, fibronectin (FN) and decorin are positive regulators of OPC migration, whereas chondroitin sulfate proteoglycans and collagens inhibit OPC migration. Laminin, and decorin can promote OPC differentiation into mature OLs, while chondroitin sulfate proteoglycans, heparan sulfate proteoglycans, tenascin-C, thrombospondin-1, and myelin debris have been shown to impede OPC maturation (Pu et al., 2018).
FN is a glycoprotein with a high molecular weight. It is secreted as a soluble dimer with a disulfide bond by multiple cell types, including hepatocytes, neurons, and astrocytes (Pearlstein et al., 1980; Hibbits et al., 2012; Stoffels et al., 2013). FN is often referred to as the “major organizer” because it acts as a bridge between cell surface receptors (such as integrins) and extracellular molecules (such as proteoglycans, collagen, and other focal adhesion molecules). It is a ligand for several integrin receptors, including αVβ1, αVβ3, αVβ5, α5β1, αVβ6, α4β1, α4β7, α8β1, αDβ2, αMβ2, αXβ2 (Leiss et al., 2008). Although it is nearly absent in the adult CNS and only localizes to the CNS vasculature (Patten and Wang, 2021), after CNS injury, including demyelination, both neurons and astrocytes secret FN and deposit it into the extracellular space. At the same time, FN levels increase in plasma, which can enter the demyelinated area via the damaged blood-brain barrier. FN increase within demyelinated regions suggests that FN plays a role during demyelination/remyelination. Numerous studies have shown that impaired remyelination in multiple sclerosis (MS) is due to FN aggregation in lesions (Sisková et al., 2006; Stoffels et al., 2013; Qin et al., 2017; Wang et al., 2018b; Werkman et al., 2020). However, some studies have shown that the emergence of FN has certain positive effects (Hu et al., 2009; Stoffels et al., 2015; Tripathi et al., 2017). For instance, FN secreted by astrocytes can promote the proliferation of OPCs following CNS demyelination (Stoffels et al., 2015).
In the current study, we investigated the function of FN in OL development. Subsequently, we attempted to find an agent that would reverse its inhibitory effects and promote myelin repair.
Methods
Animals
Mice were housed in the Wuhan University Center for Animal Experiment/Animal Biosafety Level-III Laboratory (Wuhan, China). The rearing environment was maintained at 23 ± 2°C, had a 12/12 hour light/dark cycle, and cages were individually ventilated. The animal experiments were carried out following the National Institutes of Health Guide for the Care and Use of Laboratory Animals. Approval for the animal experiments was granted by the Institutional Animal Care and Use Committee at Wuhan University on February 20, 2014 (approved No. 2013071). Neonatal mice (n = 152, weighing 1–2 g) and specific-pathogen-free 8-week-old male C57BL/6J mice (n = 27, weighing 20–25 g) were obtained from the Animal Experiment/Animal Biosafety Level-III Laboratory, Wuhan, China (license No. SYXK 2019-0013). Mice were anesthetized with 2% isoflurane (RWD, Shenzhen, China) in air under spontaneous breathing conditions (otherwise, specifics are mentioned). Mice were euthanized for tissue sample collection by CO2 asphyxiation. After a normal air supply was provided, carbon dioxide was introduced with a filling rate of 30–70% per minute. As the carbon dioxide concentration increased, mice slowly lost consciousness and died without pain. Only male animals were included in the lysolecithin-induced demyelinating experiments. This was because estrogen is recognized as a neuroprotective agent in MS and other neurodegenerative diseases (Tiwari-Woodruff and Voskuhl, 2009), and cyclical changes in estrogen levels occur throughout the reproductive period (Priyanka and Nair, 2020).
OPC culture
The dishes for OPC culture were coated with four types of substrates: poly-D-lysine (PDL, Sigma, St. Louis, MO, USA), poly-L-Ornithine (PLO, Sigma), FN (Sigma), and PLO + FN. The substrates were diluted in phosphate-buffered saline (PBS, Hyclone, Logan, UT, USA) at the following concentrations: PDL = 100 µg/mL; PLO (alone) = 50 µg/mL; FN (alone) = 20 µg/mL; PLO + FN = 25 µg/mL (PLO) + 10 µg/mL (FN). OPC culture was performed as described in Niu et al. (2012). Briefly, hypothermic anesthesia was performed on neonatal mice at postnatal days (P) 0–2. Mice were placed on ice with latex gloves as compartments. They became completely unconscious after 10 minutes. Then, they were quickly decapitated. Cortices were rapidly isolated, triturated, and filtered to form single-cell suspension, which was resuspended in mixed cell-medium (MCM) that comprised Dulbecco’s modified Eagle’s medium (DMEM; Invitrogen, Carlsbad, CA, USA), 10% fetal bovine serum (Hyclone), and penicillin-streptomycin (Gibco, Grand Island, NY, USA). Then, the mixed glial cells in MCM were added to the coated plates and kept in culture. After 3 days, half the MCM was replaced with new MCM. When cells grew to 65–75% confluence, the MCM was replaced with modified OPC growth-medium (MOGM), which comprised DMEM/F12, 15% rat neuroblastoma conditioned medium (B104 CM), 1% N2 supplement (Gibco), 5 g/mL insulin (Sigma), and penicillin-streptomycin. OPCs were purified after reaching a high yield, and purity typically reached 98% after two rounds of purification. Then, to induce OPC differentiation, the MOGM was replaced with OPC differentiation-medium (ODM), which comprised DMEM/F12, triiodo-L-thyronine (15 nM; Sigma), 1% N2 supplement, 2% B27 supplement (Gibco), and penicillin-streptomycin. Cells were collected at various time points for analysis (Figure 1).
Figure 1.
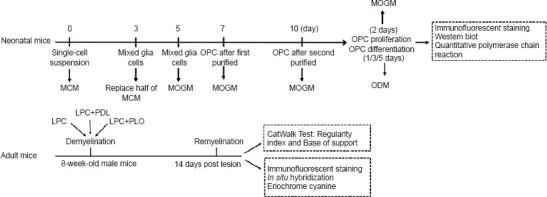
The flow chart.
LPC: Lysolecithin; MCM: mixed cell-medium; MOGM: modified oligodendrocyte precursor cell growth-medium; ODM: oligodendrocyte precursor cell differentiation-medium; OPC: oligodendrocyte precursor cells; PDL: poly-D-lysine; PLO: poly-L-ornithine.
Image analysis and quantification
Fractal dimension analysis
Fractal dimension (D) analysis has been used to assess the cell morphology (Behar, 2001; Fernández and Jelinek, 2001). D values of cells with simple morphology (bipolar) were marked as 1 while those of cells exhibiting complex morphology (highly branched or having bi-dimensional planar structure) were valued near 2. The formula for calculating the fractal dimension is as follows:. ImageJ software (version 2.30, National Institutes of Health, Bethesda, MD, USA; Schneider et al., 2012) was used to calculate D values. Briefly, images were converted into 8-bit TIFF images. Each cell was cropped and outlined. The Fractal box count was used to obtain the D value. For every independent experiment, at least 10 cells were analyzed for each group.
Quantification of fluorescence images
ImageJ software was used to count cell nuclei stained with DAPI-Fluoromount G (Southern Biotech, Birmingham, AL, USA) having an aqueous final step, while manual counting was carried out for 2′,3′-cyclic nucleotide 3′-phosphodiesterase positive (CNP+) or myelin basic protein positive (MBP+) cells. Based on morphology, MBP+ cells were classified into five types. (1) non-ring-like structure, for cells with branches and forks, and no connections between the branches; (2) ring-like structure, for cells whose branches were interconnected with each other forming a structure similar to a ring; (3) non-membranous, for cells with no membranous structure; (4) membranous, for cells that had membranous regions (at least one); and (5) myelin sheets, for cells with a fully planar membrane.
For quantitative analysis, images were converted to 8-bit TIFF files. Cells were outlined and analyzed by region of interest (ROI) measurement. The fluorescence intensity of the signal area and corrected total cell fluorescence were measured according to previously described methods (Fischer et al., 2014; Lourenço et al., 2016). For each independent experiment, at least 10 cells were measured from each group.
Western blot assay
Western blot assay was used to examine the protein levels in OLs treated with different substrates. Radio immunoprecipitation assay-lysis buffer (Beyotime, Shanghai, China) was used for protein extraction from cultured cells with 1% phenylmethanesulfonylfluoride. After 10–12% sodium dodecyl sulfate-polyacrylamide gel electrophoresis, proteins were transferred to polyvinylidene fluoride membranes (Millipore, Billerica, MA, USA). Either 5% non-fat dry milk or bovine serum albumin (BSA) was diluted in Tris-buffered saline with 0.1% Tween-20 and used for blocking. Then, primary antibodies were added, and the membrane was incubated overnight at 4°C. The primary antibodies were as follows: Glyceraldehyde-3-phosphate dehydrogenase (GAPDH; 1:10,000, rabbit, Proteintech, Cat# 10494-1-AP, RRID: AB_2263076), protein kinase B (PKB, known as Akt; 1:1000, rabbit, Cell Signaling Technology, Cat# 9272, RRID: AB_329827), phospho-protein kinase B (Ser473) (P-PKB, known as P-AKT; 1:1000, rabbit, Cell Signaling Technology, Cat# 9271, RRID: AB_329825), cyclic adenosine monophosphate response element binding protein (CREB; 1:1000, rabbit, Cell Signaling Technology, Cat# 9197, RRID: AB_331277), phospho-cyclic adenosine monophosphate response element binding protein (P-CREB; 1:1000, rabbit, Cell Signaling Technology, Cat# 9198, RRID: AB_2561044), extracellular signal-regulated kinases 1 and 2 (Erk1/2; 1:1000, rabbit, Cell Signaling Technology, Cat# 4695, RRID: AB_390779), phospho-extracellular signal-regulated kinases 1 and 2 (Thr202/Tyr204) (P-Erk1/2; 1:1000, rabbit, Cell Signaling Technology, Cat# 4370, RRID: AB_2315112); glycogen synthase kinase 3 beta (GSK3β; 1:1000, rabbit, Affinity, Cincinnati, OH, USA, Cat# AF5016, RRID: AB_2834935), phospho-glycogen synthase kinase 3 beta (P-GSK3β; 1:1000, rabbit, Affinity, Cat# AF2016, RRID: AB_2834439), ribosomal S6 kinase (S6Κ; 1:1000, rabbit, Affinity, Cat# AF6226, RRID: AB_2835100), phospho-ribosomal S6 kinase (P-S6K; 1:1000, rabbit, Affinity, Cat# AF3228, RRID: AB_2834654), CyclinD1 (1:1000, rabbit, Abcam, Cat# AB134175, RRID: AB_2750906), 2′,3′-cyclic nucleotide 3′-phosphodiesterase (CNP; 1:1000, mouse, Calbiochem, Darmstadt, Germany, Cat# NE1020, RRID: AB_2043400), and myelin basic protein (MBP; 1:1000, mouse, Calbiochem, Cat# NE1018, RRID: AB_2140494). The secondary antibodies were goat anti-rabbit IgG (H+L) horseradish peroxidase (HRP) (Affinity, Cat# S0001, 1:5000, RRID: AB_2839429) and goat anti-mouse IgG (H+L) HRP (Affinity, Cat# S0002, 1:5000, RRID: AB_2839430). Membranes were washed three times using Tris-buffered saline with 0.1% Tween-20 and then incubated with HRP-labeled goat anti-rabbit IgG (1:1000, Beyotime, Cat# A0208, RRID: AB_2892644) or HRP-labeled goat anti-mouse IgG (1:1000, Beyotime, A0216, RRID: AB_2860575) at 25°C for 1 hour. Finally, the enhanced chemiluminescence detection system (Applygen Technology, Beijing, China) was used to detect the signals. Protein expression levels were measured by ImageJ software.
Real-time polymerase chain reaction
Real-time polymerase chain reaction (PCR) was used to examine the expression levels of myelin-related genes and integrin genes in OLs treated with different substrates. Trizol reagent (Invitrogen, Carlsbad, CA, USA) was used for RNA extraction from cells. A cDNA Synthesis kit (Thermo Fisher, Waltham, MA, USA) was used for converting RNA into complementary DNA. Real-time PCR (RT-PCR) was performed on a CFX 96 Real-Time PCR Detection System (Bio-Rad, Hercules, CA, USA). The following protocol was used for qRT-PCR: 95°C for 30 seconds (denaturation); 55.5°C or 53°C for 30 seconds (annealing); and 72°C for 40 seconds (elongation). GAPDH was used as the internal control. The 2–∆∆Ct method was adopted for analysis (Schmittgen and Livak, 2008). Primers were designed on the NCBI website (https://www.ncbi.nlm.nih.gov/tools/primer-blast/index.cgi) and synthesized by Tsingke Bio (Beijing, China). The sequences of primers were as follows: proteolipid protein (PLP), forward: 5-GTA TAG GCA GTC TCT GCG CTG AT-3′, reverse: 5′-AAG TGG CAG CAA TCA TGA AGG-3′; MBP, forward: 5′-TAC CTG GCC ACA GCA AGT AC-3′, reverse: 5′-GTC ACA ATG TTC TTG AAG-3′; CNP, forward: 5′-GTT CTG AGA CCC TCC GAA AA-3′, reverse: 5′-CCT TGG GTT CAT CTC CAG AA-3′; GAPDH, forward: 5′-TGT GTC CGT CGT GGA TCT G-3′, reverse: 5′-CAT GTA GGC CAT GAG GTC CAC CAC-3′.
Lysolecithin-induced animal model of demyelination
Lysolecithin (LPC; Sigma) was used to induce spinal cord demyelination in 8-week-old male C57BL/6J mice. Mice were randomly designated to LPC, LPC + PDL, and LPC + PLO groups three groups (> 3 mice/group). Intraperitoneal injection with 1.25% tribromoethanol (Sinopharm Chemical Reagent Co., Ltd., Shanghai, China) (0.02 L/kg body weight) was used for anesthesia. Tissues over the thoracic (T9–T12) vertebrae were separated. The dura at level T10 was opened with a 32-gauge metal needle (WPI, Sarasota, FL, USA) and freshly prepared LPC in 1% PBS was injected bilaterally into the spinal cord. The injection sites were located at the ventrolateral funiculus, 0.6 mm lateral to the midline and 1.3 mm deep. Each mouse was injected with 0.4 µL at four locations. After the surgery, the wound was closed in layers. Mice were shifted to recovery cages together with electric heated blankets. Postoperative antibiotics were given to prevent infection. After 14 days in recovery, mice were euthanized. Spinal cords were collected and fixed overnight with 4% paraformaldehyde for cryosectioning. The sections very close to the injection sites were used for analysis.
Experiments exploring the effects of different PLO concentrations used the following concentrations: 20, 100, and 500 µg/mL. The mice were injected with LPC on one side of the spinal cord and LPC with different concentrations of PLO on the other side. At least three animals were used for each concentration (Figure 1).
Immunofluorescence and Eriochrome cyanine staining
The 14-µm thick spinal cord cryosections were obtained to assess myelin repair via immunofluorescence. After three washes with PBS, slides were blocked with 5% normal goat serum in PBS for 1 hour at 25°C, followed by primary antibody incubation overnight at 4°C. On the second day, slides were rinsed with PBS and incubated with second antibodies for 1 hour at 25°C. After three more rinses in PBS, DAPI-Fluoromount G (Southern Biotech) was used to seal the coverslips. DAPI staining was used to identify areas of demyelination, as reported previously (Lu et al., 2018). Representative images were taken with an Olympus DP80 microscope (Tokyo, Japan). For each mouse, images were taken from at least five sections. The primary antibodies were adenomatous polyposis coli (CC1; 1:500, mouse, Calbiochem, Cat# OP80, RRID: AB_2057371), glial fibrillary acidic protein (GFAP; 1:300, mouse, Sigma, Cat# C9205, RRID: AB_476889), and ionized calcium binding adaptor molecule 1 (Iba1; 1:500, rabbit, Proteintech, Cat# 10904-I-AP, RRID: AB_2224377). The secondary antibodies were Alexa Fluor® 555 goat anti-mouse IgG (H+L) (1:500, Invitrogen, Cat# A28180, RRID: AB_2536164), and Alexa Fluor® 488 goat anti-rabbit IgG (H+L) (1:500, Invitrogen, Cat# A-11008, RRID: RRID: AB_143165).
Similar steps were used for immunofluorescence of cells in culture. For cell counting, three independent cell cultures were used for each condition. At least five fields from each coverslip were randomly selected and more than 500 cells were counted for each coverslip. In all experiments, control experiments without primary antibodies were used to assess the specificity of the staining. The primary antibodies were OL transcription factor 2 (Olig2; 1:5000, rabbit, Dr. Charles Stiles’ Lab at Harvard Medical School), Ki67 (1:200, mouse, eBioscience, San Diego, CA, USA, Cat# 14-5698, RRID: AB_10853185), nerve-glia antigen 2 (NG2; 1:50, rabbit, Dr. Stallup’s Lab, Burnham Institute for Medical Research), CNP (1:1000, mouse, Calbiochem, Cat# NE1020, RRID: AB_2043400), MBP (1:1000, mouse, Calbiochem, Cat# NE1018, RRID: AB_2140494). The secondary antibodies were Alexa Fluor® 555 goat anti-mouse IgG (H+L) (1:500, Invitrogen, Cat# A28180, RRID: AB_2536164), and Alexa Fluor® 488 goat anti-rabbit IgG (H+L) (1:500, Invitrogen, Cat# A-11008, RRID: RRID: AB_143165).
For eriochrome cyanine staining, 100 mL of staining solution contained 0.2 g Eriochrome Cyanine R (Magnacol Ltd., Newtown, Wales, UK), 4 mL 10% Alum (Sinopharm Chemical Reagent Co., Ltd., Shanghai, China), 96 mL ddH2O, and 0.5 mL concentrated sulfuric acid. After three washes in PBS, the T10 spinal cord slides were submerged in staining solution for 30 minutes, followed by PBS for 10 minutes. Then, slides were treated with 10% ferric ammonium alum for 2 minutes and PBS for another 10 minutes. Later, the tissues were dehydrated in graded ethanol solutions. In the end, neutral balsam was applied to seal the coverslips. Images were taken with an Olympus DP80 microscope.
RNA in situ hybridization
RNA in situ hybridization was carried out for differentiated OLs according to previously described methods (Fu et al., 2009). Briefly, cryosections were prehybridized for 1 hour at 65°C. Then, the slides were incubated with the RNA probe (1–2 mg/mL) overnight at 65°C. On the second day, after washing, anti-digoxigenin antibody conjugated with alkaline phosphatase (1:3000, Roche, Basel, Switzerland) was added to each section. Finally, NBT/BCIP reagents (Promega, Walldorf, Germany) were applied for the color reaction. Primers of probe were designed on the NCBI website and synthesized by Tsingke Bio. The sequences of primers were as follows: MBP, forward: 5′-AGA CCC TCA CAG CGA TCC AA-3′, reverse: 5′-ACA GCT TCT CTA CGG CTC GG-3′; PLP, forward: 5′-TTG GCG ACT ACA AGA CCA CC-3′, reverse: 5′-AGC CAT ACA ACA GTC AGG GC-3′.
CatWalk gait analysis
One week before the experiments, mice were trained on the CatWalk for at least three runs per day. Before each recording, mice were allowed to cross the walkway once or twice for habituation. Mice were then tested individually and allowed to move freely. The effective gait was evaluated under the following conditions in the actual trial: Animals ran continuously from one end of the channel to the other. All runs with a complete duration between 0.50 and 8.00 seconds, and a maximum speed variation of 60%, were considered successful. At least three effective runs were recorded for each mouse. After each test, the glass channel was wiped clean with 75% alcohol to prevent stains from affecting the identification of subsequent mouse footprints. Gait was assessed using two indices: the regularity index and the base of support. The regularity index equaled the number of normal step-sequence patterns divided by the total number of paw placements. The base of support equaled the average width between the hind paws.
Statistical analysis
No statistical methods were used to predetermine sample sizes. However, our sample sizes are similar to those reported in previous publications (Lourenço et al., 2016; Lu et al., 2018). GraphPad Prism 9.0.0 software (GraphPad Software, San Diego, CA, USA, www.graphpad.com) was used for statistical analysis. Data are shown as mean ± standard deviation (SD). The experimental animals were either littered or similar in terms of age and weight. For in vivo experiments, at least three animals were used for each group and double-blinded analysis was performed. Quantifications were based on data from at least three independent experiments. Statistical significance of results between two groups was determined using independent sample Student’s t-tests. When comparing multiple groups, one-way analysis of variance (ANOVA) was applied with multiple comparisons or pairwise comparisons using Tukey’s multiple comparison method. P < 0.05 was considered to be statistically significant.
Results
FN promotes OL precursor cell proliferation
In the first experiment, we studied how FN affects OPC proliferation. Cells were isolated from P0–P2 mice and purified to over 98% OPC purity. Our data showed that the percentage of OLs did not depend on the coating substance (PDL, FN, PLO, PLO + FN) (Additional Figure 1A (1.4MB, tif) –C (1.4MB, tif) ). However, the total number of cells was significantly greater in FN-coated plates than in PDL-coated plates (Figure 2A and B). Immunofluorescence staining showed that the number of OPCs (NG2+ cells) was significantly greater in FN-coated plates than in the PDL-coated plates (Figure 2C and D). Furthermore, the percentage of proliferating OPCs (Ki67+ NG2+ cells/NG2+ cells) was significantly higher in FN-coated plates than in PDL-coated plates (Figure 2C and E). These results indicated that FN promotes OPC proliferation.
Figure 2.

FN promotes the proliferation of NG2+ cells.
(A) Representative images of OPCs plated on glass coverslips coated with FN or PDL and cultured for 2 days in proliferation medium. The number of cells was significantly higher in the FN group than in the PDL group. Scale bar: 100 µm. (B) Quantitative analysis of A. Data were from three independent experiments. (C) Representative immunofluorescence images of OPCs stained for NG2 (an OPC marker, red, stained with Alexa Fluor555), Ki67 (a proliferating-cell marker, green, stained with Alexa Fluor488), DAPI (blue, nucleus staining), cultured for 2 days in proliferation medium. Compared with the PDL group, the number of NG2+ cells and the proportion of Ki67+ cells in NG2+ cells were significantly higher in the FN group. Scale bar: 50 µm. (D) Quantitative analysis of NG2+ cells in C. (E) Quantitative analysis of proliferating OPCs (Ki67+ NG2+ cells/NG+ cells) in the different treatment groups. Data are expressed as mean ± SD from at least three independent experiments. **P < 0.01, ***P < 0.001 (Student’s t-test). DAPI: 4′,6-Diamidino-2-phenylindole; FN: fibronectin; NG2: nerve-glia antigen 2; OPC: oligodendrocyte precursor cell; PDL: poly-D-lysine.
FN inhibits OL differentiation
Cultured OPCs can be induced to differentiate in vitro, following a similar time course as occurs in vivo (Pfeiffer et al., 1993; Warrington et al., 1993; Miller, 2002; Emery, 2010). During this process, the cell morphology undergoes a series of changes. In the initial stage, cell shape changes from mostly bipolar to multi-process. Next, cell processes connect to form a ring-like structure, and then a double-ring structure. Then, they fuse into myelin membranes which change into flat myelin sheets (Bradl and Lassmann, 2010; Tiane et al., 2019; Figure 3A). During this in vitro differentiation process, the cells express the same markers with the same timing as they do in vivo (Figure 3A). After 1 day in differentiation medium, the number of CNP+ (a marker for early OPC differentiation; Fressinaud and Eyer, 2013) cells appeared fewer and cell processes were less elaborate among OPCs cultured on FN-coated plates than among those cultured on PDL-coated plates (Additional Figure 2A (3.6MB, tif) ). The fractal dimension value (D) was used to measure the complexity of cell morphology. We found that the D value was significantly lower for the FN group than for the PDL group after one day of differentiation (Additional Figure 2B (3.6MB, tif) and C (3.6MB, tif) ). After 3 days of differentiation, while many cells in the PDL group exhibited ring-like structures, very few did so in the FN group, indicating more advanced differentiation in the PDL group (Figure 3B and C). We also measured the area of MBP+ staining, the fluorescence intensity of the signal, and the corrected total cell fluorescence. Statistical analysis showed that these parameters were significantly lower in the FN group than in the PDL group (Additional Figure 2C (3.6MB, tif) and D), indicating a less differentiated morphology. Consistent with these differences in cell morphology, MBP and CNP mRNA and protein levels were significantly lower in the FN group than in the PDL group (Figure 3D–F). After 5 days of differentiation, the cells in the FN group continued to be less differentiated than cells in the PDL group, with less myelin membranous/sheets structure (Figure 3G and H), a smaller area of MBP+ staining, and lower fluorescence intensity of the signal and corrected total cell fluorescence (Additional Figure 2E (3.6MB, tif) and F (3.6MB, tif) ). These data indicated that FN suppresses OL differentiation.
Figure 3.

FN suppresses the differentiation of oligodendrocytes.
(A) The diagram illustrates changes in cell morphology revealed by typical markers during oligodendrocyte differentiation in vitro. OPCs cultured for 2 days in proliferation medium (2 d PM) were stained with NG2 antibody (red, stained with Alexa Fluor555). CNP antibody was used after 1 and 3 days in the differentiation medium (1/3 d DM). MBP antibody was used to mark OLs cultured for 5 days in the differentiation medium (5 d DM). (B) Representative immunofluorescence images of OLs stained for Olig2 (green, stained with Alexa Fluor488) and CNP (red, stained with Alexa Fluor555), cultured for 3 days in differentiation medium. Arrows point to cells with ring-like structure. The proportion of OLs with ring-like structure was significantly lower in the FN group than in the PDL group. (C) Quantification of the percentage of cells in B having ring-like structure or non-ring-like structure. (D) Quantification of mRNA expression levels (normalized by the PDL group) of MBP and CNP from cells cultured for 3 days in differentiation medium. (E) Representative western blots of MBP and CNP proteins from OPCs cultured for 3 days in differentiation medium. (F) Quantification of the protein expression levels (normalized by the PDL group) of MBP and CNP in E. (G) Representative immunofluorescence images of OLs stained for Olig2 (green, stained with Alexa Fluor488) and MBP (red, stained with Alexa Fluor555) after 5 days in differentiation medium. The OLs in the FN group exhibited less membranous and myelin-sheet structures than did those in the PDL group. Scale bars: 50 µm (A), 100 µm (B, G). (H) Quantification of G, showing the percentages of cells bearing non-membranous, membranous, or myelin sheet structures. Data are expressed as mean ± SD from three independent experiments. **P < 0.01, ***P < 0.001 (Student’s t-test). CNP: 2′,3′-Cyclic nucleotide 3′-phosphodiesterase; DM: differentiation medium; FN: fibronectin; GAPDH: glyceraldehyde-3-phosphate dehydrogenase; MBP: myelin basic protein; NG2: nerve-glia antigen 2; Olig2: oligodendrocyte transcription factor 2; OPC: oligodendrocyte precursor cell; PDL: poly-D-lysine; PM: proliferation medium.
Figure 5.

PLO has no significant effects on OPC proliferation and does not interfere with the proliferative effect of FN.
(A) Representative immunofluorescence images of OPCs stained for NG2 (red, stained with Alexa Fluor555, an OPC marker), Ki67 (green, stained with Alexa Fluor488, a proliferation marker), and DAPI (blue, staining for nuclei), cultured for 2 days in proliferation medium (2 d PM) under different coating conditions. The proliferation rate of OPCs in the PLO + FN group was similar to that in the FN group, which was higher than that in the PDL or PLO groups. Scale bar: 100 µm. (B) Quantitative analysis of A, showing the proportion of Ki67 and NG2 co-labeled cells to NG2 cells. (C) Representative western blots of CyclinD1 protein from oligodendrocytes cultured for 2 days in proliferation medium (2 d PM). (D) Quantification of the CyclinD1 protein expression level (normalized by the PDL group) in C. Data were collected from at least three independent western blots. Data are expressed as mean ± SD from three independent experiments. *P < 0.05, **P < 0.01 (one-way analysis of variance followed by Tukey’s multiple comparison test). DAPI: 4′,6-Diamidino-2-phenylindole; FN: fibronectin; GAPDH: glyceraldehyde-3-phosphate dehydrogenase; MBP: myelin basic protein; NG2: nerve-glia antigen 2; Olig2: oligodendrocyte transcription factor 2; OPC: oligodendrocyte precursor cell; PDL: poly-D-lysine; PLO: poly-L-ornithine; PM: proliferation medium.
Arrow 1: cells with non-membranous structure; arrow 2: cells with membranous structure; arrow 3: cells with myelin sheets. Scale bars: 50 μm in A and C, 100 μm in E. (F) Measurement of the area of MBP+ cells, CTCF, and MFI in E. Data are expressed as mean ± SD collected from at least three independent experiments. **P < 0.01, ***P < 0.001 (Student’s t-test). CNP: 2′,3′-Cyclic nucleotide 3′-phosphodiesterase; CTCF: corrected total cell fluorescence; DAPI: 4′,6-diamidino-2-phenylindole; DM: differentiation medium; FN: fibronectin; MBP: myelin basic protein; MFI: measurement the fluorescence intensity; OL: oligodendrocyte; Olig2: oligodendrocyte transcription factor 2; PDL: poly-D-lysine.
PLO blocks the inhibitory effects of FN on OL differentiation without interfering with OPC proliferation
PLO is commonly used in neuronal stem cell culture (Sato et al., 2018; Hosseini Farahabadi et al., 2020) because it can promote the differentiation of neuronal stem cells (Ge et al., 2015). In the next experiment, we tested the effect of PLO on OL differentiation from OPCs in culture. After one day in the differentiation medium, cells in the PLO group exhibited more processes than those in the PDL group. Additionally, the D value was significantly higher for the PLO group than for the PDL group (Figure 4A and B). After 3 days of differentiation, more CNP+ OLs with ring-like structures appeared in the PLO group than in the PDL group (Figure 4C and D). Furthermore, CNP and MBP protein levels were much higher in the PLO group (Figure 4E and F). After 5 days of differentiation, OLs in PLO group showed mature morphology with a higher percentage of cells with membranous structures and myelin-sheet structures than was found in the PDL group (Figure 4G and H). These results indicated that PLO promotes OL differentiation.
Figure 4.

PLO blocks the negative effects of FN on oligodendrocyte differentiation and promotes oligodendrocyte maturation.
(A) Representative immunofluorescence images of OLs (stained with Alexa Fluor555) cultured for 1 day in differentiation medium (1 d DM) under different coating conditions. After treatment with the PLO and FN combination, OLs showed more complex morphology than those in the PDL or FN groups. (B) Quantitative analysis of D values on cells in A. (C) Representative immunofluorescence images of OLs stained for Olig2 (green, stained with Alexa Fluor488), and CNP (red, stained with Alexa Fluor555) after being cultured for 3 days in differentiation medium (3 d DM) under different coating conditions. Compared with the PDL group, OLs in the FN group exhibited less ring-like structure, while those in the PLO + FN group exhibited more ring-like structure. (D) Quantification of the ratios of cells in A with/without ring-like structure. Data were collected from three independent experiments. (E) Representative western blots of MBP and CNP proteins from oligodendrocytes cultured for 3 days in differentiation medium under different coating conditions. (F) Quantification of C (normalized by the PDL group), with data from at least three independent experiments. (G) Images of OLs stained for Olig2 (green, stained with Alexa Fluor488) and MBP (red, stained with Alexa Fluor555) after being cultured for 5 days in differentiation medium (5 d DM) under different coating conditions. Arrow 1: cells with non-membranous structure; arrow 2: cells with membranous structure; arrow 3: cells with myelin sheets. Compared with the PDL group, OLs in the FN group exhibited less membranous structure and no myelin sheets, while those in the PLO + FN group exhibited more membranous structure and myelin sheets. Scale bars: 50 µm in A, 100 µm in C and G. (H) Quantification of the percentages of cells having non-membranous/membranous structure or myelin sheets, as revealed by MBP immunostaining in E. Data are expressed as mean ± SD of at least 10 cells from each of three independent experiments. *P < 0.05, **P < 0.01, ***P < 0.001 (one-way analysis of variance followed by Tukey’s multiple comparison test). CNP: 2′,3′-Cyclic nucleotide 3′-phosphodiesterase; DAPI: 4′,6-diamidino-2-phenylindole; DM: differentiation medium; FN: fibronectin; GAPDH: glyceraldehyde-3-phosphate dehydrogenase; MBP: myelin basic protein; NG2: nerve-glia antigen 2; OL: oligodendrocyte; Olig2: oligodendrocyte transcription factor 2; PDL: poly-D-lysine; PLO: poly-L-ornithine.
Next we tested whether PLO could block the inhibitory effect of FN on OL differentiation. We coated the culture plates with both FN and PLO (PLO + FN). On the first day of differentiation, OLs in the PLO + FN group exhibited many more processes and higher D values than did the cells in the FN group (Figure 4A and B). On the third day, analysis showed that the proportion of cells with ring-like structures had risen and was significantly greater in the PLO + FN group (PLO + FN vs. FN) (Figure 4C and D). Similarly, CNP and MBP protein levels were also significantly higher in the PLO + FN group (PLO + FN vs. FN) (Figure 4E and F). On the fifth day, cells in the PLO + FN group showed mature morphology with membranous and myelin structures visible in almost all cells (Figure 4G). Statistical analysis showed that on this day, the proportion of cells with membranous and myelin structures was significantly higher in the PLO + FN group than in FN group, while the proportion of cells with non-membranous structures was drastically lower (Figure 4H). At each time point tested, signs of OL differentiation were greater in the PLO + FN group than in the FN group. The degree of differentiation seen in the FN + PLO group almost reached what was observed in the PLO group (Figure 4). These results indicated that PLO abolished the inhibitory effects of FN on OL differentiation.We also tested the influence of PLO on OPC proliferation, finding that it did not alter the amount of proliferation (PDL vs. PLO, P > 0.05). Furthermore, FN-induced increases in OPC proliferation also remained unchanged by the addition of PLO (FN vs. FN + PLO, P > 0.05) (Figure 5A and B). The levels of cyclinD1 exhibited a similar pattern, being equally higher in FN and PLO + FN groups than in the PLO group (Figure 5C and D). These results suggest that PLO does not interfere with the FN-induced OPC proliferation.
In summary, our results suggest that PLO block the inhibitory effects of FN on OL differentiation without affecting its ability to facilitate OPC proliferation.
PLO and FN regulate OL development via ERK and PI3K/Akt pathways
FN binds to integrin receptors in the cell membrane (Leiss et al., 2008). Previous studies have reported that FN recognizes multiple integrin subunits, among which αV/β1/β3/β5 are expressed in OL lineage cells (Loeser, 2014; Bharadwaj et al., 2017; Suzuki et al., 2019; Wirth et al., 2020; Figure 6A). We measured the expression levels of different integrin mRNAs during the OL development. β3 levels were high in OPCs and decreased as they differentiated into OLs. β1 rose during early differentiation (day 1) and then remained in high levels during later differentiation phase (day 3). β5 levels kept increasing throughout differentiation (Figure 6B). These results indicate that OLs express different integrin subtypes during development. Thus, binding to different integrin receptors, FN can have multiple different effects during OL development.
Figure 6.

PLO and FN function through ERK and PI3K/Akt signaling pathways.
(A) The diagram shows the integrins (αV, β1, β3, β5) expressed in oligodendrocytes that specifically bind to FN. Data are collected from published literature. (B) Quantitative analysis of the expression levels (normalized by the PDL group) of integrins (αV, β1, β3, β5) during the proliferation and differentiation stages of oligodendrocytes by real-time quantitative polymerase chain reaction. (C) Representative western blots of Akt, P-Akt (Thr308), S6K, P-S6K, Erk1/2, and P-Erk1/2 proteins from OPCs cultured with different coating substances for 2 days in proliferation medium (2 d PM). (D) Quantification of the western blot results (normalized by the PDL group) showed in C. (E) Representative western blots of GSK3β, P-GSK3β, CREB, P-CREB, Akt, P-Akt, Erk, and P-Erk proteins from cells cultured for 1 day in differentiation medium (1d DM). (F) Quantification (normalized by the PDL group) of the results in E. (G) Representative western blots of Akt, P-Akt, Erk, P-Erk, GSK3β, P-GSK3β, CREB, and P-CREB proteins from cells cultured for 3 days in differentiation medium (3d DM). (H) Quantification (normalized by the PDL group) of the results in G. All data are expressed as mean ± SD from at least three independent experiments. *P < 0.05, **P < 0.01 (one-way analysis of variance followed by Tukey’s multiple comparison test). Akt: Protein kinase B; CREB: cyclic adenosine monophosphate response element binding protein; DM: differentiation medium; Erk1/2: extracellular signal-regulated kinases 1 and 2; FN: fibronectin; GAPDH: glyceraldehyde-3-phosphate dehydrogenase; GSK3β: glycogen synthase kinase 3 beta; P-Akt; phospho-protein kinase B; P-CREB: phospho-cyclic adenosine monophosphate response element binding protein; PDL: poly-D-lysine; P-Erk1/2: phospho-extracellular signal-regulated kinases 1 and 2; P-GSK3β: phospho-glycogen synthase kinase 3 beta; PI3K: phosphoinositide 3-kinase; PLO: poly-L-ornithine; PM: proliferation medium; P-S6k: phospho-ribosomal S6 kinase; S6k: ribosomal S6 kinase.
We further investigated intracellular signaling molecules that transmit signals from membrane receptors during OL development. In the proliferative phase, the expression levels of P-Akt and P-S6K were markedly higher in OPCs of the FN and PLO + FN groups (Figure 6C and D) than in the OPCs of the PDL group, suggesting that FN promotes the proliferation of OPCs at least partially via the AKT signaling pathway. Analysis also indicated that PLO had no effect on P-Akt/P-S6k signaling during the proliferation stage. At the early stage of OL differentiation, expression levels of P-Erk1/2 in OLs were significantly lower in the FN group than in the PDL (control) group, and significantly higher in the PLO and PLO + FN groups (Figure 6E and F). At later stages, P-Erk1/2 levels did not differ among the four groups. These data suggest that FN can inhibit OL differentiation by decreasing Erk1/2 phosphorylation during early differentiation, while PLO can block this inhibition by facilitating Erk1/2 phosphorylation. At later stages of OL differentiation, levels of P-Akt (Ser473) and P-CREB were significantly lower in the FN group (vs. the PDL group) and significantly higher in the PLO and PLO + FN groups. Expression levels of P-GSK3β and P-Erk1/2 were not significantly different among groups at any stage of differentiation (Figure 6G and H). These results suggest that FN can inhibit late OL differentiation by decreasing Akt and CREB phosphorylation, which can be negated by PLO-induced phosphorylation of Akt and CREB.
PLO promotes remyelination and motor function recovery after LPC-induced demyelinating injury
Thus far, we have shown that in culture, PLO can block FN-regulated inhibition of OL differentiation while sparing OPC proliferation. To evaluate the practical potential of PLO as a therapeutic agent for diseases of demyelination, we used an animal model of LPC-induced demyelination. Mouse groups mirrored the groups used in the culture studies. Local injection of LPC into the spinal cord causes selective and focal myelin loss in the ventrolateral white matter (Torre-Fuentes et al., 2020; Figure 7A). Fourteen days after injection, which is during active remyelination (Keough et al., 2015), the injured segments were serially sectioned on a cryostat for analysis. The differentiated OLs were detected by in situ hybridization for proteolipid protein (PLP1) and myelin basic protein (MBP) mRNAs. As shown in Figure 7B and C, the number of differentiated OLs was significantly higher in the PLO-treated group than in controls (LPC and LPC + PDL). These results were confirmed by immunostaining with CC1 and MBP antibodies, showing a higher density of CC1+ mature OLs and a significantly enlarged area of MBP protein expression after PLO treatment (Figure 7D and E). We also used eriochrome cyanine staining for myelin, which revealed that the area of demyelination was significantly lower following PLO treatment than after the control treatments (Figure 7F and G). We examined astrocyte and microglia in the damaged region 14 days after injury and found no significant differences between groups in the numbers of Iba1+ microglia/macrophages or GFAP+ astrocytes (Figure 7H and I).
Figure 7.

PLO promotes functional myelin repair after 14 days of lysolecithin-induced demyelination injury.
(A) Illustration of the mouse model of LPC-induced demyelination. Demyelination was restricted to the ventrolateral white matter, approximately 0.6 mm lateral to the midline. Black arrowheads on the steric spinal cord model indicate the injection sites, blue dots on the transection plane indicate the lesion sites, and the white dashed lines mark off the lesion area. (B) RNA in situ hybridization for MBP and PLP1 on spinal cords with different treatments. The white dashed lines mark off the lesion area. PLP1+/MBP+ OLs were significantly greater in the PLO-treated group. Scale bar: 50 µm. (C) Quantification of PLP1+ OLs in the lesion area with different treatments as shown in B (n = 3). (D) Representative MBP (red, stained with Alexa Fluor555) and CC1 (red, stained with Alexa Fluor555) immunofluorescence staining. Compared with control groups, MBP-stained areas and the number of CC1 positive cells were significantly greater in the PLO-treated group. The white dashed lines mark off areas of increased cell density (as shown by DAPI staining) representing the location of LPC demyelination. Scale bar: 50 µm. (E) Quantification of CC1+ OLs in C (n = 3). (F) EC staining showing myelin in the spinal cord after different treatments. The area of demyelination was significantly lower in the PLO-treated group than in the control groups. The white dashed lines mark off the demyelinated area. Scale bar: 100 µm. (G) Quantification of the size of the demyelinated region in F. Three animals were used for each group (n = 3). (H) Representative immunostaining for astrocytes (GFAP+ cell, red, stained with Cy3) and microglia (Iba1+ cell, green, stained with Alexa Fluor488) in lesion areas 14 days after injury. The number of astrocytes or microglia in the PLO-treated group was similar to that in the control groups. The white dashed lines mark off the lesion area. Scale bar: 50 µm. (I) Quantification of GFAP+ cells and Iba1+ cells in H. Three animals were used for each group (n = 3). (J) Scores for “base of support” were compared among different groups one day before surgery and 14 days after surgery (n = 5). (K) Regularity index values for the different groups (n = 4). All data are expressed as mean ± SD. *P < 0.05, **P < 0.01, ***P < 0.001 (Student’s t-test was used to compare two groups, and one-way analysis of variance followed by Tukey’s multiple comparison test was performed for comparisons of three or more groups). CC1: Adenomatous polyposis coli; DAPI: 4′,6-diamidino-2-phenylindole; dpl: days post-lesion; EC: eriochrome cyanine; GFAP: glial fibrillary acidic protein; Iba-1: ionized calcium binding adaptor molecule 1; LPC: lysolecithin; MBP: myelin basic protein; PDL: poly-D-lysine; PLO: poly-L-ornithine; PLP: proteolipid protein.
We next investigated the functional recovery of the modal mice using the Catwalk system. Demyelination of the spinal cord in the lower thoracic region affects hindlimb function, as the descending and ascending fibers play important roles in initiating and coordinating locomotion. The mice in control groups (LPC and LPC + PDL) exhibited chronic hindlimb paresis over the treatment period, with a significantly wider base of support between the hind paws. In contrast, animals treated with PLO exhibited a significant improvement in motor function, regaining the use of both hind limbs after 14 days (Figure 7J). We also assessed recovery using the regularity index, a fractional measure of inter-paw coordination (Garrick et al., 2021). This index was significantly higher in PLO-treated mice than in control mice (Figure 7K), indicating better coordination. Overall, our results demonstrated that PLO-treated animals exhibited expedited functional recovery, suggesting that PLO promotes functional recovery of LPC-induced demyelinating injury.
We next explored how dosage affects PLO-facilitated myelin repair. At a low concentration (20 µg/mL), PLO helped to reduce the size of the demyelinated area (vs. controls). At 100 µg/mL, PLO exhibited a much better effect on promoting myelin repair. Compared with controls, at this dosage, the area of myelin damage was greatly reduced and the number of CC1+ OLs was significantly higher in the damaged area (Figure 8A–D). However, at the high PLO concentration of 500 µg/mL, the effect was the opposite; the size of the damaged area was larger and CC1+ cell density was lower (Figure 8A–D) compared with the control. Thus, our data suggests that high levels of PLO will worsen myelin repair and wound recovery.
Figure 8.

PLO exhibits dose-dependent effects in the animal model of demyelination.
(A) Eriochrome cyanine staining 14 days after the different treatments. The area of demyelination in the ventrolateral funiculus is indicated by the dashed outline. The area of demyelination in the LPC + 100 µg/mL group was significantly smaller than that in the LPC, LPC + 20 µg/mL, or LPC + 500 µg/mL groups. (B) Quantification of the demyelinated area in A. (C) Representative CC1 (red, stained with Alexa Fluor555) immunofluorescence staining 14 days after injury. The number of CC1+ OLs was greater in the LPC + 100 µg/mL group than in the LPC, LPC + 20 µg/mL, or LPC + 500 µg/mL groups. Scale bars: 100 µm in A, 50 µm in C. (D) Quantification of CC1+ cells in C. All data are expressed as mean ± SD (n = 3). *P < 0.05, **P < 0.01, ***P < 0.001 (Student’s t-test). CC1: Adenomatous polyposis coli; DAPI: 4′,6-diamidino-2-phenylindole; LPC: lysolecithin.
Discussion
In this study, we found that FN plays dual roles during OL development: it promotes OPC proliferation and inhibits OL differentiation. This is consistent with the finding that FN increases during the early stage of remyelination and is downregulated soon afterward (Zhao et al., 2009; Stoffels et al., 2013). During the early stage of remyelination, FN is beneficial because it increases the OPC pool (i.e., the number of potential OLs). However, FN becomes detrimental as time goes on because it suppresses OL differentiation and thus the formation of myelin sheets. For successful remyelination to be successful, it must be removed. Studies from other labs have also demonstrated that FN mediates the proliferation of OPCs in vitro (Stoffels et al., 2015), and hinders morphological differentiation of OLs (Sisková et al., 2006, 2009; Qin et al., 2017). In addition, injection of astrocyte-derived FN into demyelinating lesions results in reduced OL differentiation and remyelination (Stoffels et al., 2013).
Many of the biological functions of FN rely on integrins, which have multiple family members. Different ECM proteins, including FN, trigger intracellular signaling cascades by binding to integrins (van der Flier and Sonnenberg, 2001; Labat-Robert, 2012). Among FN’s integrin receptors, only the αV/β1/β3/β5 subunits are expressed in OLs (Sisková et al., 2006; Barros et al., 2009; Friedland et al., 2009). Our data showed that these integrins have different temporal expression patterns during OL development. The β3 subunit was highly expressed in OPCs and was downregulated during differentiation. The β1/β5 subunits were more highly expressed during differentiation than during proliferation, with β1 levels being highest in the early stages of differentiation and β5 levels being highest in the later stages. The temporal expression pattern of the αV subunit was quite constant. Studies have shown that integrins affect OL survival (Mazaheri et al., 2018), migration (Zhu et al., 2016; Suzuki et al., 2019), and differentiation (Quintela-López et al., 2019). FN has been reported to bind to integrin β1 on the cell membrane of OLN93 cells, thus activating the intracellular target PKC signaling molecule and impeding morphological differentiation (Sisková et al., 2006). Our data suggests that FN could work through Erk, Akt, and CREB signaling pathways, which are the major signaling pathways for OL development (Guardiola-Diaz et al., 2012; Jana et al., 2018; Ishii et al., 2019; Wang et al., 2021). During the proliferation stage, FN might work through β3 integrin receptors to activate the Akt/S6K pathway, which would lead to expression of cyclinD1 and promote OPC proliferation. During early differentiation, FN could work through β1 to suppress Erk1/2 and inhibit OL differentiation. In later stages of differentiation, FN might bind to β5 and deactivate Akt and CREB pathways, which would also inhibit differentiation.
For clinical remyelination, the best-case scenario is treatment that keeps the OPC proliferative property of FN while at the same time blocks its ability to inhibit OL differentiation. We found that PLO would be an ideal candidate for this job. PLO is a positively charged synthetic amino acid polymer that is widely used as a coating substrate (Sato et al., 2018; Hosseini Farahabadi et al., 2020). It has been used successfully for the attachment and study of neural cell differentiation and outgrowth. For example, PLO enhances the migration of neuronal stem/progenitor cells by promoting the binding of α-actin 4 to actin filaments (Ge et al., 2016). Furthermore, PLO promotes the preferential differentiation of neuronal stem/progenitor cells into neurons and OLs (Ge et al., 2015). PLO is often used in combination with other substrates (Hosseini Farahabadi et al., 2020; Setien et al., 2020). For example, the combination of PLO and laminin coating promoted neuronal arborization and maturation (Setien et al., 2020), and PLO with FN has also been used for neuronal stem cells (Lewicka et al., 2012).
In our in vitro study, we combined PLO with FN and observed enhanced OPC proliferation and successful OL differentiation (under different conditions). When tested in an LPC-induced demyelination/remyelination mouse model, PLO promoted myelin repair and motor function recovery.
PLO might function by altering the downstream intracellular signaling pathways mediated by FN. Studies have shown a close correlation between integrin signals and lipid rafts in the membrane (Decker et al., 2004). Lipid rafts and integrin activation has been reported to regulate OL survival through the PI3K/Akt signaling pathway (Baron et al., 2003; Decker and ffrench-Constant, 2004). Lipid rafts are rich in cholesterol, sphingolipids and related proteins, which are generally considered as micro-domains on the cell membrane (Lingwood and Simons, 2010; Levental et al., 2020). They can respond to extracellular signals, rapidly redistribute, and assemble locally (Simons and Toomre, 2000; Golub et al., 2004; Lim and Yin, 2005). We speculate that PLO might work through lipid rafts on the cell membrane. PLO may alter the signal domain composition or location of lipid rafts on the cell membrane, affecting the binding of integrins (especially β1 and β5) to FN, thereby activating the intracellular Erk1/2 and Akt signaling pathway to promote OL differentiation.
The animal model of demyelination revealed the potential therapeutical value of PLO. After treatment with PLO, the mice with LPC-induced demyelination showed a much better recovery. Histological changes were obvious and indicated quicker and better remyelination. Functional changes were less obvious but still significant. We also found that the effect of PLO on remyelination was dosage-dependent. While beneficial at low and medium dosages, the high dosage was detrimental. Excessive PLO might disrupt the effect of integrins (Mezu-Ndubuisi and Maheshwari, 2021) or other components of the ECM, such as Fibulin-2 (a glycoprotein in the ECM; Schaeffer et al., 2018), which can participate in the remodeling of the ECM within the glial scar. PLO is clinically safe and commonly used to make alginate microcapsule systems for drug delivery and cell transplantation (Wang et al., 2018a; Vong et al., 2019; Somo et al., 2020; Xue et al., 2022). The current study only tested the effect of PLO in one animal model of demyelination. In the future, we would like to test it in other animal models to better evaluate its clinical potential.
In conclusion, our study confirmed that FN both promotes OPC proliferation and inhibit OL differentiation. Pathologically accumulated FN as observed in multiple sclerosis could thus contribute to remyelination failure. Our studies further showed that PLO could block the negative effect of FN on OL differentiation, while maintaining the benefits of OPC proliferation. It will be highly worthwhile to extend the current study to test the medical potential of PLO.
Additional files:
Additional Figure 1 (1.4MB, tif) : Different coating substrates do not affect the percentage of OPCs in culture.
Different coating substrates do not affect the percentage of OPCs in culture.
(A) Representative immunofluorescence images of OPCs, stained for Olig2 (green, stained with Alexa Fluor488, an OPC marker) and DAPI (blue, staining for nuclei). The percentages of OPC cells were similar among the different treatment groups. Scale bar: 100 μm. (B) Representative immunofluorescence images of OPCs after the first (passage 1) and second purification processes (passage 2). DAPI: blue, GFAP (red, stained with Cy3), astrocytic marker, Olig2 (green, stained with Alexa Fluor488). After the second purification, the majority of cells were OPCs. Scale bar: 100 μm. (C) OPC percentage when cells were cultured on different substrates for 24 hours and purified. Data are expressed as mean ± SD with at least three independent experiments, and were analyzed by Student’s t-test. DAPI: 4′,6-Diamidino-2-phenylindole; DL: poly-D-lysine; FN: fibronectin; GFAP: glial fibrillary acidic protein; ns: non-significant; Olig2: oligodendrocyte transcription factor 2; OPC: oligodendrocyte precursor cell; PLO: poly-L-ornithine.
Additional Figure 2 (3.6MB, tif) : FN inhibits morphological differentiation of oligodendrocytes.
FN inhibits morphological differentiation of oligodendrocytes.
(A) Representative immunofluorescence images of OLs (stained with Alexa Fluor555) cultured for 1 day in the differentiation medium. Compared with those in the PDL group, the cells in the FN group had simpler morphology. (B) Quantification of OL morphology was measured by fractal dimension values (termed D). (C) Representative immunofluorescence images of OLs (stained with Alexa Fluor555) cultured for 3 days in differentiation medium. Cells in the PDL group had more complex morphology than those in the FN group. (D) Measurement of the area of MBP+ cells, the MFI-MBP+ signal, and the CTCF-MBP+ signal of C. (E) Representative immunofluorescence images of OLs (stained with Alexa Fluor555) cultured for 5 days in differentiation medium. The cells in the PDL group showed more complex morphology with membranous structure or myelin sheets than those in the FN group.
Footnotes
Funding: The study was supported by the National Nature Science Foundation of China, Nos. 81371338 (to HF) and 82071369 (PPY).
Conflicts of interest: The author declares no conflicts of interest.
Availability of data and materials: All data generated or analyzed during this study are included in this published article and its supplementary information files.
C-Editor: Zhao M; S-Editors: Yu J, Li CH; L-Editors: Yu J, Song LP; T-Editor: Jia Y
References
- 1.Baron W, Decker L, Colognato H, ffrench-Constant C. Regulation of integrin growth factor interactions in oligodendrocytes by lipid raft microdomains. Curr Biol. 2003;13:151–155. doi: 10.1016/s0960-9822(02)01437-9. [DOI] [PubMed] [Google Scholar]
- 2.Barros CS, Nguyen T, Spencer KS, Nishiyama A, Colognato H, Müller U. Beta1 integrins are required for normal CNS myelination and promote AKT-dependent myelin outgrowth. Development. 2009;136:2717–2724. doi: 10.1242/dev.038679. [DOI] [PMC free article] [PubMed] [Google Scholar]
- 3.Behar TN. Analysis of fractal dimension of O2A glial cells differentiating in vitro. Methods. 2001;24:331–339. doi: 10.1006/meth.2001.1203. [DOI] [PubMed] [Google Scholar]
- 4.Bharadwaj M, Strohmeyer N, Colo GP, Helenius J, Beerenwinkel N, Schiller HB, Fässler R, Müller DJ. αV-class integrins exert dual roles on α5β1 integrins to strengthen adhesion to fibronectin. Nat Commun. 2017;8:14348. doi: 10.1038/ncomms14348. [DOI] [PMC free article] [PubMed] [Google Scholar]
- 5.Birch HL. Extracellular matrix and ageing. Subcell Biochem. 2018;90:169–190. doi: 10.1007/978-981-13-2835-0_7. [DOI] [PubMed] [Google Scholar]
- 6.Bradl M, Lassmann H. Oligodendrocytes:biology and pathology. Acta Neuropathol. 2010;119:37–53. doi: 10.1007/s00401-009-0601-5. [DOI] [PMC free article] [PubMed] [Google Scholar]
- 7.Cherchi F, Pugliese AM, Coppi E. Oligodendrocyte precursor cell maturation:role of adenosine receptors. Neural Regen Res. 2021;16:1686–1692. doi: 10.4103/1673-5374.306058. [DOI] [PMC free article] [PubMed] [Google Scholar]
- 8.Decker L, ffrench-Constant C. Lipid rafts and integrin activation regulate oligodendrocyte survival. J Neurosci. 2004;24:3816–3825. doi: 10.1523/JNEUROSCI.5725-03.2004. [DOI] [PMC free article] [PubMed] [Google Scholar]
- 9.Decker L, Baron W, Ffrench-Constant C. Lipid rafts:microenvironments for integrin-growth factor interactions in neural development. Biochem Soc Trans. 2004;32:426–430. doi: 10.1042/BST0320426. [DOI] [PubMed] [Google Scholar]
- 10.Emery B. Transcriptional and post-transcriptional control of CNS myelination. Curr Opin Neurobiol. 2010;20:601–607. doi: 10.1016/j.conb.2010.05.005. [DOI] [PubMed] [Google Scholar]
- 11.Emery B, Lu QR. Transcriptional and epigenetic regulation of oligodendrocyte development and myelination in the central nervous system. Cold Spring Harb Perspect Biol. 2015;7:a020461. doi: 10.1101/cshperspect.a020461. [DOI] [PMC free article] [PubMed] [Google Scholar]
- 12.Fernández E, Jelinek HF. Use of fractal theory in neuroscience:methods advantages and potential problems. Methods. 2001;24:309–321. doi: 10.1006/meth.2001.1201. [DOI] [PubMed] [Google Scholar]
- 13.Fischer R, Wajant H, Kontermann R, Pfizenmaier K, Maier O. Astrocyte-specific activation of TNFR2 promotes oligodendrocyte maturation by secretion of leukemia inhibitory factor. Glia. 2014;62:272–283. doi: 10.1002/glia.22605. [DOI] [PubMed] [Google Scholar]
- 14.Fressinaud C, Eyer J. Axoskeletal proteins prevent oligodendrocyte from toxic injury by upregulating survival proliferation and differentiation in vitro. Neurochem Int. 2013;62:306–313. doi: 10.1016/j.neuint.2012.12.012. [DOI] [PubMed] [Google Scholar]
- 15.Friedland JC, Lee MH, Boettiger D. Mechanically activated integrin switch controls alpha5beta1 function. Science. 2009;323:642–644. doi: 10.1126/science.1168441. [DOI] [PubMed] [Google Scholar]
- 16.Fu H, Cai J, Clevers H, Fast E, Gray S, Greenberg R, Jain MK, Ma Q, Qiu M, Rowitch DH, Taylor CM, Stiles CD. A genome-wide screen for spatially restricted expression patterns identifies transcription factors that regulate glial development. J Neurosci. 2009;29:11399–11408. doi: 10.1523/JNEUROSCI.0160-09.2009. [DOI] [PMC free article] [PubMed] [Google Scholar]
- 17.Gaesser JM, Fyffe-Maricich SL. Intracellular signaling pathway regulation of myelination and remyelination in the CNS. Exp Neurol. 2016;283:501–511. doi: 10.1016/j.expneurol.2016.03.008. [DOI] [PMC free article] [PubMed] [Google Scholar]
- 18.Galloway DA, Moore CS. miRNAs as emerging regulators of oligodendrocyte development and differentiation. Front Cell Dev Biol. 2016;4:59. doi: 10.3389/fcell.2016.00059. [DOI] [PMC free article] [PubMed] [Google Scholar]
- 19.Garrick JM, Costa LG, Cole TB, Marsillach J. Evaluating Gait and Locomotion in Rodents with the CatWalk. Curr Protoc. 2021;1:e220. doi: 10.1002/cpz1.220. [DOI] [PMC free article] [PubMed] [Google Scholar]
- 20.Ge H, Tan L, Wu P, Yin Y, Liu X, Meng H, Cui G, Wu N, Lin J, Hu R, Feng H. Poly-L-ornithine promotes preferred differentiation of neural stem/progenitor cells via ERK signalling pathway. Sci Rep. 2015;5:15535. doi: 10.1038/srep15535. [DOI] [PMC free article] [PubMed] [Google Scholar]
- 21.Ge H, Yu A, Chen J, Yuan J, Yin Y, Duanmu W, Tan L, Yang Y, Lan C, Chen W, Feng H, Hu R. Poly-L-ornithine enhances migration of neural stem/progenitor cells via promoting α-actinin 4 binding to actin filaments. Sci Rep. 2016;6:37681. doi: 10.1038/srep37681. [DOI] [PMC free article] [PubMed] [Google Scholar]
- 22.Golub T, Wacha S, Caroni P. Spatial and temporal control of signaling through lipid rafts. Curr Opin Neurobiol. 2004;14:542–550. doi: 10.1016/j.conb.2004.08.003. [DOI] [PubMed] [Google Scholar]
- 23.Guardiola-Diaz HM, Ishii A, Bansal R. Erk1/2 MAPK and mTOR signaling sequentially regulates progression through distinct stages of oligodendrocyte differentiation. Glia. 2012;60:476–486. doi: 10.1002/glia.22281. [DOI] [PMC free article] [PubMed] [Google Scholar]
- 24.Hibbits N, Yoshino J, Le TQ, Armstrong RC. Astrogliosis during acute and chronic cuprizone demyelination and implications for remyelination. ASN Neuro. 2012;4:393–408. doi: 10.1042/AN20120062. [DOI] [PMC free article] [PubMed] [Google Scholar]
- 25.Hosseini Farahabadi SS, Ghaedi K, Shoaraye-Nejati A, Nasr-Esfahani MH. Full small molecule conversion of human fibroblasts to neuroectodermal cells via a cocktail of Dorsomorphin and Trichostatin A. Regen Ther. 2020;15:44–52. doi: 10.1016/j.reth.2020.05.003. [DOI] [PMC free article] [PubMed] [Google Scholar]
- 26.Hu J, Deng L, Wang X, Xu XM. Effects of extracellular matrix molecules on the growth properties of oligodendrocyte progenitor cells in vitro. J Neurosci Res. 2009;87:2854–2862. doi: 10.1002/jnr.22111. [DOI] [PubMed] [Google Scholar]
- 27.Ishii A, Furusho M, Macklin W, Bansal R. Independent and cooperative roles of the Mek/ERK1/2-MAPK and PI3K/Akt/mTOR pathways during developmental myelination and in adulthood. Glia. 2019;67:1277–1295. doi: 10.1002/glia.23602. [DOI] [PMC free article] [PubMed] [Google Scholar]
- 28.Jana M, Ghosh S, Pahan K. Upregulation of myelin gene expression by a physically-modified saline via phosphatidylinositol 3-kinase-mediated activation of CREB:implications for multiple sclerosis. Neurochem Res. 2018;43:407–419. doi: 10.1007/s11064-017-2435-1. [DOI] [PMC free article] [PubMed] [Google Scholar]
- 29.Keough MB, Jensen SK, Yong VW. Experimental demyelination and remyelination of murine spinal cord by focal injection of lysolecithin. J Vis Exp. 2015:52679. doi: 10.3791/52679. [DOI] [PMC free article] [PubMed] [Google Scholar]
- 30.Küspert M, Wegner M. SomethiNG 2 talk about-Transcriptional regulation in embryonic and adult oligodendrocyte precursors. Brain Res. 2016;1638:167–182. doi: 10.1016/j.brainres.2015.07.024. [DOI] [PubMed] [Google Scholar]
- 31.Labat-Robert J. Cell-Matrix interactions the role of fibronectin and integrins. A survey. Pathol Biol (Paris) 2012;60:15–19. doi: 10.1016/j.patbio.2011.10.003. [DOI] [PubMed] [Google Scholar]
- 32.Leiss M, Beckmann K, Girós A, Costell M, Fässler R. The role of integrin binding sites in fibronectin matrix assembly in vivo. Curr Opin Cell Biol. 2008;20:502–507. doi: 10.1016/j.ceb.2008.06.001. [DOI] [PubMed] [Google Scholar]
- 33.Levental I, Levental KR, Heberle FA. Lipid rafts:controversies resolved mysteries remain. Trends Cell Biol. 2020;30:341–353. doi: 10.1016/j.tcb.2020.01.009. [DOI] [PMC free article] [PubMed] [Google Scholar]
- 34.Lewicka M, Hermanson O, Rising AU. Recombinant spider silk matrices for neural stem cell cultures. Biomaterials. 2012;33:7712–7717. doi: 10.1016/j.biomaterials.2012.07.021. [DOI] [PubMed] [Google Scholar]
- 35.Lim KI, Yin J. Localization of receptors in lipid rafts can inhibit signal transduction. Biotechnol Bioeng. 2005;90:694–702. doi: 10.1002/bit.20464. [DOI] [PubMed] [Google Scholar]
- 36.Lingwood D, Simons K. Lipid rafts as a membrane-organizing principle. Science. 2010;327:46–50. doi: 10.1126/science.1174621. [DOI] [PubMed] [Google Scholar]
- 37.Liu J, Moyon S, Hernandez M, Casaccia P. Epigenetic control of oligodendrocyte development:adding new players to old keepers. Curr Opin Neurobiol. 2016;39:133–138. doi: 10.1016/j.conb.2016.06.002. [DOI] [PMC free article] [PubMed] [Google Scholar]
- 38.Loeser RF. Integrins and chondrocyte-matrix interactions in articular cartilage. Matrix Biol. 2014;39:11–16. doi: 10.1016/j.matbio.2014.08.007. [DOI] [PMC free article] [PubMed] [Google Scholar]
- 39.Lourenço T, Paes de Faria J, Bippes CA, Maia J, Lopes-da-Silva JA, Relvas JB, Grãos M. Modulation of oligodendrocyte differentiation and maturation by combined biochemical and mechanical cues. Sci Rep. 2016;6:21563. doi: 10.1038/srep21563. [DOI] [PMC free article] [PubMed] [Google Scholar]
- 40.Lu C, Dong L, Zhou H, Li Q, Huang G, Bai SJ, Liao L. G-protein-coupled receptor Gpr17 regulates oligodendrocyte differentiation in response to lysolecithin-induced demyelination. Sci Rep. 2018;8:4502. doi: 10.1038/s41598-018-22452-0. [DOI] [PMC free article] [PubMed] [Google Scholar]
- 41.Manou D, Caon I, Bouris P, Triantaphyllidou IE, Giaroni C, Passi A, Karamanos NK, Vigetti D, Theocharis AD. The complex interplay between extracellular matrix and cells in tissues. Methods Mol Biol. 2019;1952:1–20. doi: 10.1007/978-1-4939-9133-4_1. [DOI] [PubMed] [Google Scholar]
- 42.Mazaheri N, Peymani M, Galehdari H, Ghaedi K, Ghoochani A, Kiani-Esfahani A, Nasr-Esfahani MH. Ameliorating effect of osteopontin on H(2)O(2)-induced apoptosis of human oligodendrocyte progenitor cells. Cell Mol Neurobiol. 2018;38:891–899. doi: 10.1007/s10571-017-0563-4. [DOI] [PMC free article] [PubMed] [Google Scholar]
- 43.Mezu-Ndubuisi OJ, Maheshwari A. The role of integrins in inflammation and angiogenesis. Pediatr Res. 2021;89:1619–1626. doi: 10.1038/s41390-020-01177-9. [DOI] [PMC free article] [PubMed] [Google Scholar]
- 44.Miller RH. Regulation of oligodendrocyte development in the vertebrate CNS. Prog Neurobiol. 2002;67:451–467. doi: 10.1016/s0301-0082(02)00058-8. [DOI] [PubMed] [Google Scholar]
- 45.Niu J, Wang L, Liu S, Li C, Kong J, Shen HY, Xiao L. An efficient and economical culture approach for the enrichment of purified oligodendrocyte progenitor cells. J Neurosci Methods. 2012;209:241–249. doi: 10.1016/j.jneumeth.2012.05.032. [DOI] [PubMed] [Google Scholar]
- 46.Paolillo M, Schinelli S. Extracellular matrix alterations in metastatic processes. Int J Mol Sci. 2019;20:4947. doi: 10.3390/ijms20194947. [DOI] [PMC free article] [PubMed] [Google Scholar]
- 47.Patten J, Wang K. Fibronectin in development and wound healing. Adv Drug Deliv Rev. 2021;170:353–368. doi: 10.1016/j.addr.2020.09.005. [DOI] [PubMed] [Google Scholar]
- 48.Pearlstein E, Gold LI, Garcia-Pardo A. Fibronectin:a review of its structure and biological activity. Mol Cell Biochem. 1980;29:103–128. doi: 10.1007/BF00220304. [DOI] [PubMed] [Google Scholar]
- 49.Pfeiffer SE, Warrington AE, Bansal R. The oligodendrocyte and its many cellular processes. Trends Cell Biol. 1993;3:191–197. doi: 10.1016/0962-8924(93)90213-k. [DOI] [PubMed] [Google Scholar]
- 50.Priyanka HP, Nair RS. Neuroimmunomodulation by estrogen in health and disease. AIMS Neurosci. 2020;7:401–417. doi: 10.3934/Neuroscience.2020025. [DOI] [PMC free article] [PubMed] [Google Scholar]
- 51.Pu A, Stephenson EL, Yong VW. The extracellular matrix:Focus on oligodendrocyte biology and targeting CSPGs for remyelination therapies. Glia. 2018;66:1809–1825. doi: 10.1002/glia.23333. [DOI] [PubMed] [Google Scholar]
- 52.Qin J, Sikkema AH, van der Bij K, de Jonge JC, Klappe K, Nies V, Jonker JW, Kok JW, Hoekstra D, Baron W. GD1a overcomes inhibition of myelination by fibronectin via activation of protein kinase A:implications for multiple sclerosis. J Neurosci. 2017;37:9925–9938. doi: 10.1523/JNEUROSCI.0103-17.2017. [DOI] [PMC free article] [PubMed] [Google Scholar]
- 53.Quintela-López T, Ortiz-Sanz C, Serrano-Regal MP, Gaminde-Blasco A, Valero J, Baleriola J, Sánchez-Gómez MV, Matute C, Alberdi E. Aβoligomers promote oligodendrocyte differentiation and maturation via integrin β1 and Fyn kinase signaling. Cell Death Dis. 2019;10:445. doi: 10.1038/s41419-019-1636-8. [DOI] [PMC free article] [PubMed] [Google Scholar]
- 54.Rilla K, Mustonen AM, Arasu UT, Härkönen K, Matilainen J, Nieminen P. Extracellular vesicles are integral and functional components of the extracellular matrix. Matrix Biol. 2019;75(76):201–219. doi: 10.1016/j.matbio.2017.10.003. [DOI] [PubMed] [Google Scholar]
- 55.Sato J, Horibe S, Kawauchi S, Sasaki N, Hirata KI, Rikitake Y. Involvement of aquaporin-4 in laminin-enhanced process formation of mouse astrocytes in 2D culture:Roles of dystroglycan and α-syntrophin in aquaporin-4 expression. J Neurochem. 2018;147:495–513. doi: 10.1111/jnc.14548. [DOI] [PubMed] [Google Scholar]
- 56.Schaeffer J, Tannahill D, Cioni JM, Rowlands D, Keynes R. Identification of the extracellular matrix protein Fibulin-2 as a regulator of spinal nerve organization. Dev Biol. 2018;442:101–114. doi: 10.1016/j.ydbio.2018.06.014. [DOI] [PubMed] [Google Scholar]
- 57.Schmittgen TD, Livak KJ. Analyzing real-time PCR data by the comparative C(T) method. Nat Protoc. 2008;3:1101–1108. doi: 10.1038/nprot.2008.73. [DOI] [PubMed] [Google Scholar]
- 58.Schneider CA, Rasband WS, Eliceiri KW. NIH Image to ImageJ:25 years of image analysis. Nat Methods. 2012;9:671–675. doi: 10.1038/nmeth.2089. [DOI] [PMC free article] [PubMed] [Google Scholar]
- 59.Setien MB, Smith KR, Howard K, Williams K, Suhr ST, Purcell EK. Differentiation and characterization of neurons derived from rat iPSCs. J Neurosci Methods. 2020;338:108693. doi: 10.1016/j.jneumeth.2020.108693. [DOI] [PMC free article] [PubMed] [Google Scholar]
- 60.Simons K, Toomre D. Lipid rafts and signal transduction. Nat Rev Mol Cell Biol. 2000;1:31–39. doi: 10.1038/35036052. [DOI] [PubMed] [Google Scholar]
- 61.Sisková Z, Baron W, de Vries H, Hoekstra D. Fibronectin impedes “myelin”sheet-directed flow in oligodendrocytes:a role for a beta 1 integrin-mediated PKC signaling pathway in vesicular trafficking. Mol Cell Neurosci. 2006;33:150–159. doi: 10.1016/j.mcn.2006.07.001. [DOI] [PubMed] [Google Scholar]
- 62.SiskováZ , Yong VW, Nomden A, van Strien M, Hoekstra D, Baron W. Fibronectin attenuates process outgrowth in oligodendrocytes by mislocalizing MMP-9 activity. Mol Cell Neurosci. 2009;42:234–242. doi: 10.1016/j.mcn.2009.07.005. [DOI] [PubMed] [Google Scholar]
- 63.Somo SI, Brown JM, Brey EM. Dual crosslinking of alginate outer layer increases stability of encapsulation system. Front Chem. 2020;8:575278. doi: 10.3389/fchem.2020.575278. [DOI] [PMC free article] [PubMed] [Google Scholar]
- 64.Stadelmann C, Timmler S, Barrantes-Freer A, Simons M. Myelin in the central nervous system:structure function and pathology. Physiol Rev. 2019;99:1381–1431. doi: 10.1152/physrev.00031.2018. [DOI] [PubMed] [Google Scholar]
- 65.Stoffels JM, Hoekstra D, Franklin RJ, Baron W, Zhao C. The EIIIA domain from astrocyte-derived fibronectin mediates proliferation of oligodendrocyte progenitor cells following CNS demyelination. Glia. 2015;63:242–256. doi: 10.1002/glia.22748. [DOI] [PMC free article] [PubMed] [Google Scholar]
- 66.Stoffels JM, de Jonge JC, Stancic M, Nomden A, van Strien ME, Ma D, SiskováZ , Maier O, Ffrench-Constant C, Franklin RJ, Hoekstra D, Zhao C, Baron W. Fibronectin aggregation in multiple sclerosis lesions impairs remyelination. Brain. 2013;136:116–131. doi: 10.1093/brain/aws313. [DOI] [PubMed] [Google Scholar]
- 67.Suzuki N, Hyodo M, Hayashi C, Mabuchi Y, Sekimoto K, Onchi C, Sekiguchi K, Akazawa C. Laminin α2 α4 and α5 chains positively regulate migration and survival of oligodendrocyte precursor cells. Sci Rep. 2019;9:19882. doi: 10.1038/s41598-019-56488-7. [DOI] [PMC free article] [PubMed] [Google Scholar]
- 68.Tiane A, Schepers M, Rombaut B, Hupperts R, Prickaerts J, Hellings N, van den Hove D, Vanmierlo T. From OPC to Oligodendrocyte:An Epigenetic Journey. Cells. 2019;8:1236. doi: 10.3390/cells8101236. [DOI] [PMC free article] [PubMed] [Google Scholar]
- 69.Tiwari-Woodruff S, Voskuhl RR. Neuroprotective and anti-inflammatory effects of estrogen receptor ligand treatment in mice. J Neurol Sci. 2009;286:81–85. doi: 10.1016/j.jns.2009.04.023. [DOI] [PMC free article] [PubMed] [Google Scholar]
- 70.Torre-Fuentes L, Moreno-Jiménez L, Pytel V, Matías-Guiu JA, Gómez-Pinedo U, Matías-Guiu J. Experimental models of demyelination and remyelination. Neurologia (Engl Ed) 2020;35:32–39. doi: 10.1016/j.nrl.2017.07.002. [DOI] [PMC free article] [PubMed] [Google Scholar]
- 71.Tripathi A, Parikh ZS, Vora P, Frost EE, Pillai PP. pERK1/2 peripheral recruitment and filopodia protrusion augment oligodendrocyte progenitor cell migration:combined effects of PDGF-A and fibronectin. Cell Mol Neurobiol. 2017;37:183–194. doi: 10.1007/s10571-016-0359-y. [DOI] [PMC free article] [PubMed] [Google Scholar]
- 72.van der Flier A, Sonnenberg A. Function and interactions of integrins. Cell Tissue Res. 2001;305:285–298. doi: 10.1007/s004410100417. [DOI] [PubMed] [Google Scholar]
- 73.Vong LB, Ibayashi Y, Lee Y, Ngo DN, Nishikawa Y, Nagasaki Y. Poly(ornithine)-based self-assembling drug for recovery of hyperammonemia and damage in acute liver injury. J Control Release. 2019;310:74–81. doi: 10.1016/j.jconrel.2019.08.011. [DOI] [PubMed] [Google Scholar]
- 74.Wang H, Liu M, Ye Z, Zhou C, Bi H, Wang L, Zhang C, Fu H, Shen Y, Yang JJ, Hu Y, Chen G. Akt regulates Sox10 expression to control oligodendrocyte differentiation via phosphorylating FoxO1. J Neurosci. 2021;41:8163–8180. doi: 10.1523/JNEUROSCI.2432-20.2021. [DOI] [PMC free article] [PubMed] [Google Scholar]
- 75.Wang P, Kankala RK, Fan J, Long R, Liu Y, Wang S. Poly-L-ornithine/fucoidan-coated calcium carbonate microparticles by layer-by-layer self-assembly technique for cancer theranostics. J Mater Sci Mater Med. 2018a;29:68. doi: 10.1007/s10856-018-6075-z. [DOI] [PubMed] [Google Scholar]
- 76.Wang P, Gorter RP, de Jonge JC, Nazmuddin M, Zhao C, Amor S, Hoekstra D, Baron W. MMP7 cleaves remyelination-impairing fibronectin aggregates and its expression is reduced in chronic multiple sclerosis lesions. Glia. 2018b;66:1625–1643. doi: 10.1002/glia.23328. [DOI] [PMC free article] [PubMed] [Google Scholar]
- 77.Warrington AE, Barbarese E, Pfeiffer SE. Differential myelinogenic capacity of specific developmental stages of the oligodendrocyte lineage upon transplantation into hypomyelinating hosts. J Neurosci Res. 1993;34:1–13. doi: 10.1002/jnr.490340102. [DOI] [PubMed] [Google Scholar]
- 78.Werkman I, Sikkema AH, Versluijs JB, Qin J, de Boer P, Baron W. TLR3 agonists induce fibronectin aggregation by activated astrocytes:a role of pro-inflammatory cytokines and fibronectin splice variants. Sci Rep. 2020;10:532. doi: 10.1038/s41598-019-57069-4. [DOI] [PMC free article] [PubMed] [Google Scholar]
- 79.Wheeler NA, Fuss B. Extracellular cues influencing oligodendrocyte differentiation and (re)myelination. Exp Neurol. 2016;283:512–530. doi: 10.1016/j.expneurol.2016.03.019. [DOI] [PMC free article] [PubMed] [Google Scholar]
- 80.Wirth F, Lubosch A, Hamelmann S, Nakchbandi IA. Fibronectin and its receptors in hematopoiesis. Cells. 2020;9:2717. doi: 10.3390/cells9122717. [DOI] [PMC free article] [PubMed] [Google Scholar]
- 81.Xue W, Liu B, Zhang H, Ryu S, Kuss M, Shukla D, Hu G, Shi W, Jiang X, Lei Y, Duan B. Controllable fabrication of alginate/poly-L-ornithine polyelectrolyte complex hydrogel networks as therapeutic drug and cell carriers. Acta Biomater. 2022;138:182–192. doi: 10.1016/j.actbio.2021.11.004. [DOI] [PubMed] [Google Scholar]
- 82.Yang HJ, Cui YY, Wang L, Ma SP, Li ZC, Feng HG. A novel role of cyclin-dependent kinase PFTK1 in the differentiation of oligodendrocyte precursor cells. Zhongguo Zuzhi Gongcheng Yanjiu. 2015;19:1008–1012. [Google Scholar]
- 83.Zhao C, Fancy SP, Franklin RJ, ffrench-Constant C. Up-regulation of oligodendrocyte precursor cell alpha integrin and its extracellular ligands during central nervous system remyelination. J Neurosci Res. 2009;87:3447–3455. doi: 10.1002/jnr.22231. [DOI] [PubMed] [Google Scholar]
- 84.Zhu B, Nicholls M, Gu Y, Zhang G, Zhao C, Franklin RJ, Song B. Electric signals regulate the directional migration of oligodendrocyte progenitor cells (OPCs) via β1 integrin. Int J Mol Sci. 2016;17:1948. doi: 10.3390/ijms17111948. [DOI] [PMC free article] [PubMed] [Google Scholar]
Associated Data
This section collects any data citations, data availability statements, or supplementary materials included in this article.
Supplementary Materials
Different coating substrates do not affect the percentage of OPCs in culture.
(A) Representative immunofluorescence images of OPCs, stained for Olig2 (green, stained with Alexa Fluor488, an OPC marker) and DAPI (blue, staining for nuclei). The percentages of OPC cells were similar among the different treatment groups. Scale bar: 100 μm. (B) Representative immunofluorescence images of OPCs after the first (passage 1) and second purification processes (passage 2). DAPI: blue, GFAP (red, stained with Cy3), astrocytic marker, Olig2 (green, stained with Alexa Fluor488). After the second purification, the majority of cells were OPCs. Scale bar: 100 μm. (C) OPC percentage when cells were cultured on different substrates for 24 hours and purified. Data are expressed as mean ± SD with at least three independent experiments, and were analyzed by Student’s t-test. DAPI: 4′,6-Diamidino-2-phenylindole; DL: poly-D-lysine; FN: fibronectin; GFAP: glial fibrillary acidic protein; ns: non-significant; Olig2: oligodendrocyte transcription factor 2; OPC: oligodendrocyte precursor cell; PLO: poly-L-ornithine.
FN inhibits morphological differentiation of oligodendrocytes.
(A) Representative immunofluorescence images of OLs (stained with Alexa Fluor555) cultured for 1 day in the differentiation medium. Compared with those in the PDL group, the cells in the FN group had simpler morphology. (B) Quantification of OL morphology was measured by fractal dimension values (termed D). (C) Representative immunofluorescence images of OLs (stained with Alexa Fluor555) cultured for 3 days in differentiation medium. Cells in the PDL group had more complex morphology than those in the FN group. (D) Measurement of the area of MBP+ cells, the MFI-MBP+ signal, and the CTCF-MBP+ signal of C. (E) Representative immunofluorescence images of OLs (stained with Alexa Fluor555) cultured for 5 days in differentiation medium. The cells in the PDL group showed more complex morphology with membranous structure or myelin sheets than those in the FN group.