

Abstract
Evidence is emerging that disruption of the endothelial glycocalyx might contribute importantly to arterial dysfunction in the context of diabetes. One approach to assess the integrity of the endothelium and the vascular smooth muscle cell layer, in the absence of neural, humoral, and mechanical influences, is by measuring arterial vasomotion ex vivo. Here we describe a procedure to assess non-receptor-mediated vasoconstriction, receptor-mediated vasoconstriction, and endothelium-dependent and -independent vasodilation, in resistance and conductance arteries pressurized to 60 mmHg. In addition to evaluating vasoreactivity using isobaric approaches, the same experimental set-up can be used to initiate a pressure gradient across the artery such that intraluminal, flow-mediated vasodilation can be measured. After recording endothelium-dependent vasodilation using isobaric or flow-mediated approaches, identical interventions can be completed in the presence of enzymes that cleave biologically active heparan sulfates into inactive disaccharide and oligosaccharide fragments to assess the contribution from: (a) endothelial-derived substances (e.g., nitric oxide via nitric oxide synthase inhibition); or (b) important components of the glycocalyx (e.g., removal of heparan sulfate via heparitinase III treatment). Here, we show that acute disruption of a predominant glycosaminoglycan i.e., heparan sulfate impairs intraluminal flow-mediated vasodilation in murine resistance arteries.
Keywords: Resistance artery, Conductance artery, Isobaric, Flow-mediated vasodilation, Endothelial glycocalyx, Nitric oxide, Heparan sulfate, Heparitinases
1. Introduction
Evidence is emerging that disruption of the endothelial glycocalyx contributes importantly to blood flow irregularities that might be secondary to vascular endothelial dysfunction in the context of diabetes [1–4]. The glycocalyx is a carbohydrate-rich, semipermeable layer (~1 μm wide) comprised of proteoglycans [core proteins with glycosaminoglycan (GAG) side chains], glycoproteins, and plasma proteins that line the luminal surface of blood vessels [5, 6] (Fig. 1) The predominant GAGs include heparan sulfate, chondroitin sulfate, and hyaluronan. Evidence exists that an intact glycocalyx: (a) contributes to maintaining a homogenous distribution of blood flow in the microvasculature [2]; (b) serves as a mechanoreceptor that transduces intraluminal shear stress to the vascular smooth muscle cell layer via endothelium-derived factors [7]; (c) maintains appropriate vascular permeability [8]; and (d) acts as a barrier that protects the endothelium from inflammatory cytokines and oxidants [9, 10].
Fig. 1.
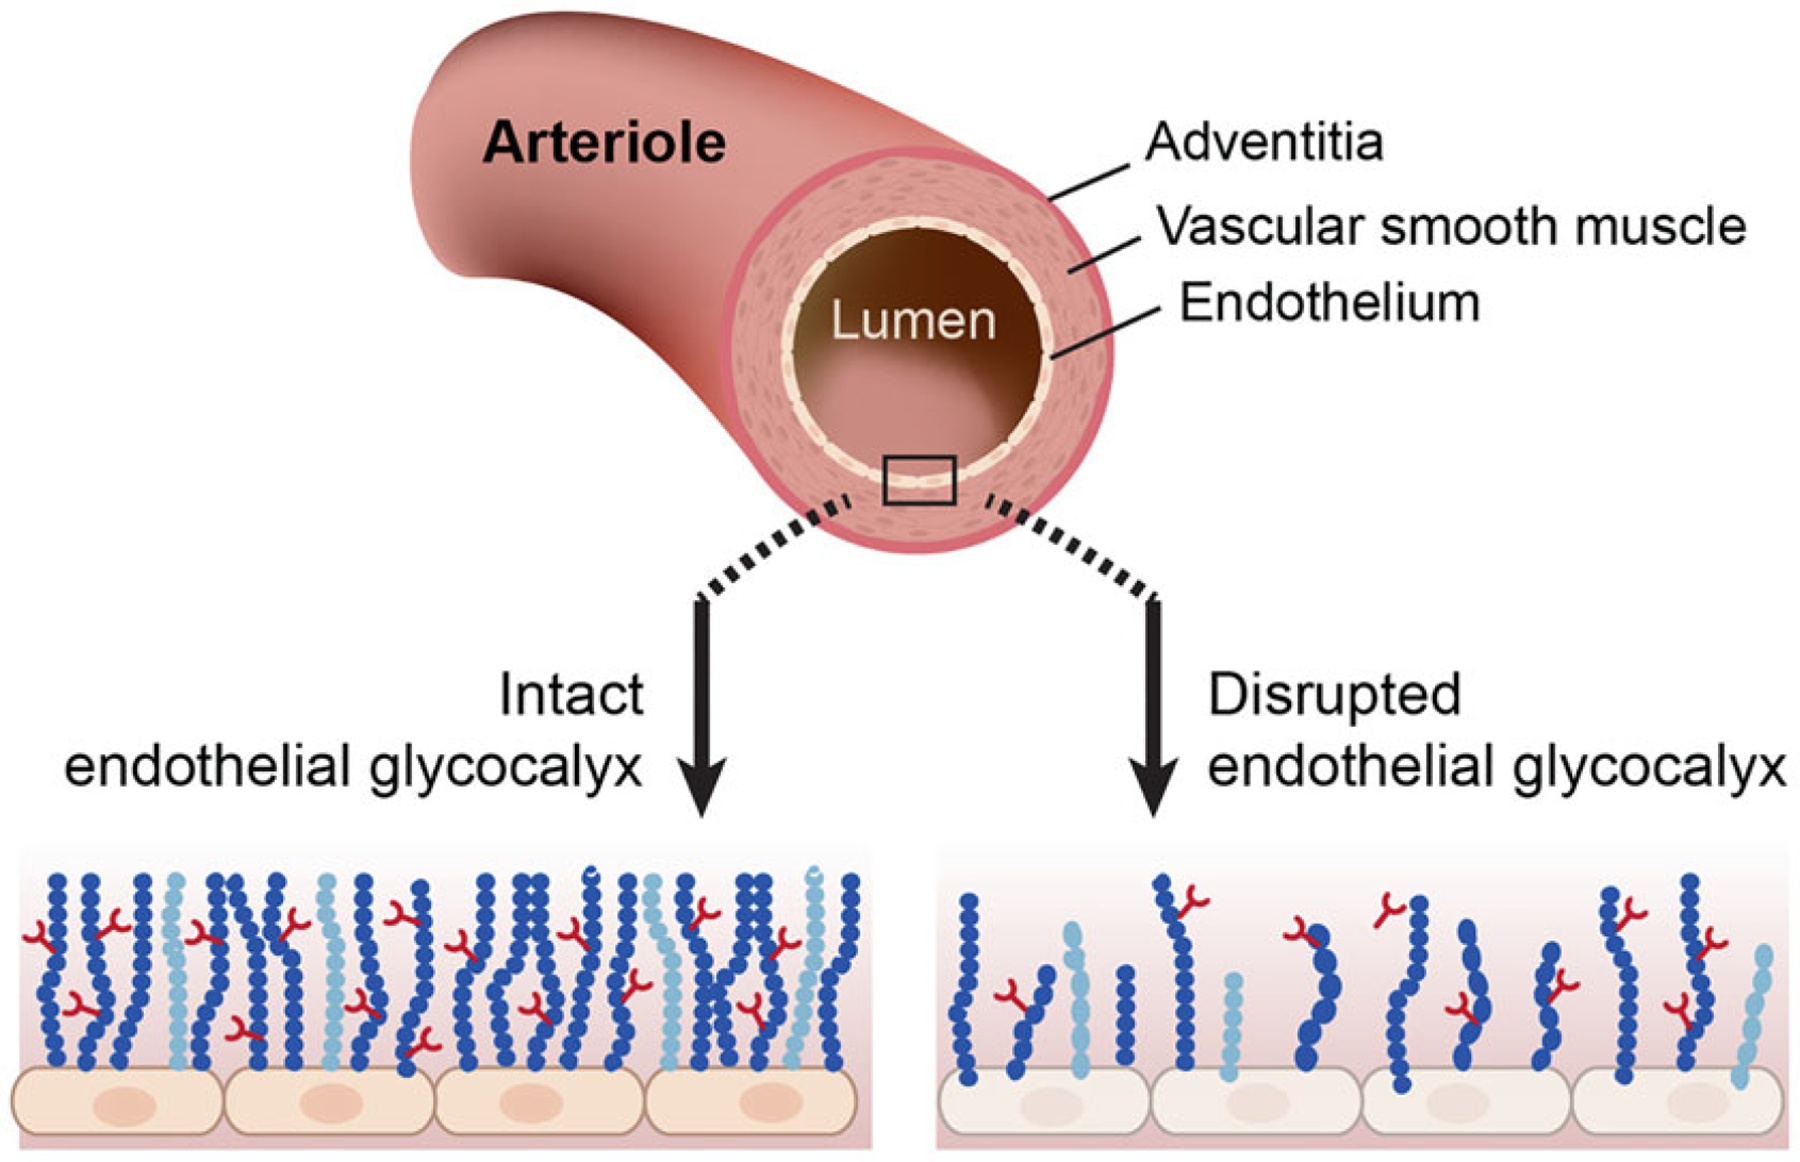
Simplified structure of an arteriole and the location of the endothelial glycocalyx
GAGs play important roles in myriad aspects of cell physiology, and undergo remodeling in response to pathophysiology. Recently we reported that structure and function of the glycocalyx in general, and GAGs in particular, is compromised in the context of diabetes to an extent that renders the endothelium susceptible to inflammatory stimuli [3]. Specifically, arterial endothelial cells obtained from diabetic patients exhibited heightened monocyte binding and displayed exaggerated mRNA indexes of inflammation (e.g., IL-8, VCAM1, and E-selectin) vs. endothelial cells acquired from healthy individuals [3]. Further, metabolic radiolabeling indicated [35S] sulfate incorporation into cell surface GAGs was lower in endothelial cells acquired from diabetic vs. non-diabetic individuals, and that heparan sulfate and chondroitin sulfate (the most prominent endothelial GAGs) were shed to a similar degree. While the endothelial glycocalyx is reportedly compromised in diabetic vasculature of both type 1 and type 2 diabetic patients [11, 12], and endothelial dysfunction exists in these patients [13, 14], strong causal evidence that disruption of the glycocalyx per se evokes endothelial dysfunction has not been shown. Ongoing studies are addressing this issue in our laboratory by measuring vascular reactivity ex vivo in: (a) arteries ± incubation with enzymes that disrupt components of the glycocalyx; and in (b) arteries from mice with relevant genetic mutations. A detailed description of assessing vasomotion ex vivo in conductance and resistance arteries now follows. Importantly, we provide preliminary yet strong proof of concept that acute disruption of one of the predominant GAGs i.e., heparan sulfate, using heparitinase III, impairs intraluminal flow-mediated vasodilation in murine resistance arteries.
2. Materials
Arterial cannulae are made using borosilicate glass (1.2 mm outer diameter; 0.69 mm inner diameter), nylon sutures (DMT, Ann Arbor, MI) and a pipette puller (P-97, Sutter Instrument, Novato, CA).
-
Stock buffers (see Note 1).
Physiological saline solution (PSS) stock (5X): 650 mM NaCl, 23.5 mM KCl, 5.9 mM KH2PO4, 5.85 mM MgSO4, 0.13 mM EDTA, 5.8 mM CaCl2. Add 37.99 g NaCl, 1.75 g KCl, 0.8 g KH2PO4, 1.45 g MgSO4, 0.05 g EDTA, 8 ml of 1 M CaCl2 solution to 700 ml MilliQ water, dissolve, top up to 1000 ml.
-
Daily solutions (see Notes 2 and 3).
Daily PSS: 800 ml MilliQ water +200 ml of PSS stock. Add 1 g glucose immediately. 30 min prior to use add 1.25 g NaHCO3.
3. Methods
This communication describes the measurement of function in resistance and conductance arteries pressurized to 60 mmHg i.e., isobaric procedures. In addition, by altering the pressure gradient across the vessel segment, step-wise increases in intraluminal flow-rate can be attained. In this manner, shear stress induced (i.e., flow-mediated) vasodilation can be measured. This ex vivo approach allows for a rigorous assessment of endothelial and vascular smooth muscle function in the absence of neural, humoral, and mechanical influences. A typical vessel experiment in our laboratory involves two arteries using two myograph chambers. One mesenteric artery (resistance vessel) or one femoral artery (conductance artery) from a wild type mouse and a mutant mouse can be studied simultaneously. The following is a standard protocol that requires ~6–8 h to complete. Procedures are identical for femoral (Fig. 2a) and mesenteric (Fig. 2b) arteries. Representative images from respective interventions from a mesenteric artery are shown in Fig. 3a–f. Protocols will describe the vessel mounting procedure, gradual pressurization of the vessel, non-receptor-mediated vasoconstriction, receptor-mediated vasoconstriction, flow-mediated vasodilation, endothelium-dependent vasodilation, and endothelium-independent vasodilation. Furthermore, procedures designed to estimate the contribution to intraluminal flow-mediated vasodilation from nitric oxide (NO) and the predominant GAG heparan sulfate also are described.
Fig. 2.
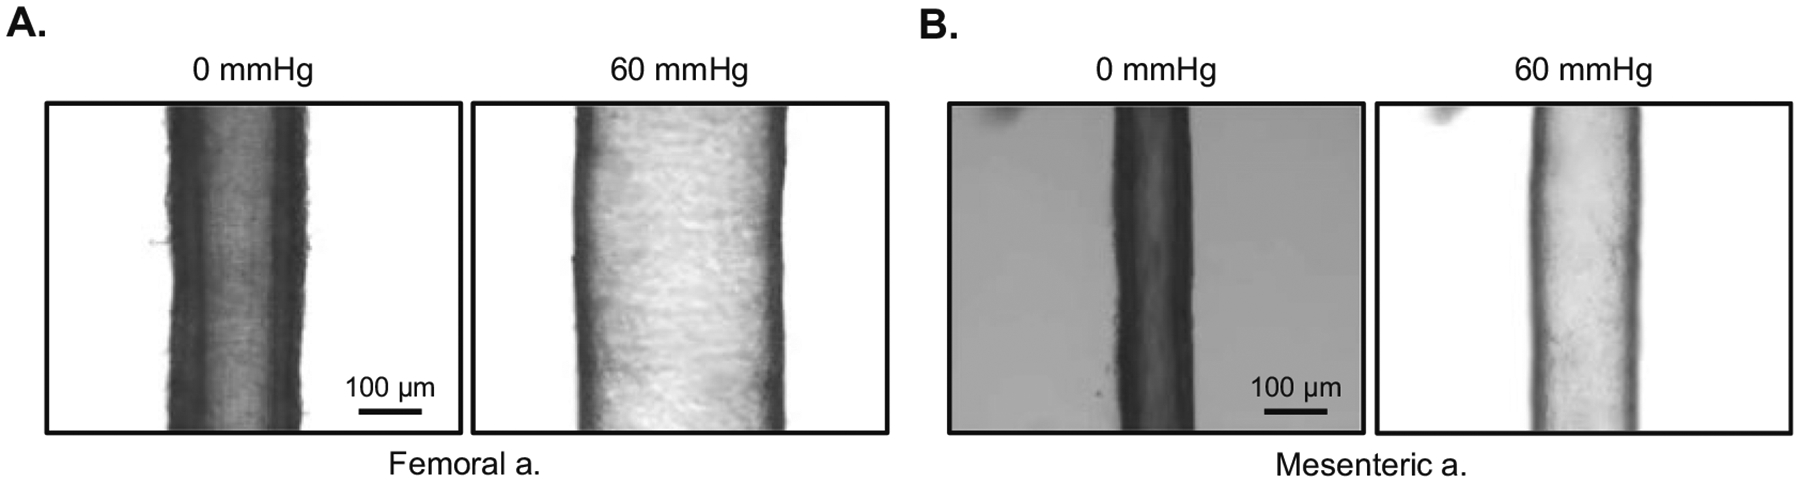
A femoral (a) and mesenteric artery (b) cannulated at both ends with a glass micropipette, submerged in an myograph chamber, and viewed from above using a microscope. Each vessel is shown at a pressure (P1 = P2) of 0 mmHg and 60 mmHg
Fig. 3.
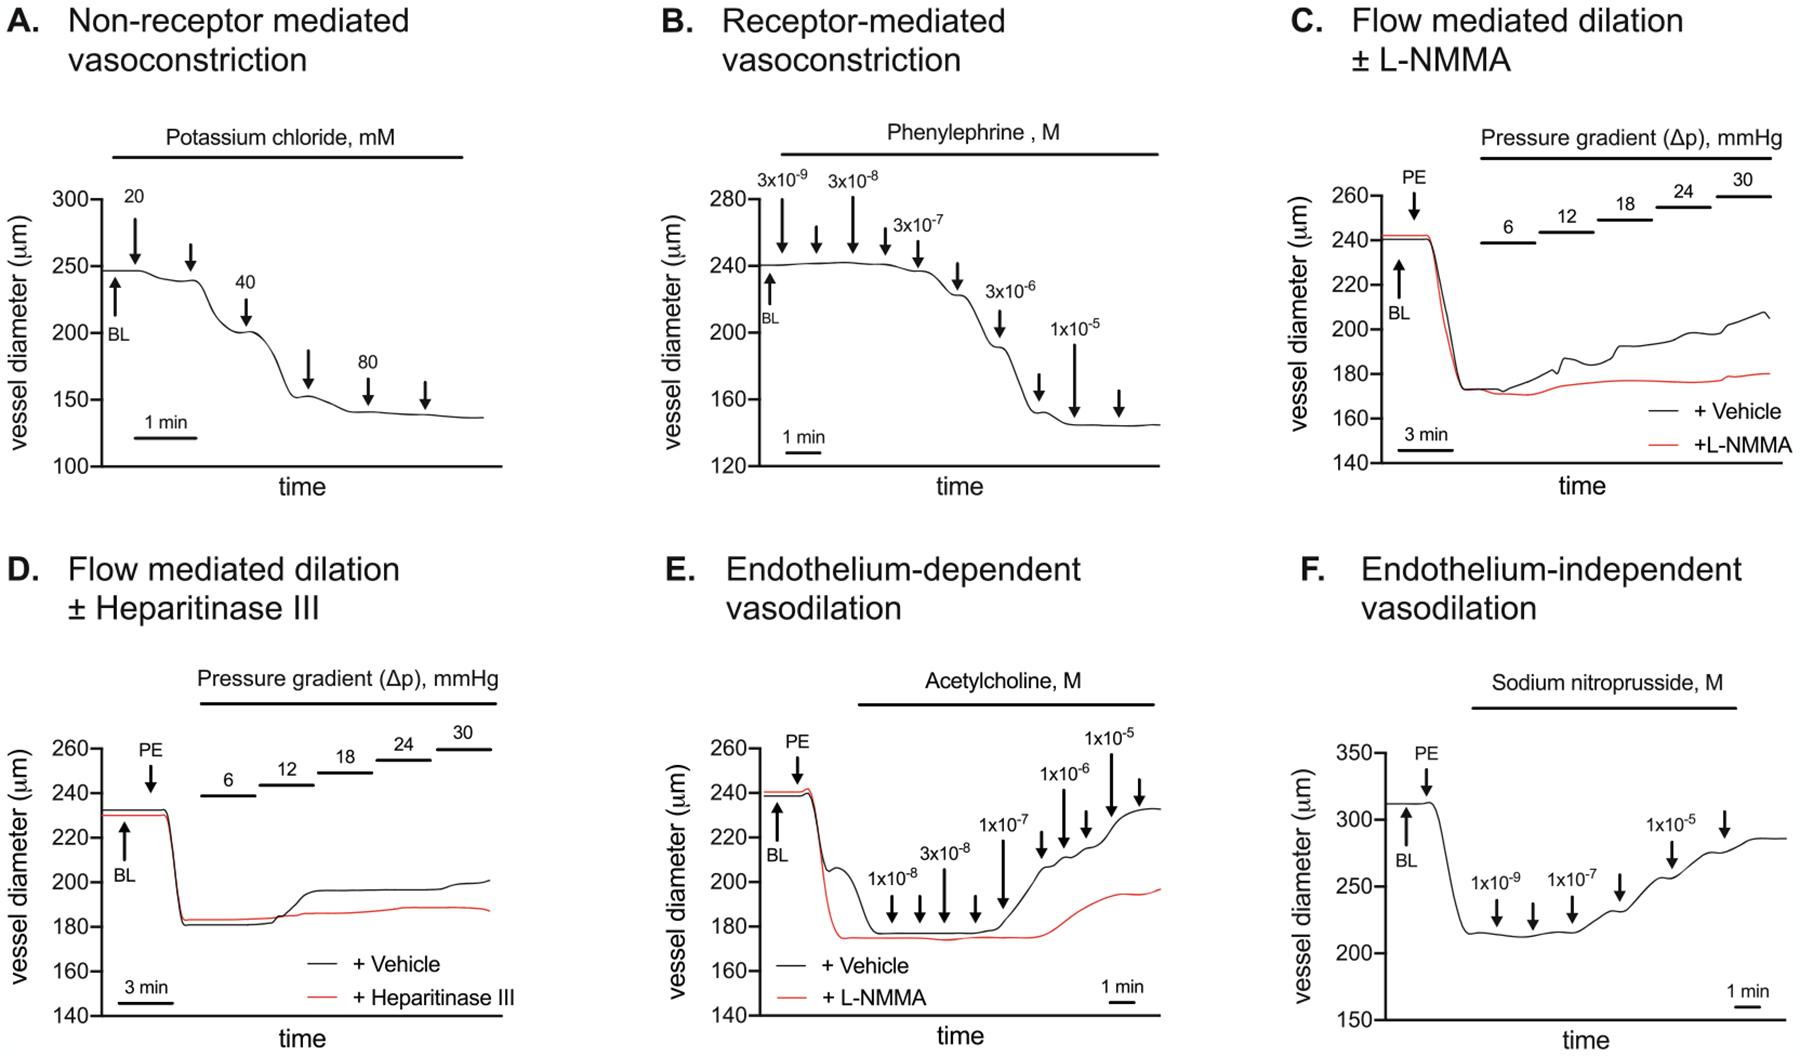
Mesenteric artery vasomotion in response to: (a) non-receptor-mediated vasoconstriction to potassium chloride (KCl; 20–100 mM, Panel A); (b) receptor-mediated vasoconstriction to phenylephrine (PE; 1 × 10⁻⁹ – 1 ×10⁻⁵ M, Panel B); intraluminal flow-mediated vasodilation (ΔP 6 – ΔP 30) in the absence (black line) and presence (red line) of (c) nitric oxide synthase inhibition using NG-methyl-L-arginine acetate salt (L-NMMA; Panel C; or (d) heparitinase III (Panel D); (e) endothelium-dependent vasodilation to acetylcholine (ACh; 1 × 10⁻⁸ – 3 × 10⁻⁵ M, Panel E) in the absence (black line) or presence (red line) of L-NMMA; and (f) endothelium-independent vasodilation to sodium nitroprusside (SNP; 1 × 10⁻⁹ – 1 × 10⁻⁴ M, Panel F). Vasomotion shown in Panels A, B, E, and F were completed with arteries perfused at 60 mmHg i.e., P1 = P2. Vasomotion shown in Panels C and D were completed in response to pressure gradients (ΔP) across the vessel. BL, baseline
3.1. Animals
Mice are housed under controlled temperature (22 °C) and light conditions (12-h light/12-h dark cycle) and are provided with food and water ad libitum. All experiments are performed in accordance with protocols approved by the Institutional Animal Care and Use Committee of the University of Utah.
3.2. Artery Collection
Mice are anesthetized using 2–5% inhaled isoflurane, the chest is opened, a small incision is made in the right atrium, and 10 ml PSS (pH 7.35–7.40) is slowly perfused through the left ventricle using a 22 g needle. Next, the heart is excised, and the respective arteries (e.g., mesenteric and femoral) are dissected free from adherent tissue while bathed in ice-cold PSS (see Notes 4 and 5).
3.3. Myograph Preparation
Two glass cannulas are connected to the right side (P1 side) or left side (P2 side) of the pressure myograph and perfused bubble-free with PSS buffer. The P1 cannula is connected to the inlet pressure transducer and the P2 cannula is connected to the outlet pressure transducer. Both cannulas are aligned with the aid of a dissecting microscope (see Note 6).
3.4. Mounting Vessels
The general mounting procedure is similar regardless of artery type. We refer to the mesenteric artery since that is the vessel from which representative images are shown in this communication. Once a segment of mesenteric artery (without side-branches) is dissected free from surrounding tissue, and cleaned of adherent fat, it is transferred to the myograph chamber containing cold PSS buffer. Next, using fine tissue forceps, with the aid of a dissecting micro-scope, the proximal portion of the artery is slipped onto the P1 cannula and secured by a double knot (see Note 7). Through the P1 cannula, the artery then is loaded with PSS buffer. Making sure the entire artery is perfused, the distal end of the artery is slipped onto the P2 cannula and secured with a double knot. Paying careful attention, the P1 cannula is perfused slowly and gently to ensure that the P1 tubing, the arterial segment, and the P2 tubing is filled and bubble-free.
3.5. Vessel Equilibration
The myograph chamber containing the arterial segment is placed on the microscope stand (Zeiss, Jena, Germany). Tubing from the P1 reservoir is perfused with PSS and, devoid of bubbles, connected to the P1 cannula. Tubing from the P2 reservoir is perfused with PSS and, devoid of bubbles, connected to the P2 cannula. The P1 reservoir contains ≥100 ml of fresh cold PSS buffer while the P2 reservoir is empty. The plexiglass chamber lid then is positioned and a very gentle stream of 95% oxygen/5% carbon dioxide containing bubbles is directed into the corner of the myograph chamber. Next, the chamber and reservoirs are warmed gradually to 37 °C (measured via a temperature probe placed in the chamber), concurrent with 10 mmHg increases in pressure from 0 to 60 mmHg at 5 min intervals. Once the target temperature (37 °C) and pressure (60 mmHg) are attained, the myograph chamber contents are suctioned and refilled with 8 ml × 37 °C PSS (warm). Chamber contents are suctioned and refilled at 15–20 min intervals throughout the experiment (see Note 8).
3.6. Non-receptor-Mediated Vasoconstriction
Once the vessel has been pressurized to 60 mmHg for 20 min at 37 °C i.e., P1 and P2 = 60 mmHg, non-receptor-mediated vasoconstriction responses to potassium chloride (KCl; 20–100 mM) are initiated. KCl depolarizes the vascular smooth muscle cell membrane potential to open voltage-gated Ca2+ channels (i.e., L-type Ca2+ channels), resulting in vasoconstriction of the vascular smooth muscle. Vasoconstriction can be quantified by measuring the outer diameter (OD) of the blood vessel, which becomes smaller with vasoconstriction. See Note 9 for KCl preparation, Note 10 for KCl administration, and Note 11 for calculations. See Fig. 3a for a representative image.
3.7. Receptor-Mediated Vasoconstriction
At 20 min receptor-mediated vasoconstriction to phenylephrine (PE) is completed in arteries pressurized to 60 mmHg (i.e., P1 = P2). PE binds to α1-adrenergic receptors that are coupled to Gq proteins. PE-mediated α1-activation stimulates inositol tri-phosphate (IP3) mediated release of Ca2+, which triggers Rho-kinase, inhibits myosin light-chain phosphatase, and evokes vascular smooth muscle constriction. See Note 12 for PE preparation, Note 13 for PE administration procedures, and Note 14 for calculations. See Fig. 3b for a representative image.
3.8. Intraluminal Flow-Mediated Vasodilation
Intraluminal flow is fastest in the center of the vessel. The single layer of endothelial cells that make up the endothelium provides frictional forces that slow the flow. These frictional forces stimulate mechanoreceptors e.g., Piezo1 [19] and G-coupled proteins [20]. Various intracellular signaling mechanisms then are activated to release endothelial-derived substances (e.g., nitric oxide) that evoke subsequent vascular smooth muscle cell dilation that can be measured by an increase in the OD of the artery. This is termed flow-mediated vasodilation. To measure this, vessels are preconstricted using PE (see Note 15). Next, the vessel segment is exposed to 5 pressure gradients (ΔP) × 3 min each. Subsequent increases in arterial OD reflect intraluminal flow-mediated vasodilation. This procedure, when coupled with an assessment of endothelium-independent vasodilation, is one approach that can be used to estimate arterial endothelial function.
Once the appropriate preconstriction diameter is attained and stable, a pressure gradient of 6 mmHg is established by setting P1 to 63 and P2 to 57 for 3 min (ΔP = 6 mmHg), followed by setting P1 to 66 and P2 to 54 for 3 min (ΔP = 12 mmHg), and so on. Once the protocol is completed, P1 and P2 are re-set to 60 mmHg. See Note 16 for generating intraluminal flow by the pressure gradient, Note 17 for calculations and Fig. 3c for a representative image.
3.9. Intraluminal Flow-Mediated Vasodilation + Nitric Oxide (NO) Synthase (NOS) Inhibition
One function of the glycocalyx might be to sense increased flow, and signal the endothelium to release substances (e.g., NO) that evoke vascular smooth muscle relaxation i.e., vasodilation. This experiment is designed to assess the contribution from NO to intraluminal flow-mediated vasodilation. First, the “control” response to intraluminal flow-mediated vasodilation is assessed (see Subheading 3.7). Next, to estimate the specific contribution to flow-mediated vasodilation from NO, arteries incubate intraluminally and extraluminally for 30 min with the NOS inhibitor NG-methyl-L-arginine acetate salt (L-NMMA; 10−3 M). L-NMMA competes with the endogenous NOS substrate L-arginine. Because L-NMMA is administered to the vessel bathing medium in excess, it outcompetes L-arginine for NOS binding sites and thereby limits the capability for NO generation. After incubation with L-NMMA, the artery is preconstricted with PE (see Note 17). Then the vessel is exposed to the same five pressure gradients and intraluminal flow-mediated vasodilation is measured. Note the red line graph in Fig. 3c. This was completed in the presence of L-NMMA (i.e., + L-NMMA). For each ΔP, less vasodilation is attained + L-NMMA vs. intraluminal flow attained in the absence of L-NMMA (i.e., + vehicle, MilliQ water). This indicates that NO contributes to intraluminal flow-mediated vasodilation. However, because intraluminal flow-mediated vasodilation is not completely prevented by L-NMMA, other factors (e.g., endothelium-derived hyperpolarizing factors; EDHFs) must contribute to the response. See Note 18 for L-NMMA preparation, Note 19 for L-NMMA administration, Note 20 for preconstruction after L-NMMA administration, and Note 17 for calculating intraluminal flow or ACh-evoked vasodilation in the presence of L-NMMA. See Fig. 3c for a representative image.
3.10. Intraluminal Flow-Mediated Dilation + Glycocalyx Disruption
Disruption of the endothelial glycocalyx contributes importantly to blood flow irregularities that might be secondary to arterial endothelial dysfunction in the context of diabetes [1–4]. The glycocalyx is comprised of proteoglycans with GAG side chains, glycoproteins, and plasma proteins that line the luminal surface of blood vessels [5, 6]. The predominant GAGs include heparan sulfate, chondroitin sulfate, and hyaluronan. Evidence exists that an intact glycocalyx serves as a mechanoreceptor that transduces intraluminal shear stress to the vascular smooth muscle cell layer via endothelium-derived factors [7]. Earlier we showed that arterial endothelial cells obtained from diabetic patients exhibit indexes of dysfunction when studied in vitro, and that heparan sulfate and chondroitin sulfate (the most prominent endothelial GAGs) were shed to a similar degree [3]. Strong causal evidence does not exist that disruption of the glycocalyx per se evokes arterial endothelial dysfunction. This experiment is designed to assess the contribution from an intact glycocalyx to intraluminal flow-mediated vasodilation. First, the “control” response to intraluminal flow-mediated vasodilation is assessed (see Subheading 3.7). Next, to estimate the specific contribution to flow-mediated vasodilation from an intact glycocalyx, arteries incubate intraluminally and extraluminally for 45 min with ~0.2 mU/μl heparitinase III (heparinase III) diluted in 3 ml of vehicle. Heparin lyase enzymes, also called heparinases, are enzymes that cleave the glycosidic linkage between hexosamines and uronic acids and are known to cleave heparin and heparan sulfate chains selectively via an elimination mechanism. Heparinase enzymes create a double bond on the non-reducing end of the uronic acid that has UV absorbance at 232 nm and can be used for the detection of oligosaccharide and disaccharide products. Of the three heparinase enzymes (I, II, III) heparitinase III cleaves non-sulfated or N-sulfated domains within heparan sulfate chains [15–18]. Notably, for each ΔP, less vasodilation is attained in the presence (red line graph) vs. the absence (black line graph) of heparitinase III (Fig. 3d). These preliminary data provide proof of concept that shedding of heparan sulfate from endothelial cells obtained from diabetic patients we reported earlier [3] might have relevance concerning arterial vasomotion. In this regard, % vasodilation is greater in the absence vs. the presence of heparitinase III, which disrupts the endothelial glycocalyx. See Note 21 for vehicle preparation, Note 22 for heparitinase III preparation, Note 23 for heparitinase III administration, and Note 17 for calculating intraluminal flow-mediated vasodilation in the presence of heparitinase III. See Fig. 3D for a representative image.
3.11. Endothelium-Dependent Vasodilation: Acetylcholine (Fig. 3e)
To evaluate endothelium-dependent vasodilation in arteries pressurized to 60 mmHg (i.e., P1 = P2), PE is used to preconstrict the arteries to 50% of maximal PE-induced constriction (see Note 15). When PE-induced preconstriction is stable, an acetylcholine (ACh) dose–response curve is completed. ACh binds to M3 muscarinic receptors on the vascular endothelium to increase intracellular Ca2+. Elevated intracellular Ca2+ then activates constitutive type III NOS, which enables conversion of the amino acid substrate L-arginine to the products L-citrulline and NO. As such, ACh is used to stimulate endothelium-dependent vasodilation. See Note 24 for ACh preparation, Note 25 for ACh administration, and Note 17 for calculations. See Fig. 3e for a representative image of ACh-evoked vasodilation in the absence (black line graph) and presence (red line graph) of L-NMMA. Congruent with results shown in Fig. 3c, ACh-evoked vasodilation is not completely prevented by L-NMMA, indicating that other factors released from the endothelium (e.g., EDHFs, cyclooxygenase metabolites) might contribute to the response.
3.12. Endothelium-Independent Vasodilation: Sodium Nitroprusside (Fig. 3f)
NO that is produced by endothelial cells diffuses to the vascular smooth muscle where it activates guanylyl cyclase (GC). GC stimulation increases cGMP formation which inhibits Ca2+ entry into the vascular smooth muscle and precipitates vasodilation. Sodium nitroprusside (SNP) is a nitrodilator that releases NO spontaneously by activating GC directly. As such, SNP is used to assess endothelium-independent vasodilation. To evaluate endothelium-independent vasodilation, PE is used to preconstrict the arteries from baseline OD to ~50% of maximal PE-induced vasoconstriction (see Note 15). When PE-induced preconstriction is stable, a SNP dose–response curve is completed. See Note 26 for SNP preparation, Note 27 for SNP administration procedures, and Note 17 for calculating SNP-evoked vasodilation. See Fig. 3f for a representative image.
4. Notes
-
PSS stock should be prepared in advance of the experimental day.
Put 700 ml MilliQ water on stir plate with stir bar.- Add each component.
- Stir until completely dissolved.
- Add MilliQ water to 1000 ml graduated cylinder.
- Store at 4 °C.
Daily solutions should be prepared on the morning of the experiment, prior to obtaining vessels. Stir vigorously after adding glucose and bicarbonate. Use in myograph chambers when pH 7.35–7.45. Upon reaching pH 7.35, a small stream of bubbling using 95% O2/5% CO2 via fritted glass bubblers should be administered to PSS. Additional daily PSS solutions (i.e., 3–4 × 1 L beakers) should be placed in a heating bath set to 37 °C. These are referred to as “warm” solutions. At least 1 L PSS should remain at room temperature. This is referred to as “cold PSS.”
“Cold” i.e., room temperature PSS placed in a sylgard lined petri dish on top of a freezer pack should be used when dissecting vessels. “Cold” i.e., room temperature PSS should be placed in myograph chambers prior to initiating the heating procedure to 37 °C. Once the arteries and vessel bathing medium in the myograph chamber have reached 37 °C, only “warm” solutions should be added.
Care should be taken not to introduce any bubbles during perfusion of the left ventricle as they will disrupt the endothelial cell layer of the artery and present as dysfunction.
Care should be taken not to stretch, bend, or otherwise physically disturb the artery that will be used for subsequent analysis. Fresh “cold” PSS should be used at 20–30 min intervals in order to maintain pH of the bathing medium during the time required to dissect the artery.
Care should be taken not to perfuse at high pressures when “loading” the cannula with PSS as this will damage the highly sensitive pressure transducers.
Two double knotted yet loose nylon sutures—not tightened—should be placed on the P1 cannula and the P2 cannula prior to slipping the arterial segment onto the pipette. Once each end of the vessel has been placed onto the cannula, the two knots on either side can be tightened.
Oftentimes the vessel will develop a bend when pressurized. This can be straightened by observing the vessel through the microscope viewing window and adjusting the P1 cannula.
- KCl preparation for dose–response curve. Add 2 g KCl to 5 ml MilliQ water. Top up to 6 ml. This makes a 26.8 mM KCl stock solution.
- Prepare in 10 ml conical tube.
- Vortex vigorously.
- Place in warm water bath until completely clear.
- Vortex immediately prior to use.
- KCl administration to myograph chamber.
- Add 29 μl of 26.8 mM stock solution to 8 ml myograph chamber via 0–100 μl pipette.
- 29 μl → 20 mM
- 19 μl → 30 mM
- 19 μl → 40 mM
- 38 μl → 60 mM
- 38 μl → 80 mM
- 38 μl → 100 mM
- Each administration is followed by gentle mixing using a 1000 μl pipette by withdrawing and adding back the same 300 μl volume subsequent to each KCl addition.
- After maximal constriction to a given dose is achieved, the subsequent dose can be administered.
- After maximal constriction to the last dose is achieved, rinse myograph chamber 2× with 8 ml of daily PSS and set timer.
- Rinse myograph chamber 1× at 10 min and 1× at 15 min.
- At 20 min, start the next curve i.e., phenylephrine.
Calculations for non-receptor-mediated vasoconstriction (Fig. 3A). Values are presented as a percentage of baseline outer diameter (OD). For example, baseline OD is 246 μm, and the response to administering 20 mM KCl is 238 μm. This is expressed as relative change of OD (% of baseline) i.e., 238 μm/246 μm × 100 = 97% of baseline. This represents 3% constriction from baseline. The response to administering 30 mM KCl is 212 μm. This can be expressed 212/246 × 100 = 86% of baseline. This represents 14% constriction from baseline.
- Phenylephrine (PE) preparation.
- Make stock in 15 ml conical tube:
- 9.7 mg PE + 14 ml MillQ water → solution A (1 × 10⁻⁵ M).
- Use the stock to dilute in eppendorf tube (NOTE: vortex in between each dilution):
- 360 μl A + 117 μl MillQ water → solution B (6 × 10⁻⁶ M)
- 360 μl B + 182 μl MillQ water → solution C (3 × 10⁻⁶ M)
- 360 μl C + 672 μl MillQ water → solution D (1 × 10⁻⁶ M)
- 360 μl D + 900 μl MillQ water → solution E (3 × 10⁻⁷ M)
- 360 μl E + 672 μl MillQ water → solution F (1 × 10⁻⁷ M)
- 360 μl F + 900 μl MillQ water → solution G (3 × 10⁻⁸ M)
- 360 μl G + 672 μl MillQ water → solution H (1 × 10⁻⁸ M)
- 360 μl H + 900 μl MillQ water → solution I (3 × 10⁻⁹ M)
- 360 μl I + 360 μl MillQ water → solution J (1 × 10⁻⁹ M)
- J-E preconstriction mixture: 350 μl A + 750 μl MillQ water → J-E (3 × 10⁻⁷ M).
- Store at 4 °C.
- PE administration to myograph chamber.
- Add 10 μl to 8 ml myograph chamber via 0–100 μl pipette.
- 10 μl solution J → 1 × 10⁻⁹ M
- 10 μl solution I → 3 × 10⁻⁹ M
- 10 μl solution H → 1 × 10⁻⁸ M
- 10 μl solution G → 3 × 10⁻⁸ M
- 10 μl solution F → 1 × 10⁻⁷ M
- 10 μl solution E → 3 × 10⁻⁷ M
- 10 μl solution D → 1 × 10⁻⁶ M
- 10 μl solution C → 3 × 10⁻⁶ M
- 10 μl solution B → 6 × 10⁻⁶ M
- 10 μl solution A → 1 × 10⁻⁵ M
- Followed by gentle mixing using a 1000 μl pipette by withdrawing and adding back the same 300 μl volume subsequent to each PE addition.
- Rinse 2× with 8 ml of daily PSS and set timer.
- Rinse 1× at 10 min and another at 15 min.
- At 20 min, start the next curve i.e., intraluminal flow-mediated vasodilation.
Calculations for non-receptor-mediated vasoconstriction (Fig. 3b). Values are presented as a percentage of baseline OD. For example, baseline OD is 240 μm, and the response to administering 1 × 10⁻⁷ M PE is 236 μm. This is expressed as relative change of OD (% of baseline) i.e., 236 μm/240 μm 100 = 98% of baseline. This represents 2% constriction from baseline. The response to administering 3 × 10⁻⁶ PE is 153 μm. This can be expressed 153/240 × 100 = 63% of baseline. This represents 37% constriction from baseline.
Calculating preconstriction diameter. In order to determine intraluminal flow-mediated dilation (see Subheading 3.7), endothelium-dependent vasodilation (see Subheading 3.10), or endothelium-independent vasodilation (see Subheading 3.11), the arterial segment must be preconstricted. Based on our experience, the target OD is ~50% of the maximal PE-induced reduction in OD (see Fig. 3b). For example, if baseline OD is 240 μm and the maximal PE-induced reduction in OD is 144 μm, then [(240 μm − 144 μm) × 0.50] = 48 μm. The target OD would then be 240 μm − 48 μm = 192 μm. To achieve the appropriate preconstriction diameter in vessels perfused to 60 mmHg, 10 μl of a preconstriction mixture (see Note 12) is added to the vessel myograph chamber. This represents PE “E.” If necessary, 2–10 μl of PE “D” is added to achieve ~50% of the baseline diameter.
- Generation of intraluminal flow by establishing a pressure gradient.
- Set the protocol (6 tasks) for intraluminal flow (pressure gradient, ΔP) by Sequencer in the Myoview software [Danish Myo Technologies (DMT), Ann Arbor, MI].
- Task 1 (ΔP 6 mmHg): 63 mmHg in P1 pressure and 57 mmHg in P2 pressure for 3 min.
- Task 2 (ΔP 12 mmHg): 66 mmHg in P1 pressure and 54 mmHg in P2 pressure for 3 min.
- Task 3 (ΔP 18 mmHg): 69 mmHg in P1 pressure and 51 mmHg in P2 pressure for 3 min.
- Task 4 (ΔP 24 mmHg): 72 mmHg in P1 pressure and 48 mmHg in P2 pressure for 3 min.
- Task 5 (ΔP 30 mmHg): 75 mmHg in P1 pressure and 45 mmHg in P2 pressure for 3 min.
- Task 6 (ΔP 0 mmHg): 60 mmHg in P1 pressure and 60 mmHg in P2 pressure.
- Once the vessel is preconstricted to 50% of maximal PE-induced constriction diameter, and is stable, the 6 tasks are initiated. Do not exchange the contents of the myograph chamber during this time.
- Upon completion of the 6 tasks, and P1 and P2 have been reset to 60 mmHg, rinse 2× with 8 ml of daily warm PSS.
- Rinse 1× at 10 min and 1× at 15 min with daily warm PSS.
- At 20 min, start the next curve i.e., intraluminal flow-mediated vasodilation + nitric oxide synthase inhibition or heparan sulfate disruption.
Calculating flow-mediated vasodilation (Fig. 3c). See solid black line in Fig. 3c (- L-NMMA). Baseline OD (e.g., 240 μm), preconstriction OD (176 μm), and OD (185 μm) in response to ΔP = 12 mmHg are recorded. The % vasodilation in response to the flow by ΔP = 12 mmHg = [(185 μm − 176 μm)/(240 μm − 176 μm)] × 100 = 14%. The response to the flow by ΔP 18 mmHg is calculated as [(194 μm−176 μm)/(240 μm−176 μm)] 100 = 28%. Responses are expressed as % vasodilation. Identical procedures are used to calculate intraluminal flow-mediated vasodilation in the presence of nitric oxide synthase inhibition (Fig. 3c), glycocalyx disruption (Fig. 3d), endothelium-dependent vasodilation (Fig. 3e) and endothelium-independent vasodilation (Fig. 3f).
- L-NMMA preparation.
- 100 mg L-NMMA +1 ml MilliQ water.
-
L-NMMA administration:
Extraluminal i.e., in the myograph chamber.- Add 21 μl of L-NMMA to 8 ml myograph chamber via 0–100 μl pipette (10−3 M).
- Wait for 30 min.
-
Repeat ACh dose–response curve or flow-mediated vasodilation curve as described earlier.Intraluminal i.e., inside the artery
- Add 400 μl of 10−3 M L-NMMA into tube connected to myograph chamber by 3-way stopcock.
- Open stopcock and load L-NMMA into the artery via a pressure gradient (ΔP 3 mmHg) for 10 min.
- Stop pressure gradient and incubate for 30 min.
To preconstrict arteries to the desired tension in the presence of L-NMMA, much less PE is required. In our experience, it is best to start by administering 3–5 μl of the preconstriction mixture, and add PE as required.
- Preparation for vehicle of Heparitinase III.
- Add 10 ml of 25 × vehicle to 240 ml of MilliQ water.
- Adjust pH from 7.2 to 7.3 before use.
- Heparitinase III preparation.
- Add 0.2 mU/μl of heparitinase III into 3 ml of the vehicle (see Note 25).
- Intraluminal incubation with Heparitinase III.
- Add 400 μl of heparitinase III (see Note 26) into bypassing tube which is connected to myograph chamber by 3-way stopcock.
- Open valves of the bypassing tube and load heparitinase III into the artery by using a pressure gradient (ΔP) of 4 mmHg) × 10 min.
- Stop pressure gradient and wait for 45 min.
- Repeat flow-mediated vasodilation curve as described earlier (see Note 16).
- Acetylcholine (ACh) preparation.
- Make stock in 15 ml conical tube:
- 29.1 mg ACh + 10 ml MillQ water → solution A (3 × 10⁻⁵ M).
- Use the stock to dilute in Eppendorf tube (NOTE: vortex in between each dilution):
- 29.1 mg ACh + 10 ml MillQ water → solution A(3 × 10⁻⁵ M)
- 0.35 ml A + 0.65 ml MillQ water → solution B (1 × 10⁻⁵ M)
- 0.35 ml B + 0.88 ml MillQ water → solution C (3 × 10⁻⁶ M)
- 0.35 ml C + 0.65 ml MillQ water → solution D (1 × 10⁻⁶ M)
- 0.35 ml D + 0.88 ml MillQ water → solution E (3 × 10⁻⁷ M)
- 0.35 ml E + 1.4 ml MillQ water → solution F (1 × 10⁻⁷ M)
- 1.05 ml F + 0.36 ml MillQ water → solution G (6 × 10⁻⁸ M)
- 0.5 ml G + 1 ml MillQ water→solution H (3 × 10⁻⁸ M)
- Put 0.5 ml of solution H in one Eppendorf → solution I (2 × 10⁻⁸ M).
- Put 0.5 ml of solution H in one Eppendorf → solution J (1 × 10⁻⁸ M).
- Store at 4 °C.
- ACh administration to myograph chamber.
- Preconstrict vessels to 50% based upon PE constriction.
- Add 10 μl to 8 ml myograph chamber via 0–100 μl pipette.
- 10 μl solution J → 1 × 10⁻⁸ M
- 10 μl solution I → 2 × 10⁻⁸ M
- 10 μl solution H → 3 × 10⁻⁸ M
- 10 μl solution G → 6 × 10⁻⁸ M
- 10 μl solution F → 1 × 10⁻⁷ M
- 10 μl solution E → 3 × 10⁻⁷ M
- 10 μl solution D → 1 × 10⁻⁶ M
- 10 μl solution C → 3 × 10⁻⁶ M
- 10 μl solution B → 1 × 10⁻⁵ M
- 10 μl solution A → 3 × 10⁻⁵ M.
- Followed by gentle mixing using a 1000 μl pipette by withdrawing and adding back the same 300 μl volume subsequent to each ACH addition.
- Rinse 2× with 8 ml of daily PSS and set timer.
- Rinse 1× at 10 min and another at 15 min.
- At 20 min, start the next curve.
- Sodium nitroprusside (SNP) preparation.
- Make stock in 5 ml eppendorf tube:
- 34.5 mg SNP per 1.5 ml MillQ water → solution A (10−4 M).
- Use the stock to dilute in Eppendorf tube (NOTE: vortex in between each dilution):
- 100 μl solution A + 900 μl MillQ water → solution B (10−5 M)
- 100 μl solution B + 900 μl MillQ water → solution C (10−6 M)
- 100 μl solution C + 900 μl MillQ water → solution D (10−7 M)
- 100 μl solution D + 900 μl MillQ water → solution E (10−8 M)
- 100 μl solution E + 800 μl MillQ water → solution F (10−9 M).
- Store in 4 °C.
- SNP administration to myograph chamber.
- Preconstrict vessels to 50% based upon PE constriction.
- Add 10 μl to 8 ml myograph chamber via 0–100 μl pipette.
- 10 μl solution F → 10−9 M
- 10 μl solution E → 10−8 M
- 10 μl solution D → 10−7 M
- 10 μl solution C → 10−6 M
- 10 μl solution B → 10−5 M
- 10 μl solution A → 10−4 M.
- Followed by gentle mixing using a 1000 μl pipette by withdrawing and adding back the same 300 μl volume subsequent to each SNP addition.
- Rinse 2× with 8 ml of daily PSS and set timer.
- Rinse 1× at 10 min and another at 15 min.
- At 20 min, start the next curve.
Acknowledgments
Support was provided for: JMC by a Graduate Research Fellowship from the University of Utah and an American Heart Association (AHA) Predoctoral Fellowship (20PRE35110066); KL by an American Physiological Society Undergraduate Research Fellowship and the University of Utah Undergraduate Research Opportunities Program; JDS by AHA16GRNT31050004, NIH RO3AGO52848, and NHLBI RO1 Grant HL141540; PVAB by NIH/NCCIH R01AT010247, and USDA/National Institute of Foods and Agriculture Award (2019-67017-29253); KB by NHLBI grant P01HL107152.
References
- 1.Ruane-O’Hora T, O’Malley D, Buckley MM, Markos F (2019) Heparan sulphate and hyaluronic acid components of the glycocalyx do not play a role in flow-mediated dilation of the iliac in the anaesthetized pig. Can J Physiol Pharmacol 97(8):746–752 [DOI] [PubMed] [Google Scholar]
- 2.McClatchey PM, Schafer M, Hunter KS, Reusch JE (2016) The endothelial glycocalyx promotes homogenous blood flow distribution within the microvasculature. Am J Physiol Heart Circ Physiol 311(1):H168–H176 [DOI] [PMC free article] [PubMed] [Google Scholar]
- 3.Cutler BR, Gholami S, Chua JS, Kuberan B, Anandh Babu PV (2018) Blueberry metabolites restore cell surface glycosaminoglycans and attenuate endothelial inflammation in diabetic human aortic endothelial cells. Int J Cardiol 261:155–158 [DOI] [PMC free article] [PubMed] [Google Scholar]
- 4.Gowd V, Gurukar A, Chilkunda ND (2016) Glycosaminoglycan remodeling during diabetes and the role of dietary factors in their modulation. World J Diabetes 7(4):67–73 [DOI] [PMC free article] [PubMed] [Google Scholar]
- 5.Kolsen-Petersen JA (2015) The endothelial glycocalyx: the great luminal barrier. Acta Anaesthesiol Scand 59(2):137–139 [DOI] [PubMed] [Google Scholar]
- 6.Kolarova H, Ambruzova B, Svihalkova Sindlerova L, Klinke A, Kubala L (2014) Modulation of endothelial glycocalyx structure under inflammatory conditions. Mediat Inflamm 2014:694312. [DOI] [PMC free article] [PubMed] [Google Scholar]
- 7.Pries AR, Secomb TW, Gaehtgens P (2000) The endothelial surface layer. Pflugers Arch 440(5):653–666 [DOI] [PubMed] [Google Scholar]
- 8.van den Berg BM, Vink H, Spaan JA (2003) The endothelial glycocalyx protects against myocardial edema. Circ Res 92(6):592–594 [DOI] [PubMed] [Google Scholar]
- 9.Mulivor AW, Lipowsky HH (2002) Role of glycocalyx in leukocyte-endothelial cell adhesion. Am J Physiol Heart Circ Physiol 283(4): H1282–H1291 [DOI] [PubMed] [Google Scholar]
- 10.Li Q, Bolli R, Qiu Y, Tang XL, Murphree SS, French BA (1998) Gene therapy with extracellular superoxide dismutase attenuates myocardial stunning in conscious rabbits. Circulation 98(14):1438–1448 [DOI] [PubMed] [Google Scholar]
- 11.Broekhuizen LN, Lemkes BA, Mooij HL et al. (2010) Effect of sulodexide on endothelial glycocalyx and vascular permeability in patients with type 2 diabetes mellitus. Diabetologia 53 (12):2646–2655 [DOI] [PMC free article] [PubMed] [Google Scholar]
- 12.Wasty F, Alavi MZ, Moore S (1993) Distribution of glycosaminoglycans in the intima of human aortas: changes in atherosclerosis and diabetes mellitus. Diabetologia 36(4):316–322 [DOI] [PubMed] [Google Scholar]
- 13.Ding H, Triggle CR (2010) Endothelial dysfunction in diabetes: multiple targets for treatment. Pflugers Arch 459(6):977–994 [DOI] [PubMed] [Google Scholar]
- 14.Triggle CR, Ding H (2010) A review of endothelial dysfunction in diabetes: a focus on the contribution of a dysfunctional eNOS. J Am Soc Hypertens 4(3):102–115 [DOI] [PubMed] [Google Scholar]
- 15.Babu P, Kuberan B (2010) Fluorescent-tagged heparan sulfate precursor oligosaccharides to probe the enzymatic action of heparitinase I. Anal Biochem 396(1):124–132 [DOI] [PMC free article] [PubMed] [Google Scholar]
- 16.Galliher PM, Cooney CL, Langer R, Linhardt RJ (1981) Heparinase production by Flavobacterium heparinum. Appl Environ Microbiol 41 (2):360–365 [DOI] [PMC free article] [PubMed] [Google Scholar]
- 17.Godavarti R, Sasisekharan R (1996) A comparative analysis of the primary sequences and characteristics of heparinases I, II, and III from Flavobacterium heparinum. Biochem Biophys Res Commun 229(3):770–777 [DOI] [PubMed] [Google Scholar]
- 18.Linhardt RJ, Galliher PM, Cooney CL (1986) Polysaccharide lyases. Appl Biochem Biotechnol 12(2):135–176 [DOI] [PubMed] [Google Scholar]
- 19.Wang S, Chennupati R, Kaur H, Iring A, Wettschureck N, Offermanns S (2016) Endothelial cation channel PIEZO1 controls blood pressure by mediating flow-induced ATP release. J Clin Invest 126(12):4527–4536 [DOI] [PMC free article] [PubMed] [Google Scholar]
- 20.Xu J, Mathur J, Vessieres E et al. (2018) GPR68 Senses Flow and Is Essential for Vascular Physiology. Cell 173(3):762–775 e716. [DOI] [PMC free article] [PubMed] [Google Scholar]