Abstract
Electrostatic potentials around macromolecules in the presence of mobile charges are difficult to assess especially for highly charged systems. Here, we report measurements of local electrostatic potentials around DNA by paramagnetic NMR. Through quantitative analysis of NMR paramagnetic relaxation enhancement arising from positively charged or neutral paramagnetic cosolutes, we were able to determine local electrostatic potentials around 1H nuclei at >100 sites in major and minor grooves of 13C,15N-labeled 15-bp DNA at 100 mM NaCl. Our experimental electrostatic potential data directly confirmed the Coulombic end effects of DNA. The effective near-surface electrostatic potentials from the NMR data were in good agreement with the theoretical predictions with the Poisson-Boltzmann equation. This NMR method allows for unprecedented experimental investigations into the electrostatic properties of nucleic acids.
Keywords: cosolute, electrostatics, ions, nucleic acids, Poisson-Boltzmann
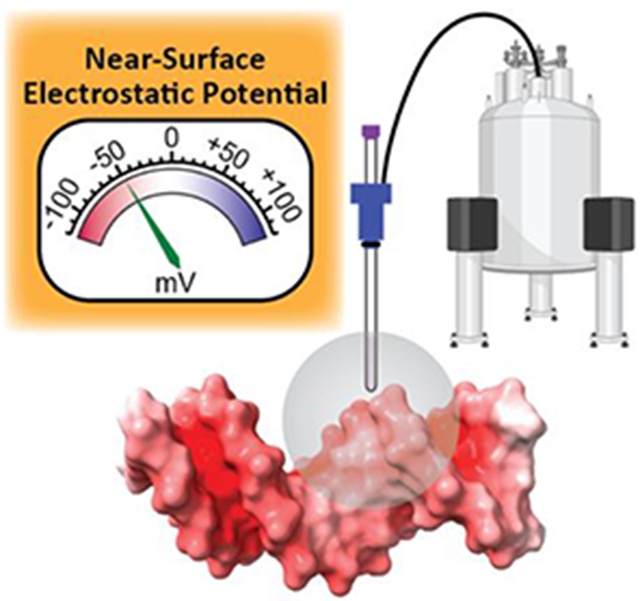
Graphical Abstract

Electrostatic potentials around a biological macromolecule depend not only on the macromolecular charges, but also on mobile ions that are attracted to or repelled by the macromolecules.1 Due to the strong negative charge on their molecular surface, DNA and RNA attract many cations as counterions. The spatial distribution of these counterions around the nucleic acids has been studied for five decades. According to Manning’s theory on counterion condensation,2 counterions around B-form DNA are condensed to a concentration of 1.2 M in the space within the Bjerrum length (7.1 Å in water) from DNA phosphates.3 The Poisson-Boltzmann theory predicts a broader and smoother distribution of counterions around DNA.4-5 Molecular dynamics simulations, as well as reference interaction site model (RISM) integral equation theory, suggest a more rugged distribution of counterions.6-12 In the 21st century, ion-counting and diffusion methods have provided quantitative experimental data at a macroscopic level about counterions around DNA and RNA.13-15 However, these experimental methods do not provide electrostatic potentials. The validity of theoretical electrostatic potentials around nucleic acids remains to be examined through experiments.
In this paper, we demonstrate that paramagnetic NMR allows for determination of local electrostatic potentials around nucleic acids. We recently developed an NMR method to determine local electrostatic potentials around proteins without any use of structural information.16 This method utilizes paramagnetic relaxation enhancement (PRE) arising from two analogous cosolute molecules with opposite charges. We modified this paramagnet NMR method so that it can be applied to highly negatively charged systems. The method allows us to examine theoretical electrostatic models for nucleic acids.
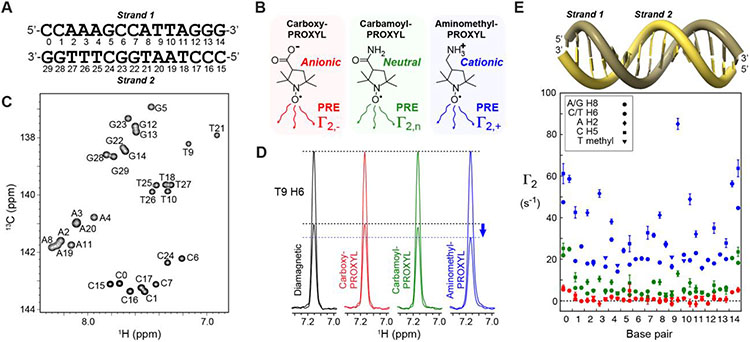
We investigated local electrostatic potentials around the 15-bp DNA duplex shown in Figure 1A. This DNA was 13C/15N-labeled and prepared as previously described.17 Using the PROXYL-derivatives shown in Figure 1B as a paramagnetic cosolute at 20 mM, we measured the 1H transverse PRE rates Γ2 for 1H nuclei of CH/CH2/CH3 groups of DNA. 13C heteronuclear single-quantum coherence(HSQC)-based pulse sequences with homonuclear 13C decoupling to eliminate 1JCC splitting were used to measure PRE for many carbon-attached 1H nuclei (Fig. S1 in the Supporting Information [SI]). Figure 1C shows an example of the recorded 1H-13C correlation spectra (see also Fig. S2 in SI). Although some of our earlier studies on proteins utilized 1H PRE data for NH groups,16,19 we decided to use PRE data for CH/CH2/CH3 groups in the current study on DNA because rapid hydrogen exchange of DNA NH/NH2 groups may adversely impact measurements of PRE rates. Cosolutes may catalyze hydrogen exchange,20 which can introduce significant errors in Γ2 rates due to different hydrogen exchange rates for the paramagnetic and diamagnetic samples. This concern is irrelevant to PRE for nonlabile 1H nuclei of CH/CH2/CH3 groups.
Figure 1.
Paramagnetic NMR data to analyze local electrostatic potentials around DNA. (A) 15-bp DNA duplex used in the current study. The residue numbering is according to Wang et al.17 (B) Paramagnetic cosolute molecules used in the current study. (C) C6/C8 region of 2D 1H-13C HSQC spectrum recorded for the diamagnetic sample of the DNA duplex. Spectra for other moieties are shown in Fig. S2 in the SI. (D) Examples of signal intensity modulation used to measure 1H PRE rates Γ2 using two time-point approach18. The 1H slices of the signals from T9 H6 in the two 2-D sub-spectra for each sample are overlaid and normalized to the intensity at the shorter time point. Due to larger PRE, the intensity at the second time point for the paramagnetic sample with aminomethyl-PROXYL is clearly smaller than those of the other samples. (E) PRE rates Γ2,+ (blue), Γ2,n (green), and Γ2,− (red) measured for DNA base 1H nuclei. For each base pair position, the data for strands 1 (left) and 2 (right) are plotted. The concentration of each PROXYL derivative was 20 mM.
PRE Γ2 data for DNA base 1H nuclei are shown in Figure 1D-E. Corresponding PRE data for DNA sugar 1H nuclei are shown in Fig. S3 in the SI. As proposed in our previous studies on proteins,16,19,21 we initially used positively charged aminomethyl-PROXYL and negatively charged carboxy-PROXYL as paramagnetic cosolutes. Interestingly, the PRE rates were virtually zero for most 1H nuclei of DNA when carboxy-PROXYL was used. This suggests that the negatively charged cosolutes are excluded from the space proximal to DNA, presumably due to strong electrostatic repulsion. By contrast, when positively charged aminomethyl-PROXYL was used, the PRE rates for all 1H nuclei were remarkably larger than 10 s−1, reflecting electrostatic attraction of the positively charged cosolute to the negatively charged DNA surface.
Since the magnitude of PRE arising from carboxy-PROXYL was too small for quantitative analysis of electrostatic potentials, we also measured PRE arising from a neutral analogue, carbamoyl-PROXYL (see Figure 1B). The observed PRE arising from carbamoyl-PROXYL was larger than those for carboxyl-PROXYL, but smaller than those for aminomethyl-PROXYL (Figure 1E). This relative magnitude likely reflects the absence of electrostatic repulsion or attraction for the neutral cosolute. Using these data sets we determined effective near-surface electrostatic potentials ϕENS for individual 1H nuclei of the 15-bp DNA. The following equation was used to determine ϕENS potential:16
| (1) |
where, e is the elementary electric charge; z is a charge valence of a PROXYL derivative; kB is the Boltzmann constant; T is temperature; and annotations a and b are for two different PROXYL derivatives. At neutral pH, z = +1 for aminomethyl-PROXYL; z = 0 for carbamoyl-PROXYL; and z = −1 for carboxy-PROXYL. In our current case, a and b are aminomethyl-PROXYL and carbamoyl-PROXYL, respectively.
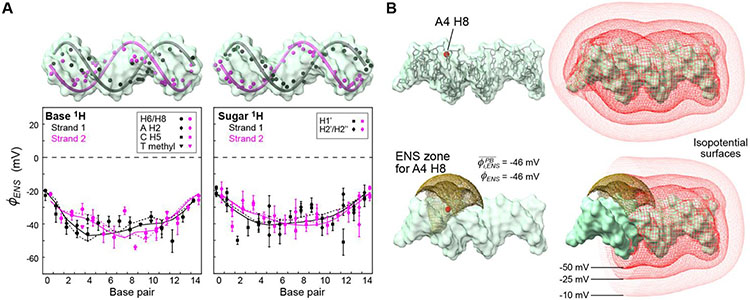
Using the data of PRE arising from aminomethyl-PROXYL and carbamoyl-PROXYL, we determined the effective near-surface electrostatic potentials ϕENS for 1H nuclei at 112 sites of the 15-bp DNA duplex (Figure 2A). The ϕENS potentials were determined only for 1H nuclei that exhibited statistically significant PRE rates and Γ2,+ /Γ2,− ratios, using the criteria described in the SI. The electrostatic potentials ranged from −54 mV to −18 mV. Compared with the previous data for proteins,16,19,21 our current data for DNA reveal a relatively smooth landscape of near-surface electrostatic potentials. This seems reasonable because proteins contain both positive and negative charges, whereas DNA contains virtually no positive charges. Only protonated bases in a very minor state are positively charged in DNA.22-23 1H nuclei near the two ends of DNA exhibited smaller magnitudes of ϕENS potentials. This corresponds to the so-called “Coulombic end effects”.24-25 Our experimental data confirm that the local electrostatic potentials near the DNA ends are weaker.
Figure 2.
Effective near-surface electrostatic potentials ϕENS determined from the 1H PRE Γ2 rates measured with aminomethyl-PROXYL or carbamoyl-PROXYL as a paramagnetic cosolute. (A) ϕENS potentials measured for base and deoxyribose 1H atoms. Solid and dashed lines represent Poisson-Boltzmann equation-based predictions from the B-form structure and a structural model based on PDB 9ANT, respectively, for H6/H8 (left) and H1’ (right) atoms only. (B) ENS zone for the A4 H8 atom as an example. A ϕENS potential approximates the average of the electrostatic potentials within an ENS zone, which is defined as a zone that makes a 68% contribution to , where ri is the distance between the observed 1H nucleus and a grid point.16 The panel also shows isopotential surfaces for the electrostatic potentials calculated with the APBS software26 In the lower right panel, the isopotential surfaces are clipped at the 2-D plane that contains the A4 H8 atom and is perpendicular to the DNA axis.
The effective near-surface electrostatic potential ϕENS can be predicted from structure. As previously explained,16 a physical meaning of ϕENS is that it approximates the average of the electrostatic potentials in a near-surface zone proximal to the observed 1H nucleus. Due to the strong distance dependence imposed by r−6, each PRE Γ2 rate is dominated by the paramagnetic cosolute molecules diffusing in this zone. When electrostatic potentials in 3-D lattice grid space around a macromolecule are used, the ϕENS potential agrees well with the average of electrostatic potentials in a zone within a distance that makes a 68% contribution to , where ri is a distance between an accessible grid point i and the observed 1H nucleus.16 We refer to this zone as the effective near-surface (ENS) zone. Using the Adaptive Poisson-Boltzmann Solver (APBS) software26 along with structural models of DNA, we computed electrostatic potentials , from which the average potential within the ENS zone was calculated for each 1H nucleus. Each ENS zone covers a large volume of accessible space with a radius of ~8-20 Å. Figure 2B shows the effective near-surface (ENS) zone for the A4 H8 atoms as an example together with isopotential surfaces of the electrostatic potentials computed with the Poisson-Boltzmann equation.
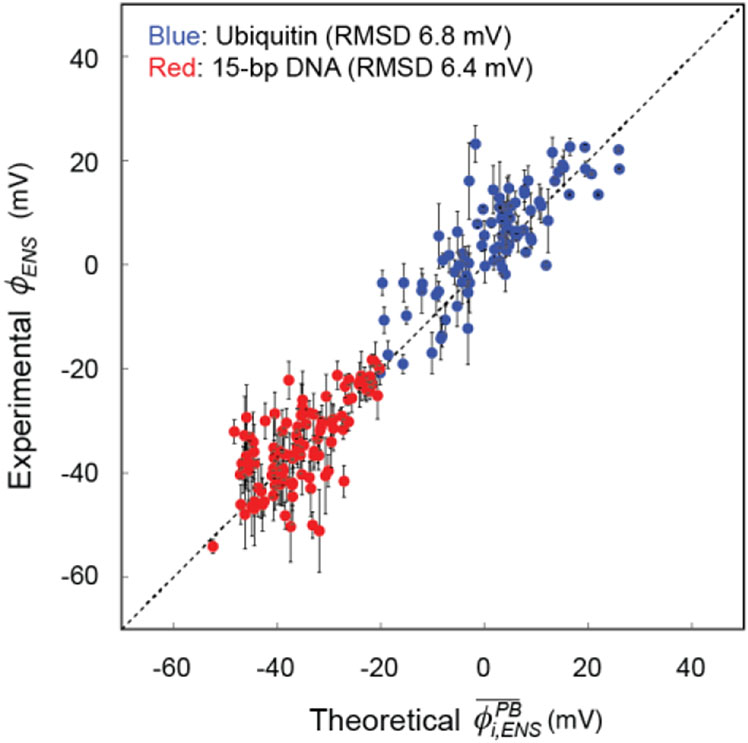
The experimental ϕENS data were generally in good agreement with the Poisson-Boltzmann theory-based predictions . The overall root-mean squared difference (RMSD) between the experimental and predicted values was 6.4 mV for an ideal B-form DNA structure (6.7 mV for a structure model based on PDB 9ANT). Some 1H nuclei (e.g., A2 H1’ and G12 H1’/H8) exhibited relatively large discrepancy between the experimental and predicted values, which may reflect limitations of ϕENS prediction using a spherical model for the PROXYL derivatives.19 Figure 3 shows a correlation plot for the experimental data and the theoretical predictions. For the sake of comparison, this figure also shows the corresponding data for the ϕENS potentials for 13C-attached 1H nuclei of ubiquitin reported in our previous study21. We should point out that because of different zb − za in Eq. 1, uncertainties in experimental ϕENS potentials increase two-fold when carbamoyl-PROXYL (z = 0) is used instead of carboxy-PROXYL (z = −1). Nonetheless, in terms of RMSD, the agreement between the experimental and theoretical data for the 15-bp DNA was as good as that for ubiquitin. These data validate predictions by the Poisson-Boltzmann theory, even for such a highly charged system as DNA, which attracts many counterions.
Figure 3.
Correlation between the experimental ϕENS and predicted potentials for 13C-attached 1H atoms. The data for ubiquitin was taken from Yu et al.21 The potentials for the 15-bp DNA were predicted using a B-form structure. Corresponding data with the predictions using a model based on PDB 9ANT are shown in Fig. S4 in the SI.
Prior to the current work, experimental assessment of electrostatic potentials for nucleic acids has been difficult. An electron-electron double-resonance (ELDOR) study using 9-tempaminoacridine spin label intercalated into DNA suggested that the magnitude of electrostatic potential around DNA was significantly smaller than the prediction from the Poisson-Boltzmann theory.27 However, the intercalation of the paramagnetic probe used in the ELDOR method can distort DNA. The ELDOR data are also limited to the probe whose location is not well defined. These weaknesses make it difficult to judge whether the discrepancy reflects the limitations of the ELDOR experiment or those of the theoretical model. The paramagnetic NMR method is clearly more powerful for examination of electrostatic models because it can provide electrostatic potentials around native DNA for numerous 1H nuclei without any chemical modification.
It should be noted that the paramagnetic NMR method is directly applicable to investigate electrostatic potentials around RNA. Structural dynamics are often important for RNA functions.28-29 Due to the requirement of precise measurements of PRE rates for multiple paramagnetic cosolutes, applications of this method to large (e.g., >40 kDa) nucleic acid molecules may be challenging. Nonetheless, the paramagnetic NMR method can in principle provide local electrostatic potentials even for highly flexible macromolecules such as single-stranded RNA and intrinsically disordered proteins. This aspect is important because the electrostatic properties of structurally disordered macromolecules are difficult to computationally assess with the Poisson-Boltzmann theory.
In conclusion, we have developed a paramagnetic NMR-based method to measure local electrostatic potentials around nucleic acids without any use of structural information. This method allows for unprecedented experimental investigations into the electrostatic properties of nucleic acids. Experimental data of near-surface electrostatic potentials will be useful not only for validation of theoretical electrostatic models, but also for a better understanding of the role of electrostatic interactions in the function of nucleic acids.
Experimental Methods
The NMR samples of the 13C/15N-labeled DNA duplex was prepared as previously described. All NMR experiments were conducted at 25°C using a Bruker Avance III NMR spectrometer operated at the 1H frequency of 600 MHz. A cryogenic 1H/13C/15N/31P QCI probe was used for NMR detection. Experimental and computational details are described in the SI.
Supplementary Material
ACKNOWLEDGMENT
This work was supported by Grant R35-130326 from the National Institutes of Health (to J.I.) and Grant H-2104-20220331 from the Welch Foundation (to J.I.). We thank Karina Bien for language editing and Drs. Montgomery Pettitt and Chuanying Chen for useful discussions. Structures were drawn with ChimeraX.30
Footnotes
Supporting Information. The following file is available free of charge.
Materials and methods; the pulse sequences for measurements of 1H PRE Γ2 rates; 1H-13C correlation spectra for adenine C2/H2, cytosine C5/H5, thymine CH3, and deoxyribose C1’/H1’ and C2’/H2’/H2’’ regions. PRE Γ2 rates measured for DNA deoxyribose 1H nuclei of the DNA duplex; and correlation between the experimental ϕENS potentials and theoretical predications from a PDB 9ANT-based structure model (PDF).
The authors declare no competing financial interests.
REFERENCES
- 1.Chazalviel JN, Coulomb Screening by Mobile Charges: Application to Materials Science, Chemistry, and Biology. Springer: New York, 1999. [Google Scholar]
- 2.Manning GS, Limiting Laws and Counterion Condensation in Polyelectrolyte Solutions .I. Colligative Properties. J Chem Phys 1969, 51, 924–933. [Google Scholar]
- 3.Manning GS, Molecular Theory of Polyelectrolyte Solutions with Applications to Electrostatic Properties of Polynucleotides. Q Rev Biophys 1978, 11, 179–246. [DOI] [PubMed] [Google Scholar]
- 4.Le Bret M; Zimm BH, Distribution of Counterions around a Cylindrical Polyelectrolyte and Manning's Condensation Theory. Biopolymers 1984, 23, 287–312. [DOI] [PubMed] [Google Scholar]
- 5.Stigter D, Evaluation of the Counterion Condensation Theory of Polyelectrolytes. Biophys J 1995, 69, 380–388. [DOI] [PMC free article] [PubMed] [Google Scholar]
- 6.He W; Chen YL; Pollack L; Kirmizialtin S, The Structural Plasticity of Nucleic Acid Duplexes Revealed by WAXS and MD. Sci Adv 2021, 7, eabf6106. [DOI] [PMC free article] [PubMed] [Google Scholar]
- 7.Kolesnikov ES; Gushchin IY; Zhilyaev PA; Onufriev AV, Similarities and Differences between Na+ and K+ Distributions around DNA Obtained with Three Popular Water Models. J Chem Theory Comput 2021, 17, 7246–7259. [DOI] [PMC free article] [PubMed] [Google Scholar]
- 8.Savelyev A; MacKerell AD Jr., Competition among Li+, Na+, K+, and Rb+ Monovalent Ions for DNA in Molecular Dynamics Simulations Using the Additive CHARMM36 and DRUDE Polarizable Force Fields. J Phys Chem B 2015, 119, 4428–4440. [DOI] [PMC free article] [PubMed] [Google Scholar]
- 9.Giambasu GM; Gebala MK; Panteva MT; Luchko T; Case DA; York DM, Competitive Interaction of Monovalent Cations with DNA from 3D-RISM. Nucleic Acids Res 2015, 43, 8405–8415. [DOI] [PMC free article] [PubMed] [Google Scholar]
- 10.Howard JJ; Lynch GC; Pettitt BM, Ion and Solvent Density Distributions around Canonical B-DNA from Integral Equations. J Phys Chem B 2011, 115, 547–556. [DOI] [PMC free article] [PubMed] [Google Scholar]
- 11.Cheng Y; Korolev N; Nordenskiöld L, Similarities and Differences in Interaction of K+ and Na+ with Condensed Ordered DNA. A Molecular Dynamics Computer Simulation Study. Nucleic Acids Res 2006, 34, 686–696. [DOI] [PMC free article] [PubMed] [Google Scholar]
- 12.Savelyev A; Papoian GA, Electrostatic, Steric, and Hydration Interactions Favor Na+ Condensation around DNA Compared with K+. J Am Chem Soc 2006, 128, 14506–14518. [DOI] [PubMed] [Google Scholar]
- 13.Jacobson DR; Saleh OA, Counting the Ions Surrounding Nucleic Acids. Nucleic Acids Res 2017, 45, 1596–1605. [DOI] [PMC free article] [PubMed] [Google Scholar]
- 14.Yu B; Iwahara J, Experimental Approaches for Investigating Ion Atmospheres around Nucleic Acids and Proteins. Comput Struct Biotechnol J 2021, 19, 2279–2285. [DOI] [PMC free article] [PubMed] [Google Scholar]
- 15.Lipfert J; Doniach S; Das R; Herschlag D, Understanding Nucleic Acid-Ion Interactions. Annu Rev Biochem 2014, 83, 813–841. [DOI] [PMC free article] [PubMed] [Google Scholar]
- 16.Yu B; Pletka CC; Pettitt BM; Iwahara J, De Novo Determination of near-Surface Electrostatic Potentials by NMR. Proc Natl Acad Sci U S A 2021, 118, e2104020118. [DOI] [PMC free article] [PubMed] [Google Scholar]
- 17.Wang X; Yu B; Iwahara J, Slow Rotational Dynamics of Cytosine NH2 Groups in Double-Stranded DNA. Biochemistry 2022, 61, 1415–1418. [DOI] [PMC free article] [PubMed] [Google Scholar]
- 18.Iwahara J; Tang C; Clore GM, Practical Aspects of 1h Transverse Paramagnetic Relaxation Enhancement Measurements on Macromolecules. J Magn Reson 2007, 184, 185–195. [DOI] [PMC free article] [PubMed] [Google Scholar]
- 19.Chen C; Yu B; Yousefi R; Iwahara J; Pettitt BM, Assessment of the Components of the Electrostatic Potential of Proteins in Solution: Comparing Experiment and Theory. J Phys Chem B 2022, 126, 4543–4554. [DOI] [PMC free article] [PubMed] [Google Scholar]
- 20.Liepinsh E; Otting G, Proton Exchange Rates from Amino Acid Side Chains--Implications for Image Contrast. Magn Reson Med 1996, 35, 30–42. [DOI] [PubMed] [Google Scholar]
- 21.Yu B; Pletka CC; Iwahara J, Protein Electrostatics Investigated through Paramagnetic NMR for Nonpolar Groups. J Phys Chem B 2022, 126, 2196–2202. [DOI] [PMC free article] [PubMed] [Google Scholar]
- 22.Nikolova EN; Goh GB; Brooks CL; Al-Hashimi HM, Characterizing the Protonation State of Cytosine in Transient G·C Hoogsteen Base Pairs in Duplex DNA. J Am Chem Soc 2013, 135, 6766–6769. [DOI] [PMC free article] [PubMed] [Google Scholar]
- 23.Nikolova EN; Kim E; Wise AA; O’Brien PJ; Andricioaei I; Al-Hashimi HM, Transient Hoogsteen Base Pairs in Canonical Duplex DNA. Nature 2011, 470, 498–502. [DOI] [PMC free article] [PubMed] [Google Scholar]
- 24.Allison SA, End Effects in Electrostatic Potentials of Cylinders: Models for DNA Fragments. J Phys Chem 1994, 98, 12091–12096. [Google Scholar]
- 25.Olmsted MC; Anderson CF; Record MT Jr, Importance of Oligoelectrolyte End Effects for the Thermodynamics of Conformational Transitions of Nucleic Acid Oligomers: A Grand Canonical Monte Carlo Analysis. Biopolymers 1991, 31, 1593–1604. [DOI] [PubMed] [Google Scholar]
- 26.Jurrus E; Engel D; Star K; Monson K; Brandi J; Felberg LE; Brookes DH; Wilson L; Chen J; Liles K, et al. , Improvements to the APBS Biomolecular Solvation Software Suite. Protein Sci 2018, 27, 112–128. [DOI] [PMC free article] [PubMed] [Google Scholar]
- 27.Shin YK; Hubbell WL, Determination of Electrostatic Potentials at Biological Interfaces Using Electron-Electron Double Resonance. Biophys J 1992, 61, 1443–1453. [DOI] [PMC free article] [PubMed] [Google Scholar]
- 28.Ganser LR; Kelly ML; Herschlag D; Al-Hashimi HM, The Roles of Structural Dynamics in the Cellular Functions of Rnas. Nat Rev Mol Cell Biol 2019, 20, 474–489. [DOI] [PMC free article] [PubMed] [Google Scholar]
- 29.Zhao B; Zhang Q, Characterizing Excited Conformational States of Rna by NMR Spectroscopy. Curr Opin Struct Biol 2015, 30, 134–146. [DOI] [PMC free article] [PubMed] [Google Scholar]
- 30.Pettersen EF; Goddard TD; Huang CC; Meng EC; Couch GS; Croll TI; Morris JH; Ferrin TE, UCSF Chimerax: Structure Visualization for Researchers, Educators, and Developers. Protein Sci 2021, 30, 70–82. [DOI] [PMC free article] [PubMed] [Google Scholar]
Associated Data
This section collects any data citations, data availability statements, or supplementary materials included in this article.


