

Abstract
Background: Tuberculosis is one of the oldest known diseases in humans, and early detection of tuberculosis is one of the main measures to decrease the spread of tuberculosis. In many parts of the world, including Iran, the diagnosis of tuberculosis is based on the detection of acid-fast bacillus in sputum smear microscopy and PCR. this study aimed to synthesize evidence on the diagnostic accuracy of sputum smear and PCR compared to sputum culture for the diagnosis of PT in Iranian patients.
Methods: This systematic review and meta-analysis was conducted based on PRISMA guideline for systematic review and meta-analysis. Eligible studies were cross-sectional original diagnostic studies published in English and Persian in Iran which examined the sensitivity or specificity(study outcome) of sputum smear microscopy or PCR( as the test) relative to sputum culture (as the gold standard/comparator) among Iranian patients suspected of having tuberculosis( study population). Studies whose data were not complete or extractable were excluded.
Results: A total of 3518 subjects were evaluated from 15 eligible studies. The pooled sensitivity of sputum smear and PCR was 75.12 (95% CI: 66.68-83.56) and 88.02 (95% CI: 82.87-93.27), respectively. The specificity for sputum smear and PCR was 93.94 (95% CI: 91.26-96.63) and 91.82 (95% CI: 87.29-96.35) respectively. The sensitivity of both sputum smears was higher in studies published after 2010, and had higher quality. The specificity of sputum smear was a bit lower in studies published after2010 but higher in studies with higher quality. The specificity of PCR was higher in studies published after 2010 but higher in studies with higher quality.
Conclusion:The increased sensitivity of sputum smear and PCR during recent years suggests the improvement of preparation and laboratory methods in recent years. However, the imperfect sensitivity of these tests highlights the need for a more accurate diagnostic method for the detection of pulmonary tuberculosis in Iran.
Keywords: Mycobacterium tuberculosis, Polymerase Chain Reaction, Sputum Smear, Sputum Culture, Meta-Analysis, Iran
Introduction
↑What is “already known” in this topic:
In Iran, various studies were performed to estimate the diagnostic value of tuberculosis test compared to sputum culture, but a meta-analysis that can reach general results to see what the diagnostic value of tuberculosis is in total has not been performed, so we decided to conduct a systematic review AND meta-analysis study.
→What this article adds:
The general results of the diagnostic value of tuberculosis tests compared to sputum culture in Iran were determined.
Tuberculosis is one of the oldest known diseases in humans and is still one of the leading causes of death worldwide; and if left untreated can lead to the death of 50 to 65% of patients within five years(1). In 2011, more than 8.7 million new cases and 1.4 million deaths from tuberculosis were reported to the World Health Organization, more than 90% of which were in developing countries. However, it is estimated that the reported cases account for only about 60% of cases(2). The World Health Organization's Global Tuberculosis Report 2014 shows that 9 million people developed TB in 2013, and 1.5 million died, including 360 000 people who were HIV positive(3). The disease is a major cause of morbidity and mortality in developing countries(2). In Iran, the incidence and prevalence of tuberculosis are not the same in all parts of the country; according to the latest statistics in 2020, the provinces of Sistan and Baluchestan and Golestan had the highest incidence and prevalence in the country(4,5). According to the reports by the World Health Organization, the incidence of tuberculosis in Iran was 11 cases per 100,000 population in 2020, indicating a decreasing trend compared to the past(6,7). On the other hand, recent reports indicate a decrease in diagnosis and follow-up in patients within the past two years due to the effect of the COVID-19 epidemic on patient care and referral(8).
Early detection of tuberculosis is one of the main measures in reducing the spread of tuberculosis and is an important step in the global disease control program(9); the transmission of smear-positive pulmonary tuberculosis from patients to healthy people continues until appropriate treatment is applied(10). In many parts of the world, including Iran, the diagnosis of tuberculosis is based on the finding of acid-fast bacillus in microscopic examination of two or three sputum smear samples or tissue samples. Although this method is fast and cheap, it has a low sensitivity (40 to 60%) and requires 102-104 bacilli per millimeter of the sample. With the second test, the sensitivity increases by only 9% and with the third test, only by 4%(11). Moreover, sputum smear microscopy cannot differentiate between mycobacterium tuberculosis and other non-tuberculosis mycobacteria. With all these restrictions in many developing countries, the World Health Organization recommends sputum smear microscopy with acid-fast stain in symptomatic patients suspected of pulmonary tuberculosis in three turns (the first turn: on the day of referral, the second turn: on the next morning, and the third turn: in the morning of the second day after referral)(12,13). Despite the widespread use of this test in many parts of the world, including Iran, problems such as the need for equipment and trained personnel can lead to changes in the sensitivity of this test in different parts(14).
On the other hand, the culture method, which is considered the preferred method in many conditions, requires a long time for the growth of bacteria(3-6 weeks) due to the slow growth of the organism(15-17). Molecular detection based on nucleic acid amplification techniques, known as a polymerase chain reaction, has been proposed in recent years. The main purpose of this method is to determine a specific DNA fragment in different organisms identified by polymerase chain reaction (PCR). This method is able to detect a very small number of microorganisms less than 10, which is used in many parts of the world today due to its simplicity, speed and higher accuracy relative to the smear method(18-20).
Various studies have investigated the sensitivity of sputum smear microscopy and PCR relative to sputum culture in Iran, which have led to different results(21,22-35). A variety of factors including the quality of smear and quality of smear processing can affect the accuracy of the test. Patients' errors, taking smear at inappropriate times and situation, as well as staff errors, can affect the test accuracy and explains the difference that exists in the accuracy of the test in various settings. For policymakers, it is of high importance to know the overall accuracy of the test. This provides them a realistic view regarding the rate of under-diagnosis in different settings. Therefore, in the present study, we aimed to synthesize evidence on the diagnostic accuracy of sputum smear and PCR tests compared to sputum culture as the reference standard for the diagnosis of tuberculosis in Iranian patients.
Methods
This review article was conducted based on the PRISMA guideline for systematic review and meta-analysis(36). Stages of the study included search strategy, study selection, qualitative evaluation of studies, and data extraction. All steps were independently performed by two researchers. In cases of disagreement, the issue was resolved by a third researcher.
Inclusion and exclusion criteria
Eligible studies were cross-sectional diagnostic studies published in English and Persian in Iran which examined the sensitivity or specificity(study outcome) of sputum smear microscopy or PCR( as the test) relative to sputum culture (as the gold standard/comparator) among Iranian patients suspected of having tuberculosis( study population). Exclusion criteria were: 1) Letters to the editor without original data, review articles, and case reports, and 2) Studies whose data were not complete or extractable.
Information sources and search strategy
The search was done up to march 2022 in both English and Persian language databases.English databases included Scopus, PubMed, Science Direct, Web of Science, Cochrane and Google scholar search and Persian language databases were Magiran, Iranmedx and SID. Using database-specific strings different combinations of the following keywords were used:( diagnostic value, diagnostic accuracy, sensitivitythe, specificity, mycobacterium tuberculosis,pulmonary tuberculosis, tuberculosis, sputum, smear, sputum smear, microscopy smear, smear microscopy, Polymerase Chain Reaction, PCR, Iran. Their Persian translations were used for searching Persian databases. A manual search was also performed using the reference list of studies in the above databases. The search strategy for the PubMed database is provided in Appendix 1.
Data extraction
Data were extracted by two researchers (SH. Rahmati and A. Shahesmaeili ) independently. To reduce the errors in data collection, data extraction was done using a piloted data extraction form which included the following variables: author's name, year of publication, place of study, type of study, sample size, mean age, gender, sensitivity, specificity, positive predictive value and negative predictive value of sputum smear and PCR of sputum samples relative to sputum culture. Any ambiguity in data was addressed through discussion among authors.
Definition of variables
Sensitivity: Sensitivity indicates the strength of the test in the correct diagnosis of patients. In other words, the proportion of patients whose test results are positive.
Specificity: Specificity is the ability of the test in the correct diagnosis of healthy individuals as healthy, in other words, the proportion of healthy people whose test results are negative.
Positive predictive value: Positive predictive value indicates the probability of having the disease in people whose test result is positive. In other words, it shows the ratio of real patients to all people with the positive test result.
Negative predictive value: Negative predictive value indicates the probability of being healthy in people whose test results were negative; this index shows the ratio of real healthy people to the total number of people with the negative test result.
Culture test: In this method, sputum samples taken from patients with suspected pulmonary tuberculosis are tested in a suitable culture medium.
Direct sputum smear microscopy: In this test, the sputum sample is examined under a microscope after staining with Ziehl–Neelsen stain (acid-fast) or auramine–rhodamine stain (fluorescent).
PCR: In this method, the presence or absence of Mycobacterium tuberculosis DNA in sputum samples is examined.
Evaluating the quality of studies
The Standards for Reporting of Diagnostic Accuracy (STARD) checklist(37)was used to evaluate the quality of the studies. This checklist consists of 30 parts, and there is one question in each part, except for parts 10, 12, 13 and 21, in each part of which there are two questions. Each of these questions was assigned a score, based on which the maximum attainable score could be 34. Articles were divided into two subgroups greater than 17 and less than or equal to 17 based on their quality score.
Statistical analysis
Pooled indices were estimated by Stata version 16 and using the metan command. Heterogeneity among studies was determined using the Cochran test and I2 index(38). Meta-regression was performed to investigate the relationship between variables and effect size and to investigate the possible causes of heterogeneity among studies. Variables of sample size (less than or equal to and greater than 200), length of study (less than or equal to and greater than one year), year of publication (2010 or before that and 2010 onwards), quality of the article (score less than 17 and greater than or equal to 17) and the technique for staining the sputum smears (Ziehl–Neelsen or auramine–rhodamine) were included in the meta-regression model as possible influential variables. A P-value less than 0.05 was considered significant.
Results
Overview of Search in studies with sputum smear microscopy and PCR
In the primary search, 885 studies on the diagnostic value of sputum smear microscopy and PCR in Iran were obtained. After reviewing the title and abstract, 85 studies were identified as relevant, and after reviewing the full text, 69 studies were omitted due to lack of necessary criteria and 16 studies were finally entered into qualitative synthesis, and among them, 15 eligible studies (13 studies examined sputum smear and 9 studies examined PCR) entered to the meta-analysis(Fig. 1 and Table 1). The total number of samples included in this study was 3518. The mean age of patients was 49.32 ± 19.8 years and 52.8% of patients were men and 48.2% were women. In most studies, Ziehl–Neelsen staining method was used to stain sputum samples. The quality evaluation score of the studies ranged from 11 to 20. In 47% of the studies, the quality score was greater than or equal to 17(Table 1). The sample size of the studies ranged from 30 to 920. Five studies evaluated the diagnostic value of sputum smear microscopy alone. Two studies only evaluated PCR and eight studies evaluated both methods. Of all studies, five studies were published in 2010 or before that and eight studies were published after 2010. Table 2 shows the characteristics of each article.
Fig. 1.
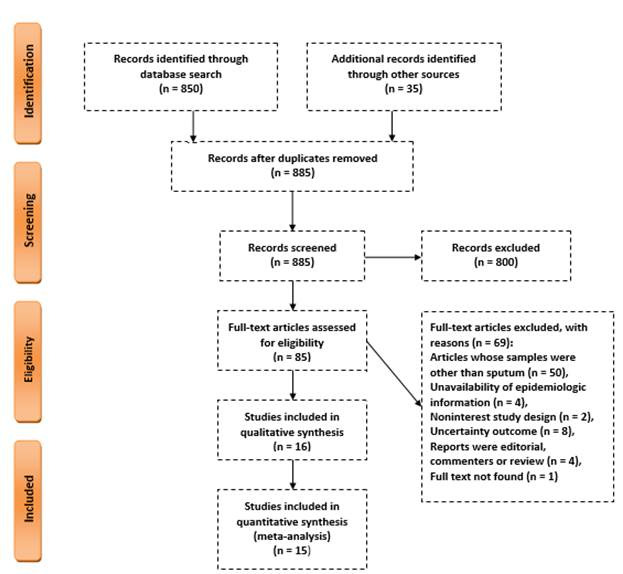
A flowchart of the literature searches for the systematic review and meta analysis of studies
Table 1. Demographic and clinical characteristics of patients with Tuberculosis included in the systematic review and meta-analysis of diagnostic accuracy of sputum smear microscopy and polymerase chain reaction in detection of smear positive pulmonary Tuberculosis .
| Variable | Frequency (%) | |
| Sex (n=698) | Female Male |
330 (47.2) 368 (52.8) |
| Staining type (n=4364) | Ziehl–Neelsen auramine-rhodamine |
3249 (74.5) 1115 (25.5) |
| Quality of the included papers | <17score ≥17score |
9 (60) 6 (40) |
| The recruited sample size | <200 ≥200 |
9(60) 6 (40) |
Table 2. Summary of the included studies in systematic review and meta-analysis of diagnostic accuracy of sputum smear microscopy and polymerase chain reaction in detection of smear positive pulmonary Tuberculosis .
| Author, publication years/reference | N | City | Staining type | Gender(N) | Age | Sputum smears vs. culture (%) |
PCR test vs. culture (%) | Quality score | ||||||||
| Female | Male | Mean | SD | Sensitivity | Specifity | PPV* | NPV** | Sensitivity | Specifity | PPV* | NPV** | |||||
| Rivandi S, 1997 (35) | 100 100 | Tehran | - | - | - | - | - | - | - | - | - | 100 | 91.6 | - | - | 15 |
| Farnia p, 2002, (33) | 430 | Tehran | Ziehl–Neelsen |
- | - | - | - | 46 | 90 | 87 | - | - | - | - | - | 16 |
| Naderi M, 2004, (21) | 169 | Zahedan | - | - | - | - | - | - | - | - | - | 91.86 | 96.87 | 97.5 | 89.85 | 16 |
| Shirani D, 2006, (28) | 100 | Esfahan | Ziehl–Neelsen |
- | - | - | - | 82 | - | - | - | 96 | - | - | - | 18 |
| Aminzadeh Z, 2008, (27) | 100 | Tehran | Ziehl–Neelsen |
52 | 48 | 52.9 | 21.83 | 82.5 | 77 | 70 | 86 | - | - | - | - | 11 |
| Ziaee M, 2008, (26) | 920 | Birjand |
Ziehl–Neelsen/ |
- | - | - | - | 51 |
100 |
100 |
94 | - | - | - | - | 15 |
| Auramine-rhodamine | 57 | 100 | 100 | 95 | ||||||||||||
| Khorshidi A, 2009, (29) | 248 | Kashan | Ziehl–Neelsen |
- | - | - | - | 100 | 96.2 | 80 | 100 | 93.8 | 99.1 | 93.8 | 99.1 | 19 |
| Ekrami A, 2011, (30) | 152 | Ahvaz | Ziehl–Neelsen |
- | - | - | - | 86 | 84.9 | - | - | 82.6 | 73.5 | - | - | 20 |
| Mousavi S.A, 2013, (23) | 47 | Tehran | Ziehl–Neelsen |
21 | 26 | 53.84 | 18.6 | 83 | 100 | 100 | 98 | 50 | 100 | 100 | 93 | 16 |
| Farivarn T.N, 2014, (31) | 200 | Zahedan | Ziehl–Neelsen |
130 | 70 | 37.8 | - | 41.6 | - | - | - | 100 | - | - | - | 18 |
| Gholoobi A, 2014, (24) | 30 | Mashhad | Ziehl–Neelsen |
- | - | - | - | 75 | 83.3 | 75 | 83.3 | 58.33 | 77.78 | 100 | 78.26 | 16 |
| Naeini R A, 2016, (25) | 195 | Zahedan | Ziehl–Neelsen/ |
- | - | - | - | 71.7 |
90.35 |
82.5 |
83.35 |
- | - | - | - | 16 |
| Auramine-rhodamine | 73.65 | 86.45 | 81.8 | 84.2 | ||||||||||||
| Nour-Neamatollahi A, 2018, (32) | 476 | Tehran | Ziehl–Neelsen |
- | - | - | - | 86.1 | 99.4 | 98.5 | 93.9 | 100 | 91.3 | 83.4 | 100 | 23 |
| Kazerani M, 2019, (22) |
58 | Mashhad | Ziehl–Neelsen |
29 | 29 | 56.7 | 19.8 | 100 | 93.9 | 92.6 | 100 | 88 | 93.9 | 91.7 | 91.2 | 18 |
| Mansoori N, 2020, (34) | 293 | Gorgan | Ziehl–Neelsen |
98 | 195 | 45.4 | 19.3 | 84.8 | 97.5 | 92.8 | 93.3 | - | - | - | - | 15 |
PPV*= Positive predictive value, NPV**= Negative predictive value, N=sample size
Diagnostic value of sputum smear microscopy relative to sputum culture
The pooled sensitivity and specificity of sputum smear microscopy relative to culture were 75.12% (95% CI: 66.68%-83.56%); (I2=97.3%, p<0.001) and 93.94% (95% CI: 91.26%-96.63%); (I2=85.6%, p<0.001) respectively. In terms of staining method, sensitivity and specificity in the studies that used Ziehl–Neelsen method were 76.74% (95% CI 68.42% -85.06%) and 93.42% (95% CI: 90.29%-96.54%) respectively, and in studies that used the auramine–rhodamine method were 65.07% (95% CI: 48.77%-81.38%) and 95.20% (95% CI: 84.90%-105.49%) respectively. Other measures of tests accuracy including positive and predictive values are presented in Figure 2.
Fig. 2.

Diagnostic value of sputum smear test relative to sputum culture
A: Sensitivity of sputum smear test to sputum culture by staining, B: Features of sputum smear test to sputum culture by staining, C: Positive predictive value of sputum smear test to sputum culture by staining, D: Value Negative news of sputum smear test compared to sputum culture by staining separately
Diagnostic value of PCR relative to sputum culture
Pooled sensitivity and specificity of PCR relative to sputum culture were 88.02% (95% CI: 82.87%-93.27%) (I2=95.2%, p<0.001) and 91.82% (95% CI: 87.29%-96.35%)(I2=99.2%, p<0.001), respectively (Fig. 3).
Fig. 3.

Diagnostic value of PCR compared to sputum culture
A: PCR sensitivity to sputum culture, B: PCR specificity to sputum culture, C: Positive predictive value of PCR to sputum culture, D: Negative predictive value of PCR to sputum culture
Diagnostic value of sputum smear microscopy relative to sputum culture by year of publication
Pooled sensitivity of sputum smear microscopy in studies whose year of publication was 2010 or before that and after 2010 was equal to 70.12% (95% CI: 50.03%-90%) and 78.27% (95% CI: 66.89%-89.65%), respectively. The pooled specificity of sputum smear microscopy was 94.37 (95% CI: 89.73%-99%) and 93.37% (95% CI: 89.67%-97.06%), respectively.
Diagnostic value of PCR test relative to sputum culture by year of publicati on
PCR pooled sensitivity in studies whose year of publication was 2010 or before that and after 2010 was equal to 95.14% (95% CI: 92.02%-98.26%) and 81.22% (95% CI: 71.60%-90.83%), respectively. The pooled specificity was 99% (95% CI: 96.50%-101.50%) and 88.01% (95% CI: 79.07%-96.96%), respectively. Other measures of test accuracy, including positive and predictive values, are presented in Table 3.
Table 3. Meta-regression analysis of the effect of various variables on diagnostic accuracy of sputum smear microscopy and polymerase chain reaction in detection of smear positive pulmonary Tuberculosis .
| Variable | Multivariable meta-regression | ||
| Sensitivity of sputum smear test vs culture (%) | Coefficient | P-value | [95% conf. Interval] |
| The recruited sample size (sample size < 200 vs. sample size ≥ 200) | -8.08 | 0.379 | (-27.95-11.78) |
| Publication years(10 ≤ years vs. 10> years) | -1.90 | 0.799 | (-18.92-15.11) |
| Type of sputum staining( Ziehl–Neelsen vs. Auramine-rhodamine) | 2.8 | 0.801 | (-23.78-29.51) |
| Quality of the included papers (quality ≥17vs quality < 17) | 18.48 | 0.029 | (2.27-34.68) |
| Specificity of sputum smear test vs culture (%) | Coefficient | P-value | [95% conf. Interval] |
| The recruited sample size (sample size< 200 vs. sample size ≥ 200) | 13.21 | 0.043 | (0.64-25.78) |
| Publication years(10 ≤ years vs. 10> years) | 7.04 | 0.200 | (-4.95-19.03) |
| Type of sputum staining( Ziehl–Neelsen vs. Auramine-rhodamine) | 1.87 | 0.721 | (-10.16-13.91) |
| Quality of the included papers (quality ≥17vs quality < 17 | -2.59 | 0.592 | (-13.62-8.4) |
| Positive predictive value of sputum smear vs culture | Coefficient | P-value | [95% conf. Interval] |
| The recruited sample size (sample size < 200 vs. sample size ≥ 200) | 9.3 | 0.491 | (-21.78-40.44) |
| Publication years(10 ≤ years vs. 10> years) | 12.2 | 0.187 | (-8.4-33) |
| Type of sputum staining( Ziehl–Neelsen vs. Auramine-rhodamine) | 5.4 | 0.541 | (-15.16-26.14) |
| Quality of the included papers (quality ≥17vs quality < 17) | 0.53 | 0.952 | (-12.73-25.14) |
| Negative predictive value of sputum smear vs culture | Coefficient | P-value | [95% conf. Interval] |
| The recruited sample size (sample size < 200 vs. sample size ≥ 200) | -1.34 | 0.871 | (-22.46-19.77) |
| Publication years(10 ≤ years vs. 10> years) | -4.12 | 0.491 | (-18.36-10.12) |
| Type of sputum staining( Ziehl–Neelsen vs. Auramine-rhodamine) | -0.77 | 0.901 | (-16.20-14.71) |
| Quality of the included papers (quality ≥17vs quality < 17) | 8.43 | 0.252 | (-8.54-25.41) |
| Sensitivity of PCR vs culture | Coefficient | P-value | [95% conf. Interval] |
| The recruited sample size (sample size < 200 vs. sample size ≥ 200) | 8.82 | 0.212 | (-9.15-26.80) |
| Publication years(10 ≤ years vs. 10> years) | -2.57 | 0.946 | (-22.52-21.47) |
| Quality of the included papers (quality ≥17vs quality < 17) | 36.26 | 0.031 | (6.1-66.35) |
| Specificity of PCR vs culture | Coefficient | P-value | [95% conf. Interval] |
| The recruited sample size (sample size < 200 vs. sample size ≥ 200) | -2.6 | 0.922 | (-270.7-265.5) |
| Publication years(10 ≤ years vs. 10> years) | -7.7 | 0.775 | (-273.08-257.6) |
| Quality of the included papers (quality ≥17vs quality < 17) | 3.7 | 0.871 | (-233.4-241.1) |
Sensitivity of sputum smear microscopy relative to sputum culture by the quality of studies
The pooled sensitivity of sputum smear microscopy in studies whose quality was more than or equal to 17 and less than 17 was 83.90% (95% CI: 75.31%-92.48%) and 67.74% (95% CI: 58.25%-77.24%), respectively.
Specificity of sputum smear microscopy relative to sputum culture by sample size
Pooled specificity of sputum smear microscopy in studies with a sample size of less than 200 and greater than or equal to 200 was 88.91% (95% CI: 82.39%-95.43%) and 98.30% (95% CI: 96.45%-100%), respectively.
Sensitivity of PCR test relative to sputum culture by the quality of studies
PCR pooled sensitivity in studies whose quality was more or equal to 17, and less than 17 was 94.66% (95% CI: 90.78%-96.55%) and 54.33% (95% CI: 46.17%-62.48%), respectively.
Meta-regression between main variables and covariates
Except for the quality of studies in the sensitivity of sputum smear microscopy and PCR, as well as the sample size in the specificity of sputum smear microscopy, which was significant, no significant source of heterogeneity was detected in the variables in the meta-regression; that is, only heterogeneity was high in them (Table 3).
Discussion
To our knowledge, the present study is the first systematic review and meta-analysis in Iran to compare the accuracy of direct sputum smear microscopy and PCR relative to the sputum culture in the diagnosis of pulmonary tuberculosis. Among the indicators related to the accuracy of diagnostic tests, sensitivity is the most important indicator related to diagnostic tests for infectious diseases such as tuberculosis. In this study, the pooled sensitivity of sputum smear microscopy was 75.12% which indicates a 25% under-diagnosis error rate. Furthermore, the pooled sensitivity of sputum smear has increased from about 70% in 2010 and years before that to more than 78% in the years after 2010, which can be due to improved preparation and laboratory methods in recent years. Our finding is consistent with the study of Shate et al., who reported 77.4% sensitivity(39). In other studies, the sensitivity of smear microscopy was reported to be 34-80%, depending on the setting(12,40-42). To increase the diagnostic accuracy, in Iran, three sputum samples obtained on three different days are routinely sent to a reference laboratory for microscopic examination. It is recommended to collect one of these samples in the early morning. However, the accuracy of this method is greatly affected by sample collection methods and personnel skills. In addition, the number of bacilli in the sputum sample is crucial as the presence of 5000-10000 tubercle bacilli per milliliter of the sample is necessary to achieve the diagnosis (43). Concomitant HIV infection can also reduce the sensitivity of this test(44). Due to the low sensitivity of this test, many attempts have been made in recent years to use more sensitive diagnostic methods, including the use of fluorescent microscopy and Xpert MTB/RIF assay(45,46). The Xpert MTB/RIF assay is a novel, fast and automated method that has been considered in recent years and can detect rifampicin resistance within 2 hours. The sensitivity and specificity of this test for the diagnosis of tuberculosis is acceptable. In a study by Pherson et al. in 2013, this assay was able to identify 98.2% of smear-positive samples and 72.5% of smear-negative samples. According to the recommendation of the World Health Organization, it can be used as a complementary method of sputum smear, at least in those whose smear result is negative(47). However, due to being costly and time-consuming, this method is not used routinely in many parts of the world. In most developing countries, including Iran, direct smear microscopy remains the main primary method for tuberculosis diagnosis. For this reason, policymakers recommend that where the infrastructure is in place, at least bacterial culture be performed in addition to sputum smear microscopy. In addition to higher sensitivity, the culture method can also show bacterial susceptibility to drugs.
The pooled sensitivity of PCR was higher than the sputum smear and was about 88%.This finding is in line with the systematic review and meta-analysis conducted by Shate et al. in 2019, in which the sensitivity of PCR was reported to be 88.02% (39). Nowadays, the qualitative and quantitative molecular PCR method (Real-time PCR) is used as a method with high specificity and sensitivity for the diagnosis of tuberculosis, which can contribute to timely diagnosis and appropriate treatment. In fact, this method is able to detect a very small number of microorganisms (less than 10)(17,48) and can be used along with a sputum smear to improve diagnosis. Our results showed that the overall sensitivity of this test in recent years was lower than in the years 2010 and before that and was 95% vs. 81%, which is contrary to expectations. A possible explanation for this finding could be the smaller number of studies conducted before 2010 and smaller sample size which increases the probability of random error and instability of findings.
On the other hand, the pooled specificity of PCR in the present study was 91%, which was slightly lower than the estimated specificity for sputum smear (93%). Based on the results of the systematic review and meta-analysis by Shate et al., the specificity of the sputum smear was 97%, which is in line with the present study(39). In addition, the specificity of PCR was reported to be 81% in the study of Greco et al(49), which is lower compared to our study. Despite the fact that the relatively high specificity of sputum smear and PCR in most diagnostic and screening programs for infectious diseases such as tuberculosis, high sensitivity and consequent reduction of false negatives are more important than specificity in the early stages. That’s because failure to start treatment at the right time can lead to the spread of the disease in the community. Therefore the use of sensitive tests, especially in certain subgroups of the population, such as HIV-infected patients or people whose sputum smear results are negative, can be effective in preventing the spread of the disease in the community and should be reinforced in future planning.
One of the limitations of the present study is not performing an analysis in specific demographic subgroups due to the small number of studies. In addition, the inability of Iranian databases to combine keywords reduces search sensitivity. In the present study, the diagnostic value of microscopic and PCR tests was examined only once, while increasing the number of routine tests can affect these indices. The omission of a number of studies due to insufficient data and ambiguity of the reference group is another limitation of this study.
Conclusion
We showed a higher sensitivity of both sputum smear and PCR during recent years and also in high-quality studies. This finding is indicative of improvement in pulmonary tuberculosis diagnostic methods in recent years. However, the imperfect sensitivity of these methods on one hand and the role of accurate detection and timely treatment of cases in disease prevention in another hand, highlight the need for more sensitive methods in disease screening and early detection in Iran.
Acknowledgments
The authors would like to thank Kerman University of Medical Sciences.
Conflict of Interests
The authors declare that they have no competing interests.
Appendix
Appendix 1. PubMed search strategy:
1-“diagnostic value” OR sensitivity AND specificity AND
2-“mycobacterium tuberculosis” OR “pulmonary tuberculosis”
3- “sputum sample” OR “sputum smear test” OR “Sputum Smear” OR “microscopy smear”
4-“Polymerase Chain Reaction” OR PCR
5-iran.
5-1 AND 2 AND 3 AND 4 AND 5
Cite this article as: Rahmati Sh, Bahrampour A, Nasehi M, Mirzazadeh A, Ghaderi H, Shahesmaeili A. An Evaluation of The Diagnostic Value of Sputum Smears Microscopy and Pcr Relative to Sputum Culture in The Diagnosis of Pulmonary Tuberculosis: A Systematic Review and Meta-Analysis in Iran. Med J Islam Repub Iran. 2022 (27 Sep);36:112. https://doi.org/10.47176/mjiri.36.112
References
- 1. Raviglione MC, O'Brien RJ. Tuberculosis. In: Kasper F, Hauser F, editors. Harrison’s principles of internal medicine. New York: MacGraw-Hill; 2012. p. 1340-1385.
- 2.Glaziou P, Falzon D, Floyd K, Raviglione M. Glaziou P, Falzon D, Floyd K, Raviglione MGlobal epidemiology of tuberculosisSeminars in respiratory and critical car e medicine. Thieme Med. 2013;34:3–16. doi: 10.1055/s-0032-1333467. [DOI] [PubMed] [Google Scholar]
- 3. World Health Organization. Global tuberculosis report 2014. Geneva: World Health Organization; 2014.
- 4. https://www.isna.ir/news/97072413250/%D8%A2%D8%AE%D8%B1%DB%8C%D9%86-%D9%88%D8%B6%D8%B9%DB%8C%D8%AA-%D8%B3%D9%84-%D8%AF%D8%B1.
- 5.Lange C, Chesov D, Furin J, Udwadia Z, Dheda K. Revising the definition of extensively drug-resistant tuberculosis. Lancet Respirator Med. 2018;6(12):893–895. doi: 10.1016/S2213-2600(18)30428-4. [DOI] [PubMed] [Google Scholar]
- 6. Census page of Statistical Center of Iran Available from https://nnt.sci.org.ir/sites/Apps/yearbook/Lists/year_book_req/Item/ne wifs.asp. Accessed July 8, 2016.
- 7. Organization WH. Tuberculosis: WHO; 2021 [14 October]. Available from: https://www.who.int/news-room/fact-sheets/detail/tuberculosis#:~:text=Worldwide%2C%20TB%20is%20the%2013th,all%20countries%20and%20age%20groups.
- 8. Alagna R, Besozzi G, Codecasa LR, Gori A, Migliori GB, Raviglione M, Cirillo DM. Celebrating World Tuberculosis Day at the time of COVID-19. Eur Respir J. 2020 Apr 1;55(4). [DOI] [PMC free article] [PubMed]
- 9. Sevilla IA, Molina E, Elguezabal N, Pérez V, Garrido JM, Juste RA. Detection of mycobacteria, Mycobacterium avium subspecies, and Mycobacterium tuberculosis complex by a novel tetraplex real-time PCR assay. J Clin Microbiol. 2015 Mar;53(3):930-40. [DOI] [PMC free article] [PubMed]
- 10. Téllez-Navarrete NA, Ramon-Luing LA, Muñoz-Torrico M, Preciado-García M, Medina-Quero K, Hernandez-Pando R, et al. Anti-tuberculosis chemotherapy alters TNFR2 expression on CD4+ lymphocytes in both drug-sensitive and-resistant tuberculosis: however, only drug-resistant tuberculosis maintains a pro-inflammatory profile after a long time. Mol Med. 2021 Dec;27(1):1-4. [DOI] [PMC free article] [PubMed]
- 11.Steingart KR, Ramsay A, Pai M. Steingart KR, Ramsay A, Pai MOptimizing sputum smear microscopy for the diagnosis of pulmonary tuberculosisExpert Rev Anti Infect Ther. 2007 Jun. 1;5(3):327–31. doi: 10.1586/14787210.5.3.327. [DOI] [PubMed] [Google Scholar]
- 12. Chiang CY, Lin CJ. Principles of chemotherapy for tuberculosis in national tuberculosis programmes of low-and middle-income countries. Indian J Tuberc. 2020 Nov 28. [DOI] [PubMed]
- 13.API Consensus Expert Committee. API TB Consensus Guidelines 2006: Management of Pulmonary Tuberculosis, Extra-Pulmonary Tuberculosis and Tuberculosis in Special Situations. J Assoc Physic Ind. 2006;54:219–34. [PubMed] [Google Scholar]
- 14.Lee HS, Kee SJ, Shin JH, Kwon YS, Chun S, Lee JH, et al. Lee HS, Kee SJ, Shin JH, Kwon YS, Chun S, Lee JH, et alXpert MTB/RIF assay as a substitute for smear microscopy in an intermediate-burden settingAm J Respir Crit Care Med. 2019 Mar. 15;199(6):784–94. doi: 10.1164/rccm.201804-0654OC. [DOI] [PubMed] [Google Scholar]
- 15. Raviglione MC, O'Brien RJ. Tuberculosis. In: Kasper F, Hauser F, editors. Harrison’s Principles of Internal Medicine. New York, NY: MacGraw-Hill; 2012. P. 1340-85. 3.
- 16.Salajka F, Mezensky L, Pokorny A. Commercial polymerase chain reaction test (Amplicor set) in the diagnosis of smear-negative pulmonary tuberculosis from sputum and bronchoalveolar lavage. Monaldi Arch Chest Dis. 2000;55(1):9–12. [PubMed] [Google Scholar]
- 17. Chen NH, Liu YC, Tsao TC, Wu TL, Hsieh MJ, Chuang ML, et al. Combined bronchoalveolar lavage and polymerase chain reaction in the diagnosis of pulmonary tuberculosis in smear-negative patients. Int J Tuberc Lung Dis. 2002 Apr;6(4):350-5. [PubMed]
- 18.Parsons LM, Brosch R, Cole ST, Somoskövi A, Loder A, Bretzel G, et al. Rapid and simple approach for identification of Mycobacterium tuberculosis complex isolates by PCR-based genomic deletion analysis. J Clin Microbiol. 2002;40(7):2339–45. doi: 10.1128/JCM.40.7.2339-2345.2002. [DOI] [PMC free article] [PubMed] [Google Scholar]
- 19.Asnaashari AM, Towhidi M, Farid R, Abbaszadegan MR, Attaran D, Fatemi SS, et al. Evaluation of polymerase chain reaction for diagnosis of "tuberculous pleurisy". Tanaffos. 2011;10(1):12–8. [PMC free article] [PubMed] [Google Scholar]
- 20.Sheykholslami FM, Ziaee AA, Reza MK, Mohammadi F, Farnia P, Masjedi MR. The diagnosis of pulmonary tuberculosis by PCR method. Tanaffos. 2005;13(4):63–70. [Google Scholar]
- 21.Naderi M, Naserpour F, SHarifi MB, Kouhpaeh HR, Nabi AM. Naderi M, Naserpour F, SHarifi MB, Kouhpaeh HR, Nabi AMDetermination of sensitivity and specificity of PCR of comparison with culture in diagnosis of infection with Mtuberculosis. J Guilan Med School. 2004;13(52):55–59. [Google Scholar]
- 22.Kazerani M, Jalalian Elahi N, Mohajeri N, Ghazvini K, Taghdisi S, Ghafghazi M, et al. Kazerani M, Jalalian Elahi N, Mohajeri N, Ghazvini K, Taghdisi S, Ghafghazi M, et alComparison of sensitivity and specificity of PCR and sputum smear compared to culture in diagnosis of tuberculosisTUMS J. 2019 Oct. 10;77(7):428–33. [Google Scholar]
- 23. Ali Javad Mousavi S, Barati M, Reza Kochari M, Javadinia S, Talebi Taher M. Evaluation of the diagnostic value of PCR and smear for diagnosis of tuberculosis in bronchoalveolar lavage. J Razi Med Sci. 2013 Mar 1;19(105).
- 24. Gholoobi A, Masoudi-Kazemabad A, Meshkat M, Meshkat Z. Comparison of culture and PCR methods for diagnosis of Mycobacterium tuberculosis in different clinical specimens. Jundishapur J Microbiol. 2014 Feb;7(2). [DOI] [PMC free article] [PubMed]
- 25.Naeini RA, Niazi A, Metanat M, Keykha E, Moghadam AA, Mood EN. Comparing the diagnostic value of sputum smear with and without sodium hypochlorite using light microscopy and fluorescent microscopy in patients suspected of pulmonary tuberculosis. J Mazandaran Uni Med Sci. 2016;26(137):42–9. [Google Scholar]
- 26.Ziaei M, Namaei M, Khazaei M, Azarkar G. Comparison of the value of two different sputum staining for diagnosis of acid-fast bacilli. Iran J Clin Infect Dis. 2008;3(2):99–102. [Google Scholar]
- 27.Aminzadeh Z, Fallah F, Manafian B, Baghaei P. Aminzadeh Z, Fallah F, Manafian B, Baghaei PEvaluation of MODS culture in diagnosis of pulmonary tuberculosisPan Afr Med J. 2012 Jan. 16;6(2):288–91. [Google Scholar]
- 28.Shirani D, Golbanek N. Application of PCR in the diagnosis of Mycobacterium tuberculosis complex. Hakim R J. 2006;9(1):11–22. [Google Scholar]
- 29.Khorshidi A, Rohani M, Moniri R, Torfeh M. Khorshidi A, Rohani M, Moniri R, Torfeh MComparison of culture and microscopic methods by PCR for detection of Mycobacterium tuberculosis in sputumArch Clin Infect Dis. 2009 Oct. 31;4(4):228–32. [Google Scholar]
- 30.Ekrami A, Samarbaf-Zadeh AR, Khosravi A, Zargar B, Alavi M, Amin M, Kiasat A. Validity of bioconjugated silica nanoparticles in comparison with direct smear, culture, and polymerase chain reaction for detection of Mycobacterium tuberculosis in sputum specimens. Int J Nanomed. 2011;6:2729. doi: 10.2147/IJN.S23239. [DOI] [PMC free article] [PubMed] [Google Scholar]
- 31. Naserpour Farivar T, Johari P, Hashemi Shahri M, Naderi M, Alavi R, Sharifi-Mood B. Sensitivity and Specificity of TaqMan Real Time PCR, PCR, Microscopy and Culture in Diagnosis of Tuberculous Meningitis in a High Incidence of Tuberculosis Province in Southeast of Iran. Biotechnol Health Sci. 2014.
- 32.Nour-Neamatollahi A, Siadat SD, Yari S, Tasbiti AH, Ebrahimzadeh N, Vaziri F, et al. Nour-Neamatollahi A, Siadat SD, Yari S, Tasbiti AH, Ebrahimzadeh N, Vaziri F, et alA new diagnostic tool for rapid and accurate detection of Mycobacterium tuberculosisSaudi J Biol Sci. 2018 Mar. 1;25(3):418–25. doi: 10.1016/j.sjbs.2016.01.026. [DOI] [PMC free article] [PubMed] [Google Scholar]
- 33. Farnia P, Mohammadi F, Zarifi Z, Tabatabee DJ, Ganavi J, Ghazisaeedi K, et al. Improving sensitivity of direct microscopy for detection of acid-fast bacilli in sputum: use of chitin in mucus digestion. J Clin Microbiol. 2002 Feb;40(2):508-11. [DOI] [PMC free article] [PubMed]
- 34. Mansoori N, Pahlavanzadeh B, Arabmofrad F. Evaluation of the Xpert MTB/RIF test accuracy for diagnosis of tuberculosis in areas with a moderate tuberculosis burden. Apmis. 2021 Jan;129(1):9-13. [DOI] [PubMed]
- 35.Rivandi S, Bahremand A, Zinli S. Detection of mycobacterium tuberclusis by PCR in sputum samples that are negative by conventional methods. J School Med. 1997;(6):1–5. [Google Scholar]
- 36. Wang X, Chen Y, Liu Y, Yao L, Estill J, Bian Z, et al. Reporting items for systematic reviews and meta-analyses of acupuncture: the PRISMA for acupuncture checklist. BMC Complement Altern Med. 2019 Dec;19(1):1-0. [DOI] [PMC free article] [PubMed]
- 37.Bossuyt PM, Reitsma JB, Bruns DE, Gatsonis CA, Glasziou PP, Irwig L, et al. Bossuyt PM, Reitsma JB, Bruns DE, Gatsonis CA, Glasziou PP, Irwig L, et alSTARD 2015: an updated list of essential items for reporting diagnostic accuracy studiesClin Chem. 2015 Dec. 1;61(12):1446–52. doi: 10.1373/clinchem.2015.246280. [DOI] [PubMed] [Google Scholar]
- 38.Higgins JP, Thompson SG, Deeks JJ, Altman DG. Measuring inconsistency in meta-analyses. BMJ. 2003;327(7414):557–60. doi: 10.1136/bmj.327.7414.557. [DOI] [PMC free article] [PubMed] [Google Scholar]
- 39. Shete PB, Farr K, Strnad L, Gray CM, Cattamanchi A. Diagnostic accuracy of TB-LAMP for pulmonary tuberculosis: a systematic review and meta-analysis. BMC Infect Dis. 2019 Dec;19(1):1-1. [DOI] [PMC free article] [PubMed]
- 40.Lewinsohn DM, Leonard MK, LoBue PA, Cohn DL, Daley CL, Desmond E, Keane J, et al. Lewinsohn DM, Leonard MK, LoBue PA, Cohn DL, Daley CL, Desmond E, Keane J, et alOfficial American Thoracic Society/Infectious Diseases Society of America/Centers for Disease Control and Prevention clinical practice guidelines: diagnosis of tuberculosis in adults and childrenClin Infect Dis. 2017 Jan. 15;64(2):e1–33. doi: 10.1093/cid/ciw694. [DOI] [PubMed] [Google Scholar]
- 41.Cohen RA, Muzaffar S, Schwartz D, Bashir S, Luke S, McGARTLAND LP, et al. Cohen RA, Muzaffar S, Schwartz D, Bashir S, Luke S, McGARTLAND LP, et alDiagnosis of pulmonary tuberculosis using PCR assays on sputum collected within 24 hours of hospital admissionAm J Respir Crit Care Med. 1998 Jan. 1;157(1):156–61. doi: 10.1164/ajrccm.157.1.97-06043. [DOI] [PubMed] [Google Scholar]
- 42.Dalovisio JR, Montenegro-James S, Kemmerly SA, Genre CF, Chambers R, Greer D, Pankey GA, Failla DM, Haydel KG, Hutchinson L, Lindley MF. Dalovisio JR, Montenegro-James S, Kemmerly SA, Genre CF, Chambers R, Greer D, Pankey GA, Failla DM, Haydel KG, Hutchinson L, Lindley MFComparison of the amplified Mycobacterium tuberculosis (MTB) direct test, Amplicor MTB PCR, and IS6110-PCR for detection of MTB in respiratory specimensClin Infect Dis. 1996 Nov. 1;23(5):1099–106. doi: 10.1093/clinids/23.5.1099. [DOI] [PubMed] [Google Scholar]
- 43.Centers for Disease Control and Prevention. Guidelines for preventing the transmission of Mycobacterium tuberculosis in health-care facilities, 1994. MMWR Recomm Rep. 1994;43(RR-13):1–132. [PubMed] [Google Scholar]
- 44. Desikan P. Sputum smear microscopy in tuberculosis: is it still relevant? Indian J Med Res. 2013 Mar;137(3):442. [PMC free article] [PubMed]
- 45.Steingart KR, Henry M, Ng V, Hopewell PC, Ramsay A, Cunningham J, et al. Fluorescence versus conventional sputum smear microscopy for tuberculosis: a systematic review. Lancet Infect Dis. 2006;6:570–81. doi: 10.1016/S1473-3099(06)70578-3. [DOI] [PubMed] [Google Scholar]
- 46.Mase SR, Ramsay A, Ng V, Henry M, Hopewell PC, Cunningham J, et al. Mase SR, Ramsay A, Ng V, Henry M, Hopewell PC, Cunningham J, et alYield of serial sputum specimen examinations in the diagnosis of pulmonary tuberculosis: a systematic review. Int J Tuberc Lung Dis. 2007;11:485–95. [PubMed] [Google Scholar]
- 47.MacPherson P, Houben RM, Glynn JR, Corbett EL, Kranzer K. MacPherson P, Houben RM, Glynn JR, Corbett EL, Kranzer KPre-treatment loss to follow-up in tuberculosis patients in low-and lower-middle-income countries and high-burden countries: a systematic review and meta-analysisBull World Health Organ. 2013 Nov. 22;92:126–38. doi: 10.2471/BLT.13.124800. [DOI] [PMC free article] [PubMed] [Google Scholar]
- 48.Parsons LM, Brosch R, Cole ST, Somoskövi A, Loder A, Bretzel G, et al. Rapid and simple approach for identification of Mycobacterium tuberculosis complex isolates by PCR-based genomic deletion analysis. J Clin Microbiol. 2002;40(7):2339–45. doi: 10.1128/JCM.40.7.2339-2345.2002. [DOI] [PMC free article] [PubMed] [Google Scholar]
- 49. Greco S, Rulli M, Girardi E, Piersimoni C, Saltini C. Diagnostic accuracy of in-house PCR for pulmonary tuberculosis in smear-positive patients: meta-analysis and metaregression. J Clin Microbiol. 2009 Mar;47(3):569-76. [DOI] [PMC free article] [PubMed]