

Abstract
Study objectives:
Adolescents in the United States have undergone dramatic declines in pregnancies and births in recent decades. We aimed to estimate the contribution of changes in three proximal behaviors to these declines among 14-18-year-olds for 2007-2017: 1) delays in age at first sexual intercourse, 2) declines in number of sexual partners, and 3) changes in contraceptive use, particularly uptake of long-acting reversible contraception (LARC).
Design:
We adapted an existing iterative dynamic population model and parameterized it using six waves of the Centers for Disease Control and Prevention's Youth Risk Behavior Survey. We compared pregnancies from observed behavioral trends with counterfactual scenarios that assumed constant behaviors over the decade. We calculated outcomes by cause, year and age.
Results:
We found that changes in these behaviors could explain reductions of 496,200, 78,500, and 40,700 pregnancies over the decade, respectively, with total medical and societal cost savings of $9.71 billion, $1.54 billion, and $796 million. LARC adoption, particularly among 18-year-olds, could explain much of the improvements from contraception use. The three factors together did not fully explain observed birth declines; adding a 50% decline in sex acts per partner did.
Conclusions:
Delays in first sexual intercourse contributed the most to declining births over this decade, although all behaviors considered had major effects. Differences from earlier models may result from differences in years and ages covered. Evidence-based teen pregnancy prevention programs, including comprehensive sex education, youth-friendly reproductive health services and parental and community support can continue to address these drivers and reduce teen pregnancy.
Keywords: Adolescents, contraception, pregnancies, sexual behavior, United States
Adolescent pregnancy and birth rates have declined sharply in the US over the last quarter-century.1 Nevertheless, they remain greater than in most other high-income countries,2 with evidence for multiple explanations, e.g. the US’s high economic inequality3 and religiosity4 or low access to birth control and comprehensive sex education.5 US adolescent pregnancy rates also display significant disparities by race/ethnicity, income, education, and geography.1 Adolescent pregnancies may result in social, health and economic impacts for the adolescent, society and health systems.6 Although the distal contributing factors for adolescent pregnancies are complex and include many social determinants, each acts through a set of proximal determinants including sexual behaviors and contraception use. Understanding the magnitude of each proximal determinant’s contribution, overall and by age, helps to inform policies and programmatic efforts to reduce adolescent pregnancy.
A report from the US Centers for Disease Control and Prevention7 highlights that, from 2007-2017, adolescents in high school reported decreases in multiple sexual behaviors, including ever having had sexual intercourse (SI), having had SI in the previous 3 months, and having 4+ lifetime sex partners. Subsequent data suggest these trends have continued.8 Condom use declined over this period;9 however, use of other contraceptive methods increased.7 These include long-acting reversible contraception (LARC, i.e. contraceptive implants and intrauterine devices), which may be ideal for adolescents given their ease of use, reversibility, and effectiveness—the highest of any reversible method.10 LARC uptake among adolescents has thus received considerable attention.11-13 LARC use has been steadily increasing among US women, although rates among adolescents remain lower than older ages.14
Prior studies examining contributions of changes in sexual behaviors and contraceptive use to adolescent pregnancy declines have attributed the majority to increases in contraception use.15-17 However, the most recent such study15 only covered through 2012, before surveillance data demonstrated declines in adolescent sexual activity. This study also found a modest role for LARC, but anticipated future greater influence. Focused efforts to increase adolescent access to and use of LARC have seen great success locally,18 and demonstrate its potential; however, little evidence documents LARC’s impact on overall adolescent pregnancy rates nationally.
These changes in sexual behavior and contraception use call for a reassessment of their impacts on adolescent reproductive and sexual health outcomes. Our previous modeling paper9 explored these impacts for two sexually-transmitted infections (STIs): gonorrhea and chlamydia. Using a model parameterized from the Youth Risk Behavior Survey (YRBS), we found that reported sexual behavior changes predicted substantial STI decline.
Here we extend our previous work to assess the contributions of recent changes in sexual behaviors and contraceptive use among adolescent females to declines in adolescent pregnancies. We adapt our model of adolescent STI dynamics, restructuring relevant probabilities to address pregnancy and introducing multiple contraception methods. We disaggregate findings by age to identify whether these proximate determinants differ across the period of adolescence. Finally, we compare model outcomes to reported births to consider the amount of additional behavior change not measured in our data needed to match the observed decline.
MATERIALS AND METHODS
Our model estimated the number of pregnancies in 14-18-year-old females by year and age. Many aspects of the methods and codebase build on work previously described on the public-use teen-SPARC tool website (www.emorycamp.org/teensparc) and our previous STI model,9 with substantial revisions. We provide a stand-alone methodological summary here and in the Online Supplement; the latter also contains a brief introduction to modeling and its goals as relevant to our methodological choices.
Pregnancies include those ending in birth, induced abortion, miscarriage or stillbirth. The model estimates pregnancies for females of age a in year y (Pa,y), as:
E is population size, D is proportion having had SI, f is the probability of pregnancy per SI act without contraception; r is the relative failure rate for contraception method m, c is mean number of SI acts per year across all partners for females who have ever had SI, and φ is the proportion of SI acts using method m. The quantity c is a product of the number of partners and acts/partner. The expression inside the product represents a traditional Bernoulli repeat-exposure probability, with pregnancy probabilities in the base and exposure count in the exponent. The latter are partitioned by contraception method, and the former reduced by each method’s effectiveness.
Table S1 lists parameter data sources. We used YRBS as our main source of behavioral data to obtain the maximum sample size for adolescents and for consistency with our previous work. We analyzed the National YRBS 2017 Combined Dataset,19 which includes data from previous years, using SASv9.4 (SAS Institute, Inc., Cary, NC) survey procedures to address YRBS’s complex sampling and respondent weights. The questions in YRBS do not map perfectly onto the parameters listed above, with the latter chosen to enable partitioning of effects into specific ages and years (e.g. mean number of sex acts for 17-year old females in 2017, as opposed to lifetime partner numbers). This necessitated some back calculation; e.g. following teen-SPARC, we used YRBS’s questions on current age, age at first SI, and lifetime number of partners to back-calculate mean number of partners/year.
The equation includes four behavioral components, of which three appear in our main analysis: age at sexual initiation, mean annual sexual partner number, and contraception use. Note that the second is measured conditional on the first, i.e. years before sexual initiation are not included in calculating annual partner means (see Supplement for example). YRBS does not include data on the fourth metric (sexual acts/partner); we conduct a separate exploratory analysis on this, described below.
We conducted regressions on measured behaviors and contraceptive methods to ascertain smoothed predicted values for model inputs for each age/year combination. For probability of ever having had SI and partners/year, we included survey year as a numerical predictor for consistency with our previous work and given good model fit. For contraception use, response options changed across years (Table 1); we thus conducted regressions within year for the options available that year. Each year included 6 options, collectively representing 9 choices, some overlapping. We re-assigned predicted values for these 9 responses into 6 final categories, following the assumptions presented in Table 1. We assigned relative failure probabilities for each method (Table S2), and imputed use rates in non-survey years as the midpoint of adjacent years.
Table 1.
Contraception Method Options Included in Youth Risk Behavior Survey Rounds, With Partitioning as Used in Model Scenarios
| Inclusion within final set of types modeled | ||||||||
|---|---|---|---|---|---|---|---|---|
| Years | Method as included in survey a |
Summary name (for Figure 1) |
no method |
condom | pills | other hormonal |
LARC | withdrawal or other |
| All years | “No method was used to prevent pregnancy” | No method | X | |||||
| “Condoms” | Condoms | X | ||||||
| “Birth control pills” | Pills | X | ||||||
| 2007, ’09 | “Depo-Provera (injectable birth control)” | Injectables | X | |||||
| “Withdrawal” | Withdrawal | X | ||||||
| “Some other method” |
Other
(2007-9 options) |
variesb | variesb | |||||
| 2011 | “Depo-Provera (or any injectable birth control), Nuva Ring (or any birth control ring), Implanon (or any implant), or any IUD” | Other hormonal or LARC | variesb | variesb | ||||
| “Withdrawal” | Withdrawal | X | ||||||
| “Some other method” |
Other
(2011 options) |
X | ||||||
| 2013, ’15, ’17 | “A shot (such as Depo-Provera), patch (such as Ortho Evra), or birth control ring (such as NuvaRing)” | Other hormonal | X | |||||
| “An IUD (such as Mirena or ParaGard) or implant (such as Implanon or Nexplanon)” | LARC | X | ||||||
| “Withdrawal or some other method” | Withdrawal or other (2013-7 options) | X | ||||||
LARC = long-acting reversible contraceptive
A final response (“not sure”) was provided each year; the small proportion of respondents selecting this were excluded from our analysis, such that proportions were calculated out of the sum of all other responses.
Allocations vary by scenario. For med-LARC, we assume a linear increase in LARC use from 0 in 2007 to the observed level in 2013, assigning intermediate levels in 2009 and 2011 drawn from these responses; the remainder are assigned to “other hormonal”. For max-LARC, we assign these responses to LARC up to the level of LARC use in 2013; the rest is then applied to “other hormonal”. However, for 2007 only, LARC use is assumed to be 0, with “other” assigned to other hormonal; this is done to maximize the amount of change in LARC during the observed time period, and thus to estimate the maximum possible impact of LARC adoption. For min-LARC, we assume no LARC use in these survey years, with all of this response assigned to “other hormonal.”
Given recent focus on adolescent LARC, and the lack of a specific LARC use question before 2013, we defined a main scenario (“med-LARC”) and two outer-bound scenarios (“min-LARC” and “max-LARC”), anticipating the truth to lie near the former and between the latter two. For “med-LARC” we model LARC use increasing linearly from 2007-2013. Min-LARC models LARC use beginning with 2012, after the last survey without a LARC-specific question. Max-LARC extends 2013’s reported level backwards, but with no LARC use in 2007 to maximize change from baseline and thus cumulative impact of adoption.
We calibrated our model to estimates of pregnancies per single maternal ages for 2007. Since the National Vital Statistics System (NVSS) records live births rather than all pregnancies, we used data from the Guttmacher Institute1 to convert pregnancy outcomes to births for comparison (see Supplement and Table S3). We used age-year-race/ethnicity population totals from the Census as denominators here, since these numbers are not limited to those in school. We used Approximate Bayesian Computation to estimate a probability of detectable pregnancy per act of SI without contraception that yielded the above counts given our behavioral and contraceptive inputs, and fixed this probability for subsequent analyses.
YRBS surveys high-school-attending adolescents specifically, and YRBS’s survey weights align the sample to the population of US high school students, not all adolescents. Those who have left school presumably differ from students in many ways, including sexual behaviors and pregnancy rates, suggesting bias in our sample relative to modeled population (which uses population sizes and births for all 14-18-year-olds). The calibration process provides a means of encapsulating this difference, with the calibrated value reflecting the product of two components: an actual probability of contraception per act, and a relative rate of exposure to pregnancy risk for all adolescents compared to in-school adolescents. This does not require separately identifying each component. With this interpretation, we need not assume that adolescents in- and out-of-school are similar, only that recent levels of behavioral change are proportional within each demographic category.
We simulated a baseline counterfactual model in which our predicted values for behaviors in 2007 continued across the decade. We then simulated behavior change types alone and in combination. Outcomes included the number and percent of pregnancies averted in each scenario relative to baseline, overall and by age and year.
We created an additional counterfactual scenario in which LARC adoption was the only change, thus estimating a LARC-specific attributable proportion. This required assuming which existing contraception methods (including no method) LARC-adopters would have used in the absence of LARC, which our dataset does not indicate. Following the general finding that LARC-adopters come from a range of prior methods,20 including no method, our main scenario assumed that LARC users were drawn from all existing methods (including no method) in proportion to usage. We then conducted a sensitivity analysis in which all LARC users were drawn from one existing method per scenario (withdrawal, condoms, pills).
Pregnancy-related costs included medical costs for all outcomes (prenatal care, live birth, abortion, fetal death, and miscarriage), using data from the IBM® MarketScan® 2007-2017 Commercial and Medicaid Databases), and costs to society for adolescent childbearing.21 The distribution of pregnancy outcomes was derived from a Guttmacher Institute report.1 Social costs were adjusted to 2017 dollars using the All-Items Consumer Price Index CPI, 22 and medical costs with the Medical Care component of the CPI. Medical costs were compounded to 2017 values using a 3% interest rate.
To measure uncertainty, we drew 100 bootstrap samples of individuals from the YRBS dataset with replacement, matching our original sample size, and reran calibrations, regressions, and simulations for each. We re-calculated summary measures and calculated 95% confidence intervals (CIs) on means using standard errors across simulations. Finally, we converted predicted pregnancies to births using the Guttmacher data again.1
YRBS did not provide temporal data for one key model component: number of sex acts/partner. One may reasonably imagine this quantity to be declining similarly to numbers of partners, thus contributing to further pregnancy declines; such a trend would be consistent with parallel findings that adolescents have, over the same timeframe, reported going on fewer dates per week while dating, along with reduced rates of other activities that reflect transitions to adulthood.23 We thus sought to identify a rate of decline that is consistent with births reported in the NVSS. We began by applying a 50% linear decadal decline to our med-LARC scenario. We then compared total births to NVSS, with the plan to iterate by increasingly narrow windows until being within 5% of the reported value.
The data used in this study were approved by CDC as research not involving identifiable human subjects, because students responded anonymously. University of Washington IRB also considers secondary analysis of publicly available data without identifiable information as exempt from review.
RESULTS
Basic descriptive results for the sample for each year are included in Table S4; much more detail for each can be found in the official report published after each round.24-29 Figure 1 shows the overall proportions of females (among those having had SI) providing each response by year. Considering options asked consistently across years, we see a consistent decline in condom use, but a small decline and then larger increase for no method and pills. The similar prevalence of items E (“withdrawal”) and K (“withdrawal or other”) suggest that the latter mostly comprises withdrawal, and that use of methods never listed among options is likely low. LARC use rises over the period it was asked about explicitly (2013-2017).
Figure 1: Reported method of contraception, Youth Risk Behavior Survey 2007-2017.
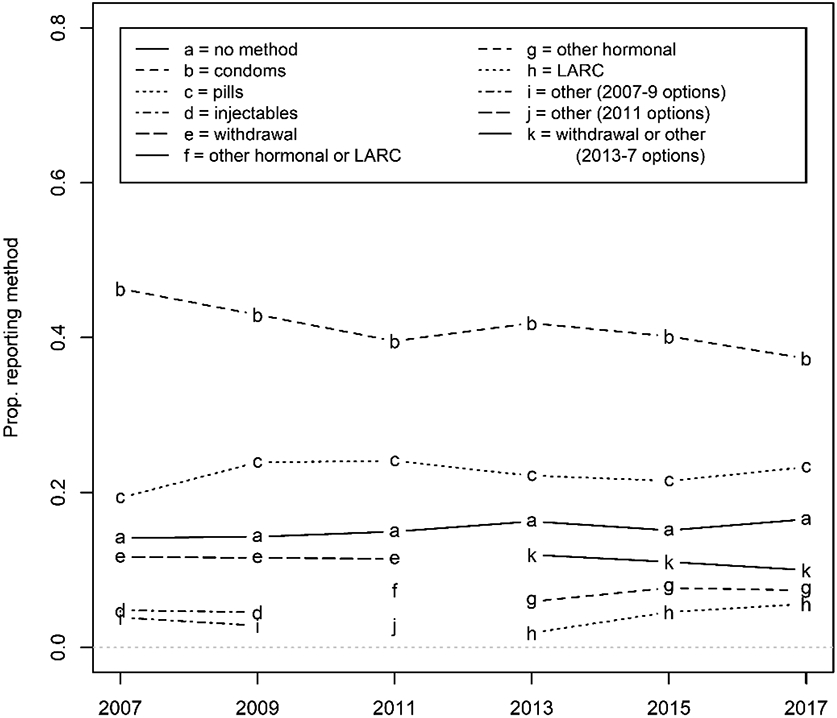
For full wording of each option, see Table 1.
Our model calibrated to an overall 1.28% probability of detectable pregnancy per act of intercourse without contraception. Published estimates averaged across cycle days and ages include 2-4%30 and 3.1%,31 and adolescent females have lower fecundability than the young and middle-age adults included in those estimates,32 placing our calibrated value within the realm of realism. Estimated adjusted total costs per pregnancy ranged from $19,013 (2017) to $21,247 (2013) in 2017 US dollars (Table S5).
Our med-LARC model found that reported behavior change was consistent with 615,400 pregnancies averted in 2008-2017 (CI: 521,600-709,200), or 13.1% (11.1-15.1%) of the total expected without behavior change; associated cost savings were $12.05 billion ($10.21-$13.89). The max-LARC model was slightly higher, at 618,700 (524,900-712,500) or 13.1% (11.1-15.1%) of pregnancies and $12.11 billion ($10.27-$13.96 billion) averted, and min-LARC slightly lower, at 612,100 (518,200-706,000) or 13.0% (11.0-15.0%) of pregnancies and $11.98 billion ($10.14-$13.82 billion) averted. Given the small percentage difference between these predictions, we focus on the med-LARC scenario for subsequent results, but provide all in the supplement (Tables S6-S8).
Figure 2 shows our estimates for pregnancies averted by year and type of behavior change. The greatest contributor is delays in age at first SI (point estimate of 496,200 averted pregnancies). Next is declines in annual sexual partner numbers (78,500), although the CIs overlap 0 most years, and then contraception changes (40,700). The first two effects increase roughly linearly. While this was shaped by our regression models with year as a numerical predictor, those were chosen based on model fit to capture empirical data.9 Contraception use, however, initially moves towards averting more pregnancies (from greater use of more highly effective methods) through 2011, then reversed, before reaching its greatest prevention effect in 2015. Point estimates for cost savings are $9.71 billion (delays in first SI), $1.54 billion (declines in partner numbers), and $796 million (changes in contraception use).
Figure 2. Number of expected pregnancies averted each year (total and by associated behavior change).
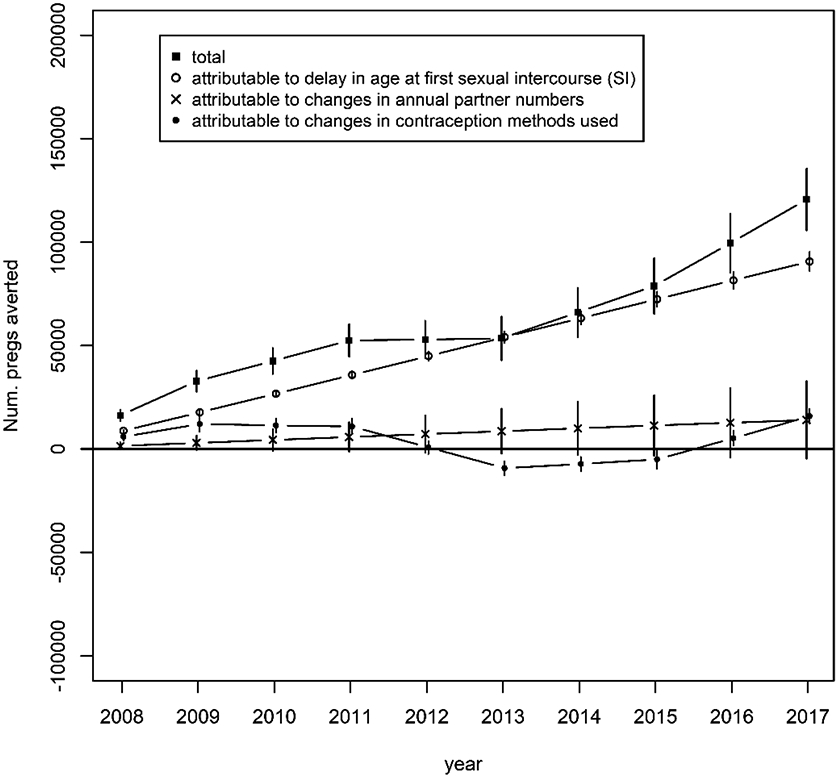
Numbers are relative to pregnancies expected in the year in the absence of any behavior change from 2007-2017. “Total” represents the sum of the other three lines. Dots represent point estimates and bars represent 95% bootstrapped confidence intervals.
Disaggregating results by age (Figure 3) shows the effects of delays in first SI and declining partner numbers grow roughly linearly by age. In contrast, a striking pattern for contraception use is revealed: younger ages reflect a slight move towards less effective methods relative to 2007, while 18-year-olds demonstrate a strong move towards more effective methods. Improvements in contraception use among 18-year-olds avert 169,700 pregnancies (149,900-189,600), or 3.6% of all expected pregnancies in the decade and 27.6% of all averted pregnancies. These values are higher than total pregnancies averted by contraception use changes across all ages, because some of the 18-year-olds’ improvements are offset by reversals among younger adolescents.
Figure 3: Number of pregnancies averted by age and type of behavior change, summed across years.

Numbers are relative to pregnancies expected in the year in the absence of any behavior change from 2007-2017. Dots represent point estimates and bars represent 95% bootstrapped confidence intervals.
We next isolate the effect of LARC by holding all other factors constant (Tables 2, S9). Our main scenario (med-LARC; LARC use replaces all other methods) suggests 116,000 pregnancies averted by LARC through 2017, with associated costs saved of $2.26 billion. In sensitivity analyses, LARC impact declines as the reliability of the contraception types it replaces increases. Figure S1 shows these numbers disaggregated by year and age; impact is heavily concentrated among 17-18-year-olds for all scenarios.
Table 2:
Scenarios Isolating the Effects of Long-Acting Reversible Contraception (LARC) Adoption
| Num. of pregnancies averted (thousands) |
Costs averted (millions) |
% of all pregnancies averted |
% of averted pregnancies attributable to LARCb |
|||||||||
|---|---|---|---|---|---|---|---|---|---|---|---|---|
| LARC use replaces a |
min- LAR Ca |
med- LAR Ca |
max- LAR Ca |
min- LA RC |
med - LAR C |
max - LAR C |
min- LA RC |
med - LAR C |
max - LAR C |
min- LAR C |
med- LAR C |
max- LAR C |
| all other | 96,385 | 115,975 | 135,584 | 1,870.8 | 2,259.8 | 2,656.8 | 2.0% | 2.5% | 2.9% | 15.7% | 18.8% | 21.9% |
| Withdrawal | 84,508 | 101,402 | 118,306 | 1,639.9 | 1,975.4 | 2,317.6 | 1.8% | 2.2% | 2.5% | 13.8% | 16.5% | 19.1% |
| Condoms | 54,631 | 65,562 | 76,493 | 1,060.2 | 1,277.2 | 1,498.5 | 1.2% | 1.4% | 1.6% | 8.9% | 10.7% | 12.4% |
| Pills | 28,879 | 34,653 | 40,422 | 560.4 | 675.1 | 791.9 | 0.6% | 0.7% | 0.9% | 4.7% | 5.6% | 6.5% |
For explanations of all scenarios, both in terms of what LARC use replaces and overall LARC use prior to 2013 (min-LARC, med-LARC and ax-LARC), see the Methods section of the text
Pregnancies averted in the model varying only LARC use, divided by those in the model varying all reported aspects of sexual behavior
Finally, we consider rates of change in acts/partner over time, beginning with a 50% linear reduction over 10 years, comparing predicted pregnancies to adolescent births reported in NVSS. Figure S2 shows that this initial test actually tracks observed values closely, with an overall divergence of only 2.6% over the decade. Given our a priori stopping rule (<5%), we did not try additional values.
DISCUSSION
We developed a model, parametrized by six waves of YRBS, to estimate the contribution of different elements of sexual behavior to declines in pregnancies and associated costs among US adolescents over the period 2007-2017. We found that delays in age at first SI played the largest role. SI is commonly initiated during adolescence—in past decades, almost 70% of youth experienced sexual debut by age 18,33 and more recently still 57% of 12th graders report having done so.29 Early SI predicts subsequent STI and pregnancy risk.34 The reasons for SI initiation delays have been debated,23,35 but the trend has been documented in multiple nationally-representative studies across race/ethnicity and geography.7,9,36,37 We found that youth are also reducing risk of pregnancy in terms of declines in annual number of sexual partners.7
In the time period of this assessment, changes in contraception use over the decade played a smaller role, preventing an estimated 40,700 new pregnancies and almost $800 million in costs. This represents pregnancies averted from changes in contraception use relative to 2007, not all pregnancies averted by contraception. For example, in 2007 adolescents already reported condoms or pills in roughly two-thirds of recent SI, averting many pregnancies. We found strong differential effects in contraception improvements by age; these were concentrated in 18-year-olds, with slight decreases in younger ages. LARCs played a larger role in pregnancy prevention in later years as uptake of LARC increased.
Our model calibrated to a reasonable non-contracepting per-act fecundity estimate for adolescents (1.28%), which adds credibility to our basic structure. Nevertheless, the three forms of behavior change we examined collectively did not predict the full decadal decline in adolescent births. Including a 50% reduction in one behavior that YRBS does not ask about—SI acts/partner—improved the model estimates’ similarity to observed births, providing some indirect evidence that this metric is also changing substantially among adolescents. While we do not have data to directly support this assumption, it is worth additional investigation.
Our results contrast somewhat with earlier studies that similarly partitioned determinants of adolescent pregnancy declines.15,17 Both identified contraception as the main driver, with the more recent study15 attributing the decline entirely to contraception changes. Time period of analysis may explain this difference, as their data end in 2012, and later YRBS waves show large reductions in sexual activity. Indeed, we found contraception changes playing a larger proportionate role in the years overlapping with their model. Other explanations may include ages and populations covered. We included 14-year-old high school students with an adjustment for out-of-school youth, and these younger adolescents are disproportionately affected by delays in first SI. In contrast, they included the general population of 15-19-year-olds, and 18-19-year-old youth—in or out of school—are more likely to have SI than younger adolescents; effective contraception use may play a larger role in pregnancy prevention for them, similarly to our findings for 18-year-olds in school. Their study used data from the National Survey of Family Growth, which has a much smaller adolescent sample size than YRBS.
Our study has additional limitations. We did not disaggregate by race/ethnicity; given that the relative contributions of drivers of pregnancy may differ by race/ethnicity,38 as was seen for age, analyses stratified on this dimension could identify opportunity to address known health disparities. We did not explicitly model dual contraception or emergency contraception. By using high school YRBS data and calibrating to the entire population aged 14-18, we effectively assumed that out-of-school adolescents have undergone proportional levels of behavior change as those in-school; as noted above, however, our model calibration bypasses the need to assume that the two groups have similar baseline levels. We assumed that behaviors other than contraception were changing linearly over time as this fit our data reasonably well, and for consistency with our previous work. However, this makes direct year-by-year comparisons with contraception less straightforward. Our source data did not ask explicitly about LARC prior to 2013, so we could only bound the possible effect size. To isolate the effect of LARC, we needed to assume what users would have used otherwise. Although we considered one study in which women transitioned to LARC from a wide range of methods,20 and conducted a sensitivity analysis, additional population-based studies on the methods previously used by LARC-adopting women would improve model inputs. We also considered different possible scenarios for contribution of LARC utilization before 2013 given the absence of data specific to our ages of interest in our main source study; however, the difference among scenarios was small.
We also did not explicitly consider LGBT identity, which may impact frequency of sex with the potential for pregnancy. The national YRBS did not ask about sex of partners until 2015, so we could not explicitly isolate opposite-sex contacts throughout our study period; however, our calibration process can also be considered as containing a constant multiplier for the proportion of contacts that are opposite-sex. Decreases to this value over time (i.e., increases in same-sex or other contact) represent an additional likely driver of reductions in pregnancies. Identifying the magnitude of this effect is difficult, however, since in most questions YRBS asks about “sexual intercourse” but does not define it. An increase in same-sex sexual contacts for our female respondents, with concomitant decrease in opposite-sex sexual contacts, would already be accounted for in our proximate-determinants model to the extent that respondents choose to define any same-sex or trans contacts as not intercourse. The most recent (2019) YRBS included 2.8% of female respondents reporting only same-sex contacts, and 7.8% reporting both same- and opposite-sex, which indicates that this is a substantial (and likely growing) phenomenon.
Our model aims only to parse out the proximate behavioral determinants of pregnancy and birth declines. Numerous more distal and structural factors may drive each of these, including a range of sociocultural, economic, demographic, political, psychological and medical factors. Connecting each of these to the proximate determinants we considered and identifying whether these distal factors might work through other proximate determinants that we missed and thus explain additional declines, would be useful; YRBS provides a robust dataset to aid in such efforts.
We observed that the average age at first sexual intercourse has increased, and annual number of partners in adolescents has decreased, while older adolescents have increased adoption of effective contraception, particularly LARC. Nevertheless, there remains considerable room for improvements in contraception use for sexually-active adolescents, particularly below age 18. Numerous evidence-based teen pregnancy prevention programs have been shown to be effective at reducing both the drivers of adolescent pregnancies and pregnancies themselves;39,40 these cover a range of types, including comprehensive sex education, youth development programs, and youth-friendly clinic-based programs. Programmatic support in these areas comes from a variety of sources, including the Department of Health and Human Services’ Office of Population Affairs;41 these and similar efforts should be further supported, given their successes.
LARC is likely to play a special role in reducing adolescent pregnancy, given its high effectiveness for pregnancy prevention. Focused programs to support LARC use among female adolescents have demonstrated high success,18 and expanded rates among 18-year-olds suggest that LARC is acceptable to many adolescents. However, parallel declines in condom use, combined with increasing rates of STIs nationally,42 highlight that pregnancy prevention must not be isolated from other forms of sexual health promotion. Together these suggest that it is worthwhile to continue improving access to the full range of contraceptive methods for adolescents.43,44 In addition, the large role that changes in other sexual behaviors—delays in first sex and reduced numbers of partners—had for pregnancy reductions suggests that reducing sexual activity among adolescents is also a valuable strategy to reduce teen pregnancy. The further expansion of successful multi-component strategies to reduce adolescent pregnancies is crucial to sustain this tremendous progress.
Supplementary Material
ACKNOWLEDGMENTS
This work was supported by the U.S. Centers for Disease Control and Prevention’s National Center for HIV/AIDS, Viral Hepatitis, STD, and TB Prevention [cooperative agreement U38-PS004646]. Additional support was provided by the University of Washington/Fred Hutch Center for AIDS Research, an NIH-funded program [grant number P30 AI027757]; and by a research infrastructure grant from NICHD to the UW Center for Studies in Demography and Ecology [grant number P2C HD042828]. The authors thank the members of the Coalition for Applied Modeling for Prevention (www.emorycamp.org), especially Monica Trigg and Elizabeth Rosenthal, and the members of our Public Health Advisory Group, especially those who provided feedback on this work, Dr. Thomas Bertrand and Dr. Mary Ann Chiasson.
Footnotes
Publisher's Disclaimer: This is a PDF file of an unedited manuscript that has been accepted for publication. As a service to our customers we are providing this early version of the manuscript. The manuscript will undergo copyediting, typesetting, and review of the resulting proof before it is published in its final form. Please note that during the production process errors may be discovered which could affect the content, and all legal disclaimers that apply to the journal pertain.
ROLE OF THE FUNDING SOURCE AND CONFLICTS OF INTEREST
As part of the cooperative agreement model, research scientists affiliated with the funder (the US Centers for Disease Control and Prevention) contributed to the design of the study through a series of collaborative meetings. They also approved the decision to submit the manuscript for publication, and CDC staff scientists reviewed and approved the final manuscript. Those individuals who played significant roles in the scientific development of the project are listed as co-authors. The corresponding author (Steven M. Goodreau) wrote the first draft of the manuscript. The authors report no real or perceived conflicts of interest.
DISCLAIMER
The findings and conclusions in this paper are those of the authors and do not necessarily represent the official position of the Centers for Disease Control and Prevention, the New York State Department of Health, or the National Institutes of Health.
References
- 1.Maddow-Zimet I, Kost K, Finn S. Pregnancies, births and abortions in the United States, 1973–2016: National and state trends by age. https://www.guttmacher.org/report/pregnancies-births-abortions-in-united-states-1973-2016. New York: Guttmacher Institute, 2020. [Google Scholar]
- 2.Sedgh G, Finer LB, Bankole A, et al. Adolescent pregnancy, birth, and abortion rates across countries: levels and recent trends. The Journal of adolescent health : official publication of the Society for Adolescent Medicine 2015;56:223–230. DOI: 10.1016/j.jadohealth.2014.09.007. [DOI] [PMC free article] [PubMed] [Google Scholar]
- 3.Kearney MS, Levine PB. Why is the teen birth rate in the United States so high and why does it matter? J Econ Perspect 2012;26:141–166. DOI: 10.1257/jep.26.2.141. [DOI] [PubMed] [Google Scholar]
- 4.Strayhorn JM, Strayhorn JC. Religiosity and teen birth rate in the United States. Reprod Health 2009;6:14. DOI: 10.1186/1742-4755-6-14. [DOI] [PMC free article] [PubMed] [Google Scholar]
- 5.Stanger-Hall KF, Hall DW. Abstinence-only education and teen pregnancy rates: why we need comprehensive sex education in the U.S. PLoS One 2011;6:e24658. DOI: 10.1371/journal.pone.0024658. [DOI] [PMC free article] [PubMed] [Google Scholar]
- 6.Ruedinger E, Cox JE. Adolescent childbearing: consequences and interventions. Curr Opin Pediatr 2012;24:446–452. DOI: 10.1097/MOP.0b013e3283557b89. [DOI] [PubMed] [Google Scholar]
- 7.Centers for Disease Control and Prevention. Youth Risk Behavior Survey: data summary and trends report 2007-2017. https://www.cdc.gov/healthvvouth/data/vrbs/pdf/trendsreport.pdf. Atlanta: 2018. [Google Scholar]
- 8.Szucs LE, Lowry R, Fasula AM, et al. Condom and contraceptive use among sexually active high school students - Youth Risk Behavior Survey, United States, 2019. MMWR Suppl 2020;69:11–18. DOI: 10.15585/mmwr.su6901a2. [DOI] [PMC free article] [PubMed] [Google Scholar]
- 9.Goodreau SM, Pollock ED, Wang LY, et al. Impacts of Changing Sexual Behavior on Chlamydia and Gonorrhea Burden Among US High School Students, 2007 to 2017. Sexually transmitted diseases 2021;48:635–642. DOI: 10.1097/OLQ.0000000000001390. [DOI] [PMC free article] [PubMed] [Google Scholar]
- 10.Trussell J, Aiken A, Micks E, et al. Efficacy, safety, and personal considerations. In: Hatcher R, Nelson A, Trussell J, et al. eds. Contraceptive technology, 21st edition. New York: Ayer Company Publishers, Inc., 2018. [Google Scholar]
- 11.Steiner RJ, Pazol K, Swartzendruber A, et al. Use of long-acting reversible contraception among adolescent and young adult women and receipt of sexually transmitted infection/human immunodeficiency virus-related services. The Journal of adolescent health : official publication of the Society for Adolescent Medicine 2018;62:417–423. DOI: 10.1016/j.jadohealth.2017.10.017. [DOI] [PMC free article] [PubMed] [Google Scholar]
- 12.Ingersoll T. Improving knowledge of long-acting reversible contraception in an adolescent and young adult female population. Nurs Womens Health 2021. DOI: 10.1016/j.nwh.2020.11.008. [DOI] [PubMed] [Google Scholar]
- 13.Aligne CA, Phelps R, VanScott JL, et al. Impact of the Rochester LARC Initiative on adolescents' utilization of long-acting reversible contraception. Am J Obstet Gynecol 2020;222:S890 e891–S890 e896. DOI: 10.1016/j.ajog.2020.01.029. [DOI] [PubMed] [Google Scholar]
- 14.Boulet SL, D'Angelo DV, Morrow B, et al. Contraceptive use among nonpregnant and postpartum women at risk for unintended pregnancy, and female high school students, in the context of Zika preparedness - United States, 2011-2013 and 2015. MMWR Morb Mortal Wkly Rep 2016;65:780–787. DOI: 10.15585/mmwr.mm6530e2. [DOI] [PubMed] [Google Scholar]
- 15.Lindberg L, Santelli J, Desai S. Understanding the decline in adolescent fertility in the United States, 2007-2012. The Journal of adolescent health : official publication of the Society for Adolescent Medicine 2016;59:577–583. DOI: 10.1016/j.jadohealth.2016.06.024. [DOI] [PMC free article] [PubMed] [Google Scholar]
- 16.Santelli JS, Abma J, Ventura S, et al. Can changes in sexual behaviors among high school students explain the decline in teen pregnancy rates in the 1990s? The Journal of adolescent health : official publication of the Society for Adolescent Medicine 2004;35:80–90. DOI: 10.1016/j.jadohealth.2004.05.001. [DOI] [PubMed] [Google Scholar]
- 17.Santelli JS, Lindberg LD, Finer LB, et al. Explaining recent declines in adolescent pregnancy in the United States: the contribution of abstinence and improved contraceptive use. American journal of public health 2007;97:150–156. DOI: 10.2105/AJPH.2006.089169. [DOI] [PMC free article] [PubMed] [Google Scholar]
- 18.Ricketts S, Klingler G, Schwalberg R. Game change in Colorado: widespread use of long-acting reversible contraceptives and rapid decline in births among young, low-income women. Perspect Sex Reprod Health 2014;46:125–132. DOI: 10.1363/46e1714. [DOI] [PubMed] [Google Scholar]
- 19.Centers for Disease Control and Prevention. Youth Risk Behavior Survey data. Available at: https://www.cdc.gov/yrbs, (2017, accessed November 30, 2018).
- 20.Lathrop E, Romero L, Hurst S, et al. The Zika Contraception Access Network: a feasibility programme to increase access to contraception in Puerto Rico during the 2016-17 Zika virus outbreak. The Lancet Public health 2018;3:e91–e99. DOI: 10.1016/S2468-2667(18)30001-X. [DOI] [PMC free article] [PubMed] [Google Scholar]
- 21.Hoffman SD, Maynard RA. Kids having kids: Economic costs & social consequences of teen pregnancy. Washington, D.C.: The Urban Insitute, 2008. [Google Scholar]
- 22.Bureau of Labor Statistics. Consumer price index for all urban consumers. Available at: http://www.bls.gov/cpi/data.htm. Accessed August 9, 2020.
- 23.Twenge JM, Park H. The decline in adult activities among U.S. adolescents, 1976-2016. Child Dev 2019;90:638–654. DOI: 10.1111/cdev.12930. [DOI] [PubMed] [Google Scholar]
- 24.Eaton DK, Kann L, Kinchen S, et al. Youth risk behavior surveillance--United States, 2007. Morbidity and mortality weekly report Surveillance summaries 2008;57:1–131. [PubMed] [Google Scholar]
- 25.Eaton DK, Kann L, Kinchen S, et al. Youth risk behavior surveillance - United States, 2009. Morbidity and mortality weekly report Surveillance summaries 2010;59:1–142. [PubMed] [Google Scholar]
- 26.Eaton DK, Kann L, Kinchen S, et al. Youth risk behavior surveillance - United States, 2011. Morbidity and mortality weekly report Surveillance summaries 2012;61:1–162. [PubMed] [Google Scholar]
- 27.Kann L, Kinchen S, Shanklin SL, et al. Youth risk behavior surveillance--United States, 2013. MMWR Suppl 2014;63:1–168. [PubMed] [Google Scholar]
- 28.Kann L, McManus T, Harris WA, et al. Youth Risk Behavior Surveillance - United States, 2015. Morbidity and mortality weekly report Surveillance summaries 2016;65:1–174. DOI: 10.15585/mmwr.ss6506a1. [DOI] [PubMed] [Google Scholar]
- 29.Kann L, McManus T, Harris WA, et al. Youth Risk Behavior Surveillance - United States, 2017. Morbidity and mortality weekly report Surveillance summaries 2018;67:1–114. DOI: 10.15585/mmwr.ss6708a1. [DOI] [PMC free article] [PubMed] [Google Scholar]
- 30.Tietze C Probability of pregnancy resulting from a single unprotected coitus. Fertility and Sterility 1960;11:485–488. [Google Scholar]
- 31.Wilcox AJ, Dunson DB, Weinberg CR, et al. Likelihood of conception with a single act of intercourse: providing benchmark rates for assessment of post-coital contraceptives. Contraception 2001;63:211–215. DOI: 10.1016/s0010-7824(01)00191-3. [DOI] [PubMed] [Google Scholar]
- 32.Wood JW. Dynamics of human reproduction: biology, biometry, demography. New York: Aldine de Gruyter, 1994. [Google Scholar]
- 33.Cavazos-Rehg PA, Krauss MJ, Spitznagel EL, et al. Age of sexual debut among US adolescents. Contraception 2009;80:158–162. DOI: 10.1016/j.contraception.2009.02.014. [DOI] [PMC free article] [PubMed] [Google Scholar]
- 34.Coker AL, Richter DL, Valois RF, et al. Correlates and consequences of early initiation of sexual intercourse. J Sch Health 1994;64:372–377. DOI: 10.1111/j.1746-1561.1994.tb06208.x. [DOI] [PubMed] [Google Scholar]
- 35.Harris M. Kids these days: human capital and the making of millennials. New York: Little, Brown and Company, 2017. [Google Scholar]
- 36.Finer LB, Philbin JM. Trends in ages at key reproductive transitions in the United States, 1951-2010. Womens Health Issues 2014;24:e271–279. DOI: 10.1016/j.whi.2014.02.002. [DOI] [PMC free article] [PubMed] [Google Scholar]
- 37.Twenge JM, Sherman RA, Wells BE. Sexual inactivity during young adulthood is more common among U.S. Millennials and iGen: age, period, and cohort effects on having no sexual partners after age 18. Arch Sex Behav 2017;46:433–440. DOI: 10.1007/s10508-016-0798-z. [DOI] [PubMed] [Google Scholar]
- 38.Murray Horwitz ME, Pace LE, Ross-Degnan D. Trends and Disparities in Sexual and Reproductive Health Behaviors and Service Use Among Young Adult Women (Aged 18-25 Years) in the United States, 2002-2015. American journal of public health 2018;108:S336–S343. DOI: 10.2105/AJPH.2018.304556. [DOI] [PMC free article] [PubMed] [Google Scholar]
- 39.Lugo-Gil J, Lee A, Vohra D, et al. Updated findings from the HHS teen pregnancy prevention evidence review: August 2015 through October 2016. US Department of Health and Human Services: Washington, DC, USA: 2018. [Google Scholar]
- 40.Manlove J, Fish H, Moore KA. Programs to improve adolescent sexual and reproductive health in the US: a review of the evidence. Adolescent health, medicine and therapeutics 2015;6:47–79. DOI: 10.2147/AHMT.S48054. [DOI] [PMC free article] [PubMed] [Google Scholar]
- 41.U.S. Department of Health & Human Services. About TPP, https://opa.hhs.gov/grant-programs/teen-pregnancy-prevention-program-tpp/about-tpp (2021, accessed October 19, 2021). [Google Scholar]
- 42.Centers for Disease Control and Prevention. Sexually transmitted disease surveillance 2018. https://www.cdc.gov/std/stats18/STDSurveillance2018-full-report.pdf. Atlanta: 2018. [Google Scholar]
- 43.Sherin M, Waters J. Long-acting reversible contraceptives for adolescent females: a review of current best practices. Curr Opin Pediatr 2019;31:675–682. DOI: 10.1097/MOP.0000000000000811. [DOI] [PubMed] [Google Scholar]
- 44.Apter D. Contraception options: Aspects unique to adolescent and young adult. Best Pract Res Clin Obstet Gynaecol 2018;48:115–127. DOI: 10.1016/j.bpobgyn.2017.09.010. [DOI] [PubMed] [Google Scholar]
Associated Data
This section collects any data citations, data availability statements, or supplementary materials included in this article.