

Abstract
Differences in the ability of neutrophils to perform relevant effector functions has been identified in a variety of disease states. Although neutrophil functional heterogeneity is increasingly recognized during disease, few studies have examined neutrophil functional heterogeneity during periods of health. In this study, we systematically characterize neutrophil functional heterogeneity in a cohort of healthy human subjects using a range of biologically relevant agonists including immune complexes, bacterial ligands, and pathogens. With repeated testing over several years, we show that neutrophil functional capability represents a fixed phenotype for each individual. This neutrophil phenotype is preserved across a range of agonists and extends to a variety of effector functions including degranulation, neutrophil extracellular trap release, reactive oxygen species generation, phagocytosis, and bacterial killing. Using well phenotyped healthy human subjects, we demonstrate that neutrophil functional heterogeneity is characterized by differences in neutrophil gene expression patterns. Altogether, our findings demonstrate that while neutrophil function is highly heterogeneous among healthy subjects, each individual’s functional capability represents a fixed phenotype defined by a distinct neutrophil gene expression profile. These findings may be relevant during disease states where the ability to perform relevant neutrophil effector functions may impact disease course and/or clinical outcome.
Keywords: degranulation, phagocytosis, neutrophil extracellular trap
Summary Sentence:
Differences in neutrophil functional capacity represent a fixed phenotype and are defined by distinct neutrophil gene expression profiles.
Introduction
As effectors of innate immunity, neutrophils contribute to host defense through a variety of cellular mechanisms including release of cytotoxic and procoagulant granular enzymes, neutrophil extracellular traps (NETs), and reactive oxygen species (ROS). It is increasingly recognized that individual differences in gene expression patterns and the ability to perform relevant neutrophil effector functions contribute to disease course and/or outcome. For example, studies examining transcriptional profiles of circulating neutrophils in patients with sepsis have shown that differences in neutrophil gene expression correlate with sepsis severity,1 development of acute respiratory distress syndrome (ARDS),2 and clinical outcomes including need for mechanical ventilation, intensive care unit-length of stay, and mortality.3 In these studies, differences in neutrophil gene expression correlated with different functional capacity involving phagocytosis1 and cytokine production.3 Similarly, in a recent study examining patients with COVID-19, distinct transcriptional signatures characterized by upregulation of genes involved in NET release, chemotaxis, and adhesion was predictive of disease severity.4 In another study, Schulte-Schrepping et al performed functional analysis of neutrophils from patients with COVID-19 and found that severe COVID-19 was characterized by immature and dysregulated neutrophils with impaired ability to produce ROS in response to Escherichia coli and phorbol 12-myristate 13-acetate (PMA).5
Although evidence suggests that neutrophil functional heterogeneity exists in disease and contributes to clinical outcome, much less has been reported on functional heterogeneity during steady state in healthy human subjects. In prior work from our laboratory6 and others,7 we have shown that healthy subjects have variable degranulation responses to antigen/antibody immune complexes (ICs), resulting in a broad range of neutrophil reactivity. These responses are fixed and represent a phenotype for each individual. In prior work centered around heparin-dependent immune complexes,6 we showed striking differences in neutrophil degranulation responses among healthy subjects, where some subjects degranulate robustly in response to ICs, while others degranulate minimally. In these prior studies,6 we found that the extent of neutrophil reactivity did not correlate with polymorphisms in neutrophil Fc receptors, or CR1, CR3, and Fc receptor expression on neutrophils, suggesting that the observed phenotype may not be restricted to immune complex/neutrophil interactions.
In this current study, we use a range of biologically relevant agonists to demonstrate that neutrophil heterogeneity is not restricted to ICs. Instead, we showed that neutrophil phenotypes are preserved across a range of agonists and pathogens and result in differential ability to perform an array of functions including degranulation, NET release, ROS generation, phagocytosis, and bacterial killing. Using phenotyped healthy human subjects, we also demonstrate that the neutrophil phenotype is characterized by differences in neutrophil gene expression.
Materials and Methods
Materials
PMA, N-Formyl-Met-Leu-Phe (fMLF), lipopolysaccharide (LPS), and calcium ionophore A23187 were purchased from Sigma (St. Louis, MO), and unfractionated heparin was purchased from Fresenius Kabi (Lake Zurich, IL). As previously described, KKO, a mouse monoclonal IgG2bκ antibody to PF4/heparin and recombinant PF4 were isolated.8,9
Neutrophil isolation
With institutional approval and written informed consent (Duke IRB#Pro00094580), whole blood from healthy subjects was collected in acid-citrate-dextrose (ACD) and used within 1 hour of collection. Healthy subjects deny any history of chronic disease including autoimmune disease and are free from infection at the time of blood sampling. Following published protocols,10 neutrophils were isolated using Ficoll-Paque (GE Healthcare; Uppsala, Sweden) followed by dextran sedimentation. Cells were resuspended in Hanks’ Balanced Salt Solution (HBSS) with calcium and magnesium and used immediately after isolation. Cell purity was >95% as determined by morphological examination of Wright-stained slides, and viability was >95% as determined by trypan blue.
Pathogen strains and growth conditions
Staphylococcus aureus USA300 (UAMS 1182), E. coli (DH5-alpha), and Candida albicans (SC5314) were selected as model pathogens. Overnight cultures of S. aureus and E. coli were diluted in in Trypticase Soy Broth and Luria-Bertani, respectively, and grown at 37°C at 225 rpm to log phase (OD600=0.6). Overnight cultures of C. albicans were diluted in YPD media and grown at 30°C at 225 rpm to OD600=0.6. Following centrifugation (10,000g, 1 min), microbial pellets were rinsed twice with phosphate-buffered saline (PBS) and then diluted in PBS to a concentration of 1.3×10⁷ CFU/mL.
MMP-9 degranulation assay
As we have previously described,6 to quantify degranulation, whole blood (100 µL) or isolated neutrophils (2×10⁵) were incubated with specified agonists at 37°C for varying amounts of time (30–120 minutes). After incubation, plasma or supernatant was removed and released matrix metallopeptidase 9 (MMP9) was quantified by enzyme-linked immunosorbent assay (ELISA, R&D Systems, Minneapolis, MN).
Reactive oxygen species assay
Following published protocols,10 neutrophils resuspended in HBSS containing Ca2+/Mg2+, were incubated with 2’7’dichlorofluorescin diacetate (DCFH-DA; Sigma, final concentration of 10 µM) for 20 minutes at 37°C on a gentle rotator in the dark. After incubation, 2×10⁵ neutrophils were added to each well of a 96-well cell culture microplate (Greiner BioOne; Monroe, NC). After addition of buffer or PMA (500 nM), fluorescence was immediately read at 1-minute intervals for a total of 10 minutes at 485/570 nm using the FLUOstar OPTIMA microplate reader (BMG LABTECH, Ortenberg, Germany).
NET immunoassays
To quantify NETosis, release of myeloperoxidase-DNA (MPO-DNA) complexes and elastase was measured by ELISA, as they are established markers for NETs.11,12 Briefly, following published protocols,13 MPO-DNA complexes were measured by coating microtiter plates with mouse anti-human MPO antibody (BioRad, Hercules, CA) overnight at 4°C. After blocking with 1% BSA overnight at 4°C, samples were added at 1:50 along with the MPO-DNA immunoreagent provided in the Cell Death Detection Kit from Roche (Basel, Switzerland). After incubation for 2 hours, anti-DNA-POD detection antibody from the Cell Death Detection Kit was added, and the plate was incubated for 2 hours at room temperature. After addition of ABTS reagents, color development was measured at 405 nm using the Spectramax 384 PLUS (Molecular Devices, Sunnyvale, CA) and analyzed using SoftMax PRO software (Molecular Devices). Elastase was measured using a commercial human neutrophil ELISA kit (R&D Systems).
Phagocytosis assay
Following manufacturer recommendations, pHrodo Red S. aureus BioParticles Conjugate (Invitrogen, Waltham, MA) was resuspended in Live Cell Imaging Solution (Invitrogen) and added to 1×10⁵ neutrophils in microtiter plates (Greiner Bio-One). Fluorescence was measured at 560/585 nm using the FlUOstar OPTIMA microplate reader at 5-minute intervals over 60-minutes.
Immunofluorescence microscopy
Neutrophils (1×10⁵) were incubated with buffer, PMA (500 nM), or pHrodo Red S. aureus BioParticles Conjugate for 1–3 hours at 37°C, depending on experimental conditions. After incubation, coverslips were fixed with 2% paraformaldehyde. After washing, neutrophils were stained with ant-CD66b APC (1:100; ebioscience, San Diego, CA) overnight at 4°C. Following this, coverslips were stained with DAPI (1:20,000; Invitrogen), mounted using Prolong Gold Antifade Reagent (Invitrogen), and then imaged with a Zeiss Axio Imager Z2 upright microscope (Jena, Germany).
Bacterial kill assay
S. aureus was prepared as described above to obtain a concentration of 1.3×10⁷ CFU/mL. Freshly isolated whole blood (200 µL) was added to 20 µL of S. aureus in a 96-well plate and incubated at 37°C. Individual samples were collected at designated time points, serially diluted in sterile water, and plated on agar for enumeration of bacterial colonies.
RNA isolation and sequencing
Total RNA was extracted from 107 neutrophils using the NucleoSpin RNA Plus Mini Kit according to manufacturer’s directions (Macherey-Nagel, Duren, Germany). RNA was quantified and quality was assessed using the Qubit (Thermo Fisher, Waltham, MA) and the Agilent 2100 Bioanalyzer (Agilent, Santa Clara, CA). Sequencing libraries were prepared for each sample using the Kapa Stranded mRNA-Seq Library Prep Kit followed by sequencing on the Illumina NovaSeq 6000 (Illumina, San Diego, CA) with a 50bp single end reads length. Library construction, RNA sequencing, and bioinformatic analysis was completed by the Duke University School of Medicine Sequencing and Genomic Technologies Shared Resource. RNA-seq data was processed using the Trim Galore toolkit14 to trim low-quality bases and Illumina sequencing adapters from the 3’ end of the reads. Reads were mapped to the GRCh38v93 version of the human genome and transcriptome using the STAR RNA-Seq alignment tool.15 Reads were kept for subsequent analysis if they mapped to a single genomic location. Gene counts were compiled using the HT-Seq algorithm.16 Only genes that had at least 10 reads in a single sample were kept for analysis. Normalization and differential expression analysis was carried out using the DESeq217 Bioconductor18 package within the R statistical programming environment. The false discovery rate was used to correct for multiple hypothesis testing.
Statistical analysis
All data are expressed as mean ± standard deviation and were done in triplicate wells. Correlations of MMP-9 release was examined with Spearman’s correlation coefficient for continuous variables or analysis of variance (ANOVA) for categorical variables. Differences during time course experiments were determined using repeated measures ANOVA. Differences in NET release and phagocytic index were analyzed using the Student t test. Overall differences in S. aureus survival were determined using the Kaplan Meier survival method and validated with the log-rank test. Analyses were performed using Prism version 9.1.0 (Graphpad Software, La Jolla, CA) and R Core Team 2020 (Vienna, Austria). Results are reported using a 2-sided P<0.05 to indicate statistical significance. All results are representative of experiments using at least 3 previously phenotyped “high” subjects and 3 previously phenotyped “low” subjects.
Data Sharing Statement
The RNA-Seq data in this study is available on Gene Expression Omnibus (GEO) under accession #GSE197823.
Results
Healthy subjects have a fixed degranulation response to ICs, constituting a neutrophil phenotype
In previous work, we used a range of ICs to demonstrate that healthy subjects have variable, but fixed degranulation rseponses.6 In these prior studies, we developed a screening assay to determine degranulation phenotypes using ICs consisting of KKO-PF4/heparin and by quantifying MMP-9 release, representative of tertiary granules.6 In an expanded cohort of 184 healthy subjects, we confirm that healthy subjects have highly variable degranulation responses (Figure 1A, range of MMP9 release = 32.2 −1279.6 ng/mL, demographics shown in Table I). After dividing our cohort into quartiles,6 we focused on individuals at either extreme of reactivity (Figure 1A: subjects designated as “high” in blue (MMP-9 > 584 ng/mL, >Q3) and “low” in red (MMP-9 < 225 ng/mL, <Q1). With repeated, longitudinal testing over more than 3 years, we now demonstrate that degranulation responses to ICs are fixed. As seen in Figure 1B, “high” subjects consistently show robust degranulation in response to ICs while “low” subjects consistently show minimal degranulation. Together, these expanded studies demonstrate that while highly variable, degranulation responses to ICs in healthy subjects are stable over time, constituting a fixed phenotype for each individual.
Figure 1: Neutrophil degranulation responses to ICs are variable and constitute a fixed phenotype.

A) MMP-9 release in response to KKO-PF4/heparin ICs. Whole blood from healthy subjects (n=184) was incubated with buffer, PF4 (25 ug/mL) + heparin (1 u/mL), or KKO/isotype (25 ug/mL + PF4 (25 ug/mL) + heparin (1 u/mL). After 30-minute incubation, MMP-9 released into plasma was measured by ELISA. B) Degranulation responses are fixed over time. Degranulation responses to KKO-PF4/heparin were repeatedly assessed in 3 “low” (red) and 3 “high” (blue) subjects over the course of more than 3 years.
Table I:
Healthy human subject demographics (n=184)
| Age | 37.8 (18–68) |
| Sex | |
| Male | 64 (34.8%) |
| Female | 120 (65.2%) |
| Race | |
| White | 106 (57.6%) |
| Black | 25 (13.6%) |
| Asian | 31 (16.8%) |
| Other | 25 (12%) |
Neutrophil phenotype is retained across a spectrum of agonists and is determined at the cellular level
Our prior studies demonstrated that degranulation responses are not correlated with variations in Fc or complement receptors, raising the possibility that responses may not be specific to ICs.6 To determine if susceptibility to neutrophil degranulation is applicable to other agonists besides ICs, we compared degranulation responses to KKO-PF4/heparin ICs to a variety of secretagogues including PMA (500 nM), fMLF (1 µM), LPS (100 ng/mL), or calcium ionophore (1mM). As shown in Figure 2A, the amount of MMP-9 released in response to KKO-PF4/heparin ICs is highly correlated with degranulation responses to PMA, fMLF, and LPS (PMA: r=0.61, p<0.0001; fMLF: r=0.81, p<0.0001; LPS: r=0.68, p=0.0002). In contrast, the amount of MMP-9 released in response to KKO-PF4/heparin ICs was not correlated with degranulation responses to calcium ionophore (r=0.002, p=0.99) which triggers neutrophil activation through a direct influx of intracellular calcium and does not engage cell surface receptors.19
Figure 2: Degranulation responses to KKO-PF4/heparin ICs is highly correlated with responses to other neutrophil agonists and is determined at the cellular level.

A) Degranulation responses are preserved across a range of agonists. Whole blood from healthy subjects was incubated with KKO (25 µg/mL), PF4 (25 µg/mL), and heparin (1 U/mL) or with (A) PMA (500 nM), (B) fMLF (1 µM), (C) LPS (100 ng/mL), or (D) calcium ionophore (1mM). MMP-9 released in response to these agonists is plotted as a function of KKO-PF4/heparin IC-induced MMP-9 release. B) Susceptibility to neutrophil activation is determined at the cellular level. Neutrophils were isolated from 5 high (blue) and 5 low (red) subjects. 2×10⁵ neutrophils were incubated with buffer, PMA (500 nM), KKO or IgG2b isotype (25 µg/mL) along with PF4 (25 µg/mL) and heparin (1 U/mL)), fMLF (1uM), or LPS (100 ng/mL). After 30 minutes, MMP9 release was measured in supernatant. *p<0.05, **p<0.01, ***p<0.001
To date, our neutrophil degranulation assays have been performed in whole blood.6 To determine if the phenotype is retained at the cellular level, neutrophils were isolated from healthy subjects who had been identified with “high” and “low” reactivity in response to KKO-PF4/heparin ICs (n=5/phenotype). As shown in Figure 2B, neutrophils isolated from healthy subjects at either extreme of reactivity retained the degranulation phenotype. Neutrophils isolated from “high” subjects demonstrated robust degranulation in response to PMA, KKO-PF4/heparin ICs, fMLF, and LPS when compared to neutrophils isolated from “low” subjects. Together, these studies demonstrate that an individual’s susceptibility to neutrophil degranulation is not restricted to IC responses. Instead, an individual’s phenotype is retained across a wide range of stimuli and is determined at the cellular level.
The neutrophil phenotype is preserved across a range of pathogens
As neutrophils are the first line of defense against pathogens, we next examined neutrophil responses to microorganisms in “high” and “low” donors. For this, we chose S. aureus, E. coli, and C. albicans as model pathogens for gram-positive bacteria, gram-negative bacteria, and fungi, respectively. As seen in Figure 3, the neutrophil degranulation phenotype was preserved when whole blood from phenotyped subjects (n=3/phenotype) was incubated with pathogen-derived supernatant (Figure 3A) or the pathogen itself (Figure 3B). “High” subjects exhibited more robust degranulation in response to S. aureus, E. coli, and C. albicans when compared to “low” subjects. No degranulation was seen with growth media alone (Figure 3A, in gray). These results demonstrate that the degranulation phenotype is preserved in response to a range of microorganisms.
Figure 3: Neutrophil activation phenotype is preserved in response to bacterial products and bacteria.
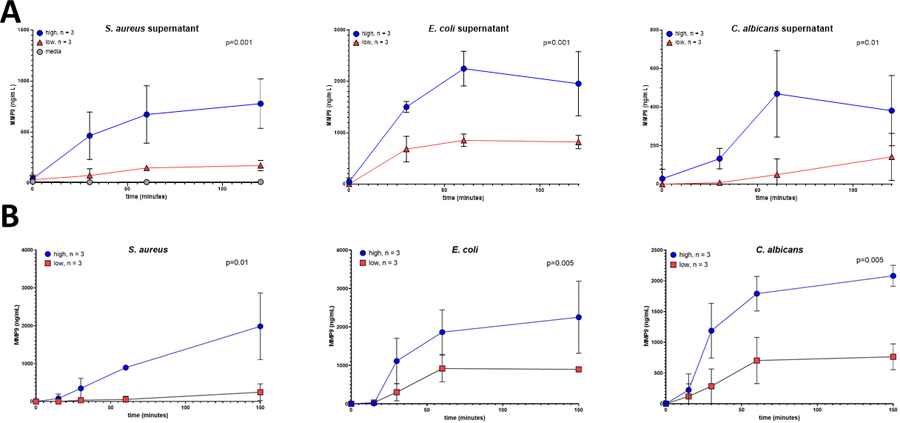
Whole blood from healthy subjects who had been previously phenotyped (“high” degranulation responses in blue and “low” degranulation responses in red, n=3 for each cohort) was incubated for varying amounts of time (0–150 minutes) with (A) supernatant from S. aureus, E. coli, C. albicans, or growth media alone (1:10 dilution) or with B) respective pathogen. After incubation, released MMP-9 was measured. Results are expressed as mean ± standard deviation.
The neutrophil phenotype translates into differences in ROS generation
Thus far, our studies have focused on neutrophil degranulation responses.6 To determine if the phenotype extends to other effector functions, we first examined reactive oxygen species (ROS) generation, an important antimicrobial activity of neutrophils.20 To quantify ROS, neutrophils from phenotyped subjects (n=3/phenotype) were first incubated with DCFH-DA (10 µM), a cell-permeable non-fluorescent probe which is de-esterified intracellularly and fluoresces upon oxidation.10 As shown in Figure 4A, neutrophils from “high” subjects demonstrated more rapid and robust ROS generation in response to PMA (500 nM) when compared to neutrophils isolated from “low” subjects (p=0.021). As well, differences in ROS generation were preserved in response to the more clinically relevant S. aureus strain, USA300 (MOI 5:1, Figure 4B, p=0.023). These results demonstrate that the neutrophil phenotype results in differences beyond degranulation and translates into differences in respiratory burst.
Figure 4: The neutrophil phenotype translates into differences in ROS generation.

Following incubation with DCFH-DA (10 µM), 2×10⁵ neutrophils were loaded into wells of a microtiter plate. Immediately after addition of buffer or PMA (500 nM, Panel A) or vehicle or USA300 (MOI 5:1, Panel B), fluorescence was measured at one-minute intervals using an excitation wavelength of 317 nm and emission wavelength of 400 nm. Results are plotted as experimental wells – buffer/vehicle wells. Aggregate results of high and low subjects are depicted as mean ± standard deviation. *p< 0.05, **p<0.01.
The neutrophil phenotype correlates with susceptibility to NET release
In addition to the release of granules and ROS, the release of NETs, an extracellular lattice composed of chromatin and anti-microbial granular contents, also contributes to host defense by immobilizing and killing pathogens.21 To determine if the neutrophil phenotype extends to differences in NETosis, we quantified the release of NET components in response to PMA in “high” and “low” subjects (n=3/phenotype). As shown in Figure 5, neutrophils from “high” subjects released more MPO-DNA (Figure 5A, p = 0.001) and elastase (Figure 5B, p = 0.03) in response to PMA, when compared to “low” subjects. Consistent with these findings, visualization of neutrophils after stimulation with PMA revealed that “high” subjects had more evidence of nuclear condensation and extracellular DNA, both characteristic of NET release (Figure 5C).12 Together, these findings demonstrate that the neutrophil functional phenotype reflects differences in ability to release granules, ROS, and NET components.
Figure 5: The neutrophil phenotype results in differences in release of NET components.

A) MPO-DNA. 2×10⁵ neutrophils were incubated with buffer or PMA (500 nM) for 3 hours at 37°C. Following centrifugation, MPO-DNA released into supernatant was measured by ELISA. Results for 4 “low” subjects (red) and 5 “high” subjects (blue) are shown and normalized by subtracting basal MPO-DNA levels for each individual after incubation with buffer from experimental wells performed in triplicate after incubation with PMA. B) Elastase. Whole blood from 3 “low” and 3 “high” subjects was incubated with PMA for 3 hours at 37°C and amount of elastase released into plasma was measured by ELISA. C) Immunofluorescence microscopy. 2×10⁵ neutrophils were incubated with PMA for 3 hours at 37°C, fixed with 2% PFA, and stained with DAPI. Scale bars, 20 µm. Representative images from 2 “high” and 2 “low” subjects are shown. *p<0.05, ***p<0.001
The neutrophil phenotype results in differences in phagocytosis and bacterial killing
Although our prior studies have focused on exocytic neutrophil functions, efficient uptake of pathogens via phagocytosis is also necessary for host defense.22 To determine if the neutrophil phenotype is correlated with phagocytic activity, the ability to ingest BioParticles conjugated with S. aureus was investigated. As shown in Figure 6A, neutrophils isolated from “high” subjects showed decreased ability to phagocytose when compared to neutrophils isolated from “low” subjects (n=3/phenotype). Direct visualization of neutrophils incubated with S. aureus BioParticles revealed that a higher percentage of neutrophils from “low subjects” had ingested S. aureus when compared to neutrophils from “high” subjects (83.51% ± 3.87 neutrophils ingesting vs. 60.03% ± 3.77, p = 0.002 respectively; Figure 6B and representative images in Figure 6C). To determine if these differences in phagocytic capacity resulted in differences in bacterial killing, whole blood from phenotyped subjects was incubated with S. aureus (n=4/phenotype). As shown in Figure 6D, consistent with phagocytosis results, “high” subjects had overall decreased ability to kill bacteria (p<0.00001) with more viable S. aureus colonies seen after 60 minutes incubation. These results indicate that while “high” subjects have more robust exocytic activity, releasing more extracellular granules, ROS, and NET components, they are less efficient at phagocytosis and bacterial killing.
Figure 6: Neutrophil phenotype is correlated with differences in bacterial phagocytosis.

A) Phagocytosis of bioparticles conjugated with S. aureus. Following isolation, 1×10⁵ neutrophils from 3 high (blue) and 3 low (red) subjects were incubated with pHrodo S. aureus BioParticles and fluorescence was measured at 5-minute intervals for a total of 60 minutes. Following manufacturer recommendations, net phagocytosis was calculated by subtracting the average fluorescence of the no-cell/bioparticle only negative control wells from the experimental wells at each time point. B) Phagocytic index. After one-hour incubation, 1×10⁵ neutrophils which had been incubated with S. aureus BioParticles were fixed with 2% PFA and then imaged with immunofluorescence microscopy. Phagocytic index was quantified after visualization of at least 5 random, non-overlapping fields and calculated as percentage of neutrophils containing intracellular BioParticles. C) Immunofluorescence microscopy. After fixation, slides were stained with DAPI (blue) and CD66b (green). pHrodo Red S. aureus BioParicles are seen in red. Scale bars, 10 µm. Representative image from a high (n=3) and low donor (n=3) are shown. D) Bacterial killing. 20 uL of S. aureus (diluted to 1.3×10⁷ CFU/mL) was incubated with whole blood (200 uL) in a 96 well plate at 37°C. Samples were collected at designated time points (0, 15, 30, 60 minutes), serially diluted in sterile water, and plated on agar for enumeration of bacterial colonies.
The neutrophil phenotype is characterized by differential gene expression.
To define mechanisms underlying these differences in functional capacity, we performed RNA sequencing on unstimulated neutrophils isolated from phenotyped subjects (n=4 “low” subjects and n=3 “high” subjects). As shown in Figure 7A, in our transcriptomic dataset of over 17,000 genes, only 12 genes were found to be differentially expressed. Three of the 12 genes were non-coding (LINC00189, MTCO2P12, and MAPK8IP1P2). Of the remaining 9 coding genes, 2 of the 9 were upregulated in our “low” subjects including the inhibitory myeloid cell surface receptor CLEC12A23 and the signaling protein PLCL1 which inhibits integrin activation.24,25 The remaining 7 genes were upregulated in our “high” subjects and included genes encoding host defense peptides, transporters, and transcription factors (Figure 7B).
Figure 7: Neutrophil phenotype is characterized by differential gene expression.

RNA was extracted from 107 neutrophils from 4 “low” and 3 “high” subjects for RNA sequencing. A) Heatmap. Differentially expressed genes (FDR corrected p-value<= 0.05) are shown for each sample. Normalized gene expression has been z-score transformed and the samples and genes are clustered by correlation distance with complete linkage. B). Table of the differentially expressed genes.
Discussion
Neutrophils are critical effector cells in many infectious and non-infectious disease processes. There is increasing evidence that heterogeneity in neutrophil functional capacity is associated with disease severity and clinical outcomes. Our study is the first to systematically evaluate neutrophil functional heterogeneity in healthy individuals and to determine if responses are conserved after exposure to specific agonists and across multiple neutrophil effector functions.
Other studies have demonstrated differences in neutrophil function among healthy subjects. For example, a prior study of 33 healthy subjects reported that neutrophils from women have increased oxidative burst activity after exposure to calcium ionophore compared to neutrophils from men.26 And in a study of 50 healthy, white subjects by van Mirre et al, neutrophil degranulation was found to be highly variable in response to dimeric or aggregated IgG.7 van Mirre et al reported individual responses were correlated with the mRNA ratio of FcγRIIA:FcγRIIb2 of each subject, and over the course of 2–12 months, the authors repeated quantification of mRNA ratios in a subset of their subjects (n=10) and found that the FcγRIIA:FcγRIIb2 ratio did not fluctuate for any given individual, suggesting that degranulation responses are fixed over time. In keeping with these prior studies, previous work from our laboratory examining 71 healthy subjects also confirmed that susceptibility to neutrophil degranulation in response to ICs is a fixed characteristic.6 However, in our study, degranulation responses were not associated with Fcγ receptor variants.6 Finally, in a study from The Milieu Intérieur Consortium, non-genetic factors such as sex, age, and latent infection with cytomegalovirus (CMV) were found to be associated with various parameters of human innate and adaptive immune cells.27 However, in our cohort of healthy subjects, sex, age, body mass index, and CMV seropositivity do not correlate with neutrophil phenotype (Supplemental Figure 2). Together, these prior studies, although limited and variable in terms of the specific neutrophil agonist studied, sample size, and diversity of the study cohort, suggest that although neutrophil function is highly heterogenous among healthy subjects, functional responses represent a phenotype for any given individual. Now, in an expanded cohort of healthy subjects (n=184), we confirm and extend these prior findings and demonstrate that among healthy individuals, there is significant variability in neutrophil degranulation responses. These studies were performed in an ethnically diverse cohort (Supplemental Table I) and were consistent over a three-year period (Figure 1B), suggesting that individuals have a fixed degranulation phenotype. Furthermore, we demonstrate that variability in degranulation responses is not restricted to a single stimulant but is actually conserved in response to a range of agonists including immune complexes, bacterial ligands, and an array of pathogens (Figure 2 and Figure 3).
In addition, we demonstrate that the neutrophil phenotype is not restricted to degranulation. Instead, differences in neutrophil functional capacity are preserved across an array of effector functions including degranulation, oxidative burst, NET release, and phagocytosis. These findings raise the possibility that the neutrophil phenotype may be relevant in a broad range of disease settings where the ability to perform specific effector functions may directly impact clinical outcome. In fact, several recent studies have reported that both enhanced and diminished neutrophil functional capacity is associated with disease severity. For example, several autoimmune diseases, including systemic lupus erythematosus (SLE) and rheumatoid arthritis, are characterized by hyperactive neutrophils.28–30 In these disorders, enhanced NET formation and/or impaired degradation and persistence of NETs has been correlated with disease severity.28,31 In contrast, in other diseases, poor clinical outcomes have been associated with reduced neutrophil function. Neutrophils with impaired phagocytic activity have been found in patients with severe sepsis,32 possibly resulting in impaired ability to eradicate infection. Similarly, in a recent COVID-19-centered study, disease severity was correlated with the presence of neutrophils with reduced oxidative burst.5 Taken together, these studies suggest that, depending on the clinical scenario, it may be detrimental to have enhanced or reduced ability to perform specific neutrophil effector functions. Future prospective studies will be required to determine whether the differences in functional capacity we have characterized during health persist during disease, and if the observed phenotype is clinically relevant and impacts disease outcome.
As a first step to identify determinants of the neutrophil phenotype, RNA sequencing was performed on neutrophils isolated from phenotyped healthy subjects. We found that the functional differences which define our phenotype are characterized by well-defined neutrophil gene expression profiles (Figure 7). Certainly, the genes which distinguish our cohorts have been implicated in disease. However, to our knowledge, this finding that neutrophil functional heterogeneity in healthy subjects is possibly determined at the gene expression level has not been previously reported. For example, recent studies of neutrophils from patients with COVID-19 have identified increased expression of DEFA3,5 DEFA4,5 and LCN25,33 (as seen in our “high” subjects) as predictors of severe disease. These proteins are important effectors of innate immunity and are stored within neutrophil granule compartments (defensins within primary/azurophilic and lipocalin 2 within secondary/specific granules).34 Reports of increased expression of these neutrophil activation markers in COVID-19 supports the concept that dysregulated neutrophil activity plays a critical role in disease complications such as acute respiratory distress syndrome and immunothrombosis.35 Similarly, in our study, “low” subjects had increased expression of PLCL1 and CLEC12A, both of which encode for inhibitory proteins involved in integrin activity25 and cellular activation.36 These inhibitory markers have also been associated with clinical outcomes. For example, increased neutrophil expression of CLEC12A has been associated with reduced disease activity in rheumatoid arthritis, likely due to inhibition of neutrophil responsiveness and pro-inflammatory activity.36 Notably, unlike these prior studies, our work focuses entirely on healthy subjects. However, our findings are consistent with studies performed during periods of active disease and raise the possibility that expression of these neutrophil molecular markers in health may predict for clinical course during relevant disease states. Determining this will require prospective study.
At this time, it remains unclear what accounts for our findings. Instead, it is possible that there is a natural distribution of functional capability within each person’s neutrophil pool, and the phenotype represents skewing of cells with enhanced/diminished functional capacity. This hypothesis is supported by the knowledge that neutrophils within one individual are not functionally homogenous. A prior study by Hellebrekers, et al. demonstrated that there is a spectrum of phagocytic capacity within a single individual’s circulating neutrophil pool with some neutrophils having an intrinsically higher capacity to phagocytes bacteria compared to others.37 Importantly, in this study, neutrophils with higher phagocytic capacity lacked distinctive cell surface markers and were indistinguishable from neutrophils with poor phagocytic capacity in the context of surface marker expression.37 Whether the neutrophil phenotype we have described is due to differences in the distribution of functionally defined neutrophils requires further study. Interestingly, some of the genes found to be overly expressed in “high” subjects, such as DEFA3, DEFA4, and LCN2 are correlated with the presence of immature neutrophil precursors.5 However, our subjects are all healthy with no evidence of active infection or inflammation, and C-reactive protein levels measured in a random subset of our donors (n=15) did not correlate with degranulation responses (Supplemental Figure 1). It is unclear whether increased expression of these genes, as seen in our “high” subjects, indicates the presence of less mature neutrophils or skewing of neutrophil subsets, and further characterization of neutrophil subpopulations among phenotyped subjects are currently underway.
In summary, we report that healthy subjects have neutrophils with significant functional heterogeneity which represents a fixed phenotype for a given individual. Furthermore, these functional phenotypes are characterized by distinct neutrophil gene expression profiles. Together, our findings not only confirm the increasing evidence that neutrophils are not functionally homogenous, but they also raise the possibility that innate differences in neutrophil functional capacity may contribute to clinical outcomes.
Supplementary Material
Acknowledgements
Support was provided by the National Institutes of Health, National Institute of Allergy and Infectious Diseases grant R21 AI156143–02 (GML).
The authors acknowledge the Duke Center for Genomic and Computational Biology for assistance with the generation of RNA Sequencing data and analysis. The authors also acknowledge the Duke Light Microscopy Core Facility for providing microscopy support.
Abbreviation Page
- DCFH-DA
2’7’dichlorofluorescin diacetate
- ACD
acid-citrate-dextrose
- ARDS
acute respiratory distress syndrome
- ANOVA
analysis of variance
- ELISA
enzyme-linked immunosorbent assay
- HBSS
Hanks’ Balanced Salt Solution
- ICs
immune complexes
- LPS
lipopolysaccharide
- MMP9
matrix metallopeptidase 9
- MPO-DNA
myeloperoxidase-DNA
- fMLF
N-Formyl-Met-Leu-Phe
- NETs
neutrophil extracellular traps
- PMA
phorbol 12-myristate 13-acetate
- ROS
reactive oxygen species
- SLE
systemic lupus erythematosus
Footnotes
Conflict of Interest Disclosure
GMA has an awarded patient for KKO (US Application NO 60/143,536); GMA and SK have pending intellectual property applications.
References
- 1.Meghraoui-Kheddar A, Chousterman BG, Guillou N, et al. Two New Neutrophil Subsets Define a Discriminating Sepsis Signature. Am J Respir Crit Care Med 2021. DOI: 10.1164/rccm.202104-1027OC. [DOI] [PMC free article] [PubMed]
- 2.Kangelaris KN, Prakash A, Liu KD, et al. Increased expression of neutrophil-related genes in patients with early sepsis-induced ARDS. Am J Physiol Lung Cell Mol Physiol 2015;308(11):L1102–13. DOI: 10.1152/ajplung.00380.2014. [DOI] [PMC free article] [PubMed] [Google Scholar]
- 3.Nick JA, Caceres SM, Kret JE, et al. Extremes of Interferon-Stimulated Gene Expression Associate with Worse Outcomes in the Acute Respiratory Distress Syndrome. PLoS One 2016;11(9):e0162490. DOI: 10.1371/journal.pone.0162490. [DOI] [PMC free article] [PubMed] [Google Scholar]
- 4.Wilk AJ, Lee MJ, Wei B, et al. Multi-omic profiling reveals widespread dysregulation of innate immunity and hematopoiesis in COVID-19. J Exp Med 2021;218(8). DOI: 10.1084/jem.20210582. [DOI] [PMC free article] [PubMed] [Google Scholar]
- 5.Schulte-Schrepping J, Reusch N, Paclik D, et al. Severe COVID-19 Is Marked by a Dysregulated Myeloid Cell Compartment. Cell 2020;182(6):1419–1440 e23. DOI: 10.1016/j.cell.2020.08.001. [DOI] [PMC free article] [PubMed] [Google Scholar]
- 6.Duarte M, Kuchibhatla M, Khandelwal S, Arepally GM, Lee GM. Heterogeneity in neutrophil responses to immune complexes. Blood Adv 2019;3(19):2778–2789. DOI: 10.1182/bloodadvances.2019000235. [DOI] [PMC free article] [PubMed] [Google Scholar]
- 7.van Mirre E, Breunis WB, Geissler J, et al. Neutrophil responsiveness to IgG, as determined by fixed ratios of mRNA levels for activating and inhibitory FcgammaRII (CD32), is stable over time and unaffected by cytokines. Blood 2006;108(2):584–90. DOI: 10.1182/blood-2005-12-4997. [DOI] [PubMed] [Google Scholar]
- 8.Arepally GM, Kamei S, Park KS, et al. Characterization of a murine monoclonal antibody that mimics heparin-induced thrombocytopenia antibodies. Blood 2000;95(5):1533–40. (https://www.ncbi.nlm.nih.gov/pubmed/10688805). [PubMed] [Google Scholar]
- 9.Rauova L, Hirsch JD, Greene TK, et al. Monocyte-bound PF4 in the pathogenesis of heparin-induced thrombocytopenia. Blood 2010;116(23):5021–31. DOI: 10.1182/blood-2010-03-276964. [DOI] [PMC free article] [PubMed] [Google Scholar]
- 10.Quinn MT, Deleo F. Neutrophil methods and protocols Second edition. ed. New York: Humana Press, 2014. [Google Scholar]
- 11.Borissoff JI, Joosen IA, Versteylen MO, et al. Elevated levels of circulating DNA and chromatin are independently associated with severe coronary atherosclerosis and a prothrombotic state. Arterioscler Thromb Vasc Biol 2013;33(8):2032–2040. DOI: 10.1161/ATVBAHA.113.301627. [DOI] [PMC free article] [PubMed] [Google Scholar]
- 12.Perdomo J, Leung HHL, Ahmadi Z, et al. Neutrophil activation and NETosis are the major drivers of thrombosis in heparin-induced thrombocytopenia. Nat Commun 2019;10(1):1322. DOI: 10.1038/s41467-019-09160-7. [DOI] [PMC free article] [PubMed] [Google Scholar]
- 13.Hoppenbrouwers T, Boeddha NP, Ekinci E, et al. Neutrophil Extracellular Traps in Children With Meningococcal Sepsis. Pediatr Crit Care Med 2018;19(6):e286–e291. DOI: 10.1097/PCC.0000000000001496. [DOI] [PubMed] [Google Scholar]
- 14.Galore Trim (RRID:SCR_011847) (http://www.bioinformatics.babraham.ac.uk/projects/trim_galore/).
- 15.Dobin A, Davis CA, Schlesinger F, et al. STAR: ultrafast universal RNA-seq aligner. Bioinformatics 2013;29(1):15–21. DOI: 10.1093/bioinformatics/bts635. [DOI] [PMC free article] [PubMed] [Google Scholar]
- 16.Anders S, Pyl PT, Huber W. HTSeq--a Python framework to work with high-throughput sequencing data. Bioinformatics 2015;31(2):166–9. DOI: 10.1093/bioinformatics/btu638. [DOI] [PMC free article] [PubMed] [Google Scholar]
- 17.Love MI, Huber W, Anders S. Moderated estimation of fold change and dispersion for RNA-seq data with DESeq2. Genome Biol 2014;15(12):550. DOI: 10.1186/s13059-014-0550-8. [DOI] [PMC free article] [PubMed] [Google Scholar]
- 18.Huber W, Carey VJ, Gentleman R, et al. Orchestrating high-throughput genomic analysis with Bioconductor. Nat Methods 2015;12(2):115–21. DOI: 10.1038/nmeth.3252. [DOI] [PMC free article] [PubMed] [Google Scholar]
- 19.Pozzan T, Lew DP, Wollheim CB, Tsien RY. Is cytosolic ionized calcium regulating neutrophil activation? Science 1983;221(4618):1413–5. DOI: 10.1126/science.6310757. [DOI] [PubMed] [Google Scholar]
- 20.Nguyen GT, Green ER, Mecsas J. Neutrophils to the ROScue: Mechanisms of NADPH Oxidase Activation and Bacterial Resistance. Front Cell Infect Microbiol 2017;7:373. DOI: 10.3389/fcimb.2017.00373. [DOI] [PMC free article] [PubMed] [Google Scholar]
- 21.Kaplan MJ, Radic M. Neutrophil extracellular traps: double-edged swords of innate immunity. J Immunol 2012;189(6):2689–95. DOI: 10.4049/jimmunol.1201719. [DOI] [PMC free article] [PubMed] [Google Scholar]
- 22.van Kessel KP, Bestebroer J, van Strijp JA. Neutrophil-Mediated Phagocytosis of Staphylococcus aureus. Front Immunol 2014;5:467. DOI: 10.3389/fimmu.2014.00467. [DOI] [PMC free article] [PubMed] [Google Scholar]
- 23.Pare G, Vitry J, Merchant ML, et al. The Inhibitory Receptor CLEC12A Regulates PI3K-Akt Signaling to Inhibit Neutrophil Activation and Cytokine Release. Front Immunol 2021;12:650808. DOI: 10.3389/fimmu.2021.650808. [DOI] [PMC free article] [PubMed] [Google Scholar]
- 24.Lad Y, McHugh B, Hodkinson PS, et al. Phospholipase C epsilon suppresses integrin activation. J Biol Chem 2006;281(40):29501–12. DOI: 10.1074/jbc.M513471200. [DOI] [PubMed] [Google Scholar]
- 25.Watt S, Vasquez L, Walter K, et al. Genetic perturbation of PU.1 binding and chromatin looping at neutrophil enhancers associates with autoimmune disease. Nat Commun 2021;12(1):2298. DOI: 10.1038/s41467-021-22548-8. [DOI] [PMC free article] [PubMed] [Google Scholar]
- 26.Mallery SR, Zeligs BJ, Ramwell PW, Bellanti JA. Gender-related variations and interaction of human neutrophil cyclooxygenase and oxidative burst metabolites. J Leukoc Biol 1986;40(2):133–46. DOI: 10.1002/jlb.40.2.133. [DOI] [PubMed] [Google Scholar]
- 27.Patin E, Hasan M, Bergstedt J, et al. Natural variation in the parameters of innate immune cells is preferentially driven by genetic factors. Nat Immunol 2018;19(3):302–314. DOI: 10.1038/s41590-018-0049-7. [DOI] [PubMed] [Google Scholar]
- 28.Villanueva E, Yalavarthi S, Berthier CC, et al. Netting neutrophils induce endothelial damage, infiltrate tissues, and expose immunostimulatory molecules in systemic lupus erythematosus. J Immunol 2011;187(1):538–52. DOI: 10.4049/jimmunol.1100450. [DOI] [PMC free article] [PubMed] [Google Scholar]
- 29.Safi R, Kallas R, Bardawil T, et al. Neutrophils contribute to vasculitis by increased release of neutrophil extracellular traps in Behcet’s disease. J Dermatol Sci 2018;92(2):143–150. DOI: 10.1016/j.jdermsci.2018.08.010. [DOI] [PubMed] [Google Scholar]
- 30.Gupta S, Kaplan MJ. The role of neutrophils and NETosis in autoimmune and renal diseases. Nat Rev Nephrol 2016;12(7):402–13. DOI: 10.1038/nrneph.2016.71. [DOI] [PMC free article] [PubMed] [Google Scholar]
- 31.Leffler J, Gullstrand B, Jonsen A, et al. Degradation of neutrophil extracellular traps co-varies with disease activity in patients with systemic lupus erythematosus. Arthritis Res Ther 2013;15(4):R84. DOI: 10.1186/ar4264. [DOI] [PMC free article] [PubMed] [Google Scholar]
- 32.Taneja R, Sharma AP, Hallett MB, Findlay GP, Morris MR. Immature circulating neutrophils in sepsis have impaired phagocytosis and calcium signaling. Shock 2008;30(6):618–22. DOI: 10.1097/SHK.0b013e318173ef9c. [DOI] [PubMed] [Google Scholar]
- 33.Meizlish ML, Pine AB, Bishai JD, et al. A neutrophil activation signature predicts critical illness and mortality in COVID-19. Blood Adv 2021;5(5):1164–1177. DOI: 10.1182/bloodadvances.2020003568. [DOI] [PMC free article] [PubMed] [Google Scholar]
- 34.Sheshachalam A, Srivastava N, Mitchell T, Lacy P, Eitzen G. Granule protein processing and regulated secretion in neutrophils. Front Immunol 2014;5:448. DOI: 10.3389/fimmu.2014.00448. [DOI] [PMC free article] [PubMed] [Google Scholar]
- 35.Middleton EA, He XY, Denorme F, et al. Neutrophil extracellular traps contribute to immunothrombosis in COVID-19 acute respiratory distress syndrome. Blood 2020;136(10):1169–1179. DOI: 10.1182/blood.2020007008. [DOI] [PMC free article] [PubMed] [Google Scholar]
- 36.Vaillancourt M, Desaulniers P, Pare G, et al. Expression of the myeloid inhibitory receptor CLEC12A correlates with disease activity and cytokines in early rheumatoid arthritis. Sci Rep 2021;11(1):11248. DOI: 10.1038/s41598-021-90631-7. [DOI] [PMC free article] [PubMed] [Google Scholar]
- 37.Hellebrekers P, Hietbrink F, Vrisekoop N, Leenen LPH, Koenderman L. Neutrophil Functional Heterogeneity: Identification of Competitive Phagocytosis. Front Immunol 2017;8:1498. DOI: 10.3389/fimmu.2017.01498. [DOI] [PMC free article] [PubMed] [Google Scholar]
Associated Data
This section collects any data citations, data availability statements, or supplementary materials included in this article.