

Abstract
Dectin-1 is known to drive pro-inflammatory cytokine production by macrophages and dendritic cells which promotes Th17 CD4+ T cell responses in the setting of fungal infection. However, the role of Dectin-1 signaling in neutrophils and its impact on CD4+ T cells is not well understood. In this study, we found that neutrophils stimulated with a Dectin-1 agonist diminish CD4+ T cell viability in a rapid and ROS-dependent manner. Furthermore, Dectin-1 promoted neutrophil PD-L1 expression via Syk and Card9 signaling, along with other immune-checkpoint factors in a neutrophil-biased manner. Although neutrophil PD-L1 did not significantly impact disease severity in experimental autoimmune encephalomyelitis (EAE), we found that CNS-infiltrated neutrophils potently upregulate PD-L1 expression. Furthermore, a subset of PD-L1+ neutrophils was also found to express MHC-II during EAE. In summary, we found that Dectin-1 elicits a biphasic neutrophil response in which (1) T-cell suppressive ROS is followed by (2) upregulation of PD-L1 expression. This response may serve to limit excess CD4+ T cell-driven inflammation in infection or autoimmunity while preserving host-defense functions of neutrophils.
Graphical Abstract

Schematic depicting Dectin-1 signaling-induced ROS and PD-L1 expression in neutrophils. Upper panel depicts outcomes of Dectin-1 stimulation on neutrophils; rapid ROS production followed by upregulation of PD-L1 expression. Lower left panel depicts PD-L1 (Cd274) upregulation mediated by Dectin-1 signaling via Syk and Card9. Lower right panel depicts distinct time course of ROS production and PD-L1 upregulation.
SUMMARY SENTENCE
Mechanisms identified by which Dectin-1 signaling in neutrophils promotes a cellular phenotype with T cell-suppressive properties.
INTRODUCTION
Dectin-1, a C-type lectin receptor (CLR) expressed by myeloid cells, responds to microbial β-glucans and endogenous ligands to elicit immune effector functions during infection and autoimmunity [1, 2]. Dectin-1 is well characterized for its role in promoting pro-inflammatory cytokine expression through Card9/NFκB signaling in response to fungal ligands [3]. Dectin-1-induced cytokine expression by dendritic cells (DCs) and macrophages is critical for the development of host-protective Th17 CD4+ T cell response in the context of fungal infections [4]. However, the role of Dectin-1 in regulating neutrophil-CD4+ T cell interactions is less understood.
Neutrophils are increasingly recognized as potential regulators of the adaptive immune response [5], and certain neutrophil subsets have been referred to as granulocytic myeloid-derived suppressor cells (G-MDSCs) based on their capacity to inhibit T cells via secreted factors or cell surface proteins [6, 7]. Even though neutrophils are not typically considered to be capable of antigen presentation to CD4+ T cells, multiple studies have shown that neutrophils can acquire MHC-II expression and may present antigens to CD4+ T cells under certain conditions [8, 9].
In this study, we sought to investigate the role of Dectin-1 in regulating neutrophil-CD4+ T cell interactions. We found that Dectin-1 promotes neutrophil expression of PD-L1, an immune checkpoint factor that can inhibit T cell activity via PD-1 [10]. Given our previous findings that Dectin-1 limited disease in the CD4+ T cell-mediated autoimmunity model of experimental autoimmune encephalomyelitis (EAE) [11], we investigated whether Dectin-1/PD-L1 signaling in neutrophils may be involved. We found that endogenous Dectin-1 signaling modestly promoted PD-L1 expression by CNS-infiltrated neutrophils in a cell-type-specific and cell-intrinsic manner, although neutrophil-specific deletion of PD-L1 (Cd274) had only a minor impact on EAE development, suggesting that the Dectin-1/PD-L1 axis is unlikely to sufficiently explain the beneficial function of Dectin-1 in EAE [11]. In ex vivo culture, we found that Dectin-1-activated neutrophils inhibited CD4+ T cells by compromising CD4+ T cell viability in co-culture via rapid ROS production which preceded upregulation of PD-L1 expression. In summary, we have identified a role for Dectin-1 in regulating neutrophil-CD4+ T interactions by driving a biphasic neutrophil response in which (1) T-cell suppressive ROS is followed by (2) upregulation of PD-L1 expression.
MATERIALS AND METHODS
Mice
Adult six- to eight-week-old mice of the C57BL/6 (B6) background were used for all experiments in a sex- and age-matched manner. No major differences between the two sexes were found in this study. Dectin-1-deficient (Clec7a−/−) mice were originally generated by Dr. Gordon Brown (U. of Aberdeen) [12]. Card-9-deficient (Card9−/−) mice were provided by Dr. Xin Lin (M.D. Anderson Cancer Center, Houston, TX) [13]. Mrp8cre mice were purchased from the Jackson Laboratory (Bar Harbor, ME, USA) (Stock Number: 021614) [14]. Cd274fl/fl mice were provided by Dr. Yiping Yang (The Ohio State U.) [15]. Pdcd1−/− mice were purchased from the Jackson Laboratory (Stock Number: 028276) [16]. All mouse experiments were performed with approval by the Institutional Animal Care and Use Committee at Duke University. All mice were housed under specific pathogen-free conditions at Duke University.
Reagents, Abs and recombinant proteins
Curdlan (β−1,3 glucan hydrate, from Alcaligenes faecalis) was obtained from Sigma-Aldrich (St. Louis, MO, USA). Hot-alkali treated depleted zymosan (dz) was used as a Dectin-1-specific ligand for in vivo experiments and was obtained from Invivogen. Zymosan was obtained from MP Biomedicals (Irvine, CA, USA). Pam2CSK4 was obtained from Invivogen (San Diego, CA, USA). Inhibitors of Syk (BAY 61–3606) and NFAT (VIVIT) were purchased from Cayman Chemical (Ann Arbor, MI, USA), and the inhibitor of Raf-1 (GW5074) was purchased from Sigma Aldrich (St. Louis, MO, USA). Concentrations for the small molecule inhibitors were determined using supplier recommendations and based on previous publications. N-Acetyl-L-cysteine (NAC) was obtained from Sigma Aldrich (A9165) (St. Louis, MO, USA). Recombinant mouse (rm) M-CSF and GM-CSF proteins were obtained from BioLegend (San Diego, CA, USA). MOG35–55 peptide (MEVGWYRSPFSRVVHLYRNGK) was synthesized by United Biosystems (Herndon, VA, USA). Recombinant catalase was obtained from Abcam (Waltham, MA). Heat-killed Mycobacterium tuberculosis (hkMtb) H37a Ra was purchased from BD Difco™ (Franklin Lakes, NJ, USA). Pertussis toxin (PTx) was obtained from List Biologicals (Campbell, CA, USA). A detailed list of antibodies (Abs) and reagents can be found in Supplemental Table 1.
EAE induction and evaluation
EAE was induced as previously described [11] using the following method: MOG35–55 peptide (100 μg in 100 μl PBS) emulsified in CFA (100 μl including 2 mg/ml hkMtb) was subcutaneously (s.c.) injected into lower flanks of mice. Intraperitoneal injection of PTx (200 ng in 200 ml PBS) was performed on day 0 and 2. Mice were monitored daily for clinical signs of EAE and scores were assigned based on the following criteria: 0.5, partial tail limpness; 1, tail limpness; 1.5, impaired righting reflex; 2, partial hindlimb paralysis; 2.5, partial hindlimb paralysis with dragging of at least one hind paw; 3, bilateral hindlimb paralysis; 3.5, severe bilateral hindlimb paralysis with hunched posture; 4, hind- and forelimb paralysis; 5, death.
Cell isolation from tissues
Mice were euthanized as recommended by American Veterinary Medical Association using CO2 and a secondary method. BM was isolated from the femur and tibia using a needle and syringe with sterile PBS to flush the marrow. Sterile glass slides were used to homogenize spleens and ILNs. Single-cell suspensions of mouse tissues were treated with RBC lysis solution prior to downstream use. Spinal cord (SC) cells were isolated by using a needle and syringe filled with sterile PBS to flush the SC from the vertebral column. SC tissue was then minced in PBS including 5% FBS and 1mM HEPES and digested with Collagenase D (Roche/Sigma-Aldrich, St. Louis, MO, USA) at 37 C for 30 minutes. Single cell suspensions were then prepared by passing tissue through an 18G needle and filtering through a 70 μm cell strainer. Cells were then resuspended in 38 % isotonic Percoll and centrifuged at 2,000 g for 30 min with no brake. Following centrifugation, the lipid and debris layer was aspirated from the top of the tube and the cell pellet was resuspended in PBS.
Flow cytometry analysis
Live cell discrimination was accomplished using a LIVE/DEAD™ fixable dead cell stain kit (Invitrogen, Carlsbad, CA, USA) to stain single cell suspensions prior to staining with fluorochrome-conjugated antibodies (Abs) (see Supplemental Table 1 for detailed Ab information). Cells were analyzed by flow cytometry using either BD Fortessa X20 or BD FACSCanto II analyzers (BD systems, Durham, NC, USA) and results were analyzed using the FlowJo software. Flow cytometry results were analyzed in all experiments using (1) an initial FSC-A/SSC-A gate to eliminate low FSC-A/SSC-A debris, (2) a FSC-H/FSC-A gate to identify single cells, and (3) Fixable Live/Dead stains to identify live cells prior to gating for further analysis. Gating strategies are described in the text and specific cell types were gated as neutrophils (CD11b+Ly6G+), monocytes (CD11b+Ly6G−Ly6Chi), cDCs (CD11b+CD11c+, with MHC-IIhi for some experiments), F4/80hi macrophages (CD11b+F4/80hi), and CD4+ T cells (CD3+CD4+). ROS production was assessed using a Total Reactive Oxygen Species (ROS) Assay Kit (Invitrogen), in which cells are labeled with a probe that increases in fluorescence upon interaction with ROS. Fluorescence-activated single-cell sorting (FACS) was performed using an Astrios sorter (Beckman Coulter, Brea, CA, USA), and at least one representative post-sort sample was re-analyzed for purity during each sorting experiment.
Neutrophil, monocyte, and BM-derived cell culture
BM neutrophils were isolated with biotinylated mouse Ly6G Abs (BioLegend, San Diego, CA, USA) and streptavidin magnetic beads (Miltenyi Biotec) using MACS-column purification (Miltenyi Biotec, Auburn, CA, USA) for ex vivo study. Purity of CD11b+Ly6G+ cells was >95% following isolation. Hema3 staining confirmed multi-lobulated nuclei, indicating mature neutrophil morphology. Findings in Fig. 1A (Cd274 expression) and Fig. 6B were validated using neutrophils isolated by negative selection using the EasySep Mouse Neutrophil Enrichment Kit from StemCell Technologies (Vancouver, BC, Canada). BM monocytes were isolated by FACS as CD11b+Ly6G−Ly6C+ cells (Astrios sorter, Beckman Coulter, Brea, CA, USA). BM neutrophils (CD11b+Ly6G+) were also isolated by FACS when BM monocytes are compared. BMDMs or BMDCs were generated by culturing BM cells with rmM-CSF (20 ng/ml, BioLegend) or rmGM-CSF (20 ng/ml, BioLegend), respectively. Complete RPMI medium was used for all cell culture studies.
Figure 1. Dectin-1 promotes PD-L1 expression in neutrophils via Card9 and Syk signaling pathways.

(A) RT-qPCR analysis of candidate gene expression in BM neutrophils stimulated with curdlan for 3 hrs. Representative of 2 independent experiments, error bars denote technical variation. (B) Flow cytometry analysis of PD-L1 surface protein levels in BM neutrophils stimulated with curdlan (100 μg/ml) for 7 hrs. Representative of 2 independent experiments. (C) RT-qPCR analysis of Cd274 expression in BM neutrophils stimulated with curdlan for 3hrs with or without purified anti-IFNγ antibody. Mean ± SEM of n=2 samples/group. Representative of 2 independent experiments. (D) RT-qPCR analysis of Cd274 expression in BM neutrophils from WT, Dectin-1-deficient (Clec7a−/−), and Card9-deficient (Card9−/−) mice stimulated with curdlan (100 μg/ml) for 3 hrs. Representative of 2 independent experiments, mean ± SEM of n=2 samples/group shown. (E) Schematic of small molecule inhibitors of Dectin-1 signaling pathways. (F-H) RT-qPCR analysis of Cd274 gene expression. BM neutrophils were pre-treated for 1 hr with the indicated concentrations of small molecule inhibitors targeting Syk (F), Raf1 (G), and NFAT (H), followed by curdlan stimulation for 3 hrs. Data combined from two independent experiments are shown with mean ± SEM and unpaired t-test results comparing indicated conditions.
Figure 6. Dectin-1-activated neutrophils inhibit ex vivo CD4+ T cell viability via ROS production.

(A) Flow cytometry analysis of Dectin-1 expression on splenic CD4+ T cells and BM neutrophils. (B, C) Frequency of live CD4+ T cells following 24 hr co-culture with BM neutrophils, with or without curdlan (100 μg/ml). CD4+ T cells were stimulated with plate-coated CD3/CD28 Abs (B). No T cell stimulation (C). Data combined from four independent experiments is shown with mean ± SEM. (D) Flow cytometry analysis of PD-1 expression on CD4+ T cells following 24 hr stimulation with plate-coated CD3/CD28 Abs. Representative of at least two independent experiments (D). (E) Frequency of live WT CD4+ T cells pre-stimulated for 24 hrs with CD3/CD28 Abs, followed by 24 hr co-culture with BM neutrophils, with or without curdlan (100 μg/ml). Data combined from three independent experiments is shown with mean ± SEM. (F) Frequency of live Pdcd1−/− CD4+ T cells pre-stimulated for 24 hrs with CD3/CD28 Abs, followed by 48 hr co-culture with BM neutrophils, with or without curdlan (100 μg/ml). Mean ± SEM of n=2 samples/group. Representative of three independent experiments. (G) Frequency of live CD4+ T cells following 24 hr co-culture with BM neutrophils with or without curdlan and with or without N-acetyl cysteine (NAC, 10mM) to inhibit ROS. Mean ± SEM of n=2 samples/group. Representative of three independent experiments. (H) Frequency of live CD4+ T cells following 24 hr co-culture with BM neutrophils with or without curdlan and with or without recombinant catalase (500U/ml) to inhibit extracellular ROS. Data combined from two independent experiments. with mean ± SEM shown. (I, J) Total ROS assay in BM neutrophils following ex vivo stimulation with curdlan (100 μg/ml). Quantification of MFI levels (I) and representative FACS analysis (J). (K) RT-qPCR analysis of Cd274 gene expression in BM neutrophils following in vitro stimulation with curdlan (100 μg/ml). Data combined from two independent experiments is shown with mean ± SEM, n=2 where each n represents the average of technical replicates within a single experiment (I, K). (L) RT-qPCR analysis of Cd274 gene expression in BM neutrophils 3hrs following in vitro stimulation with curdlan (100 μg/ml), with or without 1hr pre-treatment with NAC (10mM). Data combined from two independent experiments is shown with mean ± SEM, n=2 where each n represents the average of technical replicates within a single experiment.
Neutrophil – CD4+ T cell co-cultures
BM neutrophils were isolated using MACS-column purification (Miltenyi Biotec, Auburn, CA, USA) as described above. Splenic CD4+ T cells were isolated using negative selection with the EasySep Mouse CD4+ T cell Isolation Kit (StemCell Technologies, Vancouver, BC, Canada). In experiments involving CD4+ T cell activation, purified anti-CD3/CD28 antibodies (5 μg/mL of anti-CD3 and 1 μg/mL of anti-CD28) in sterile PBS were used to coat cell culture plates overnight and the cell culture plate was washed with PBS prior to using for cell culture. Neutrophil – CD4+ T cell co-cultures used 0.5×10⁶ cells/ml of each cell type at a 1:1 ratio. As expected based on the relatively short half-life of neutrophils, the 1:1 ratio of neutrophils to CD4+ T cells was reduced to <0.15:1 after 24 hrs, with the viability of remaining neutrophils between approximately 50–70%. In some experiments, CD4+ T cells were pre-activated for 24 hrs using anti-CD3/CD28 antibody-coated plates prior to the addition of neutrophils (Fig. 6E). CD4+ T cell viability was assessed by flow cytometry using Live/Dead Fixable Dead Cell Stain Kits (ThermoFisher, Waltham, MA, USA). In experiments where CD4+ T cell proliferation was evaluated, cells were stained with CellTrace Violet Cell Proliferation Kit (ThermoFisher, Waltham, MA, USA) prior to culture, and proliferation was assessed by flow cytometry analysis after 72 hrs.
Mixed BM Chimera generation
Mixed BM chimeras were generated by an i.v. retro-orbital injection transferring a 50:50 mixture of BM cells from naïve WT CD45.1 and naïve Clec7a−/− CD45.2 mice into irradiated (900 rad) WT CD45.1/CD45.2 recipients. Mice were irradiated using an X-RAD 320 small animal x-ray irradiator managed by the Duke Irradiator Shared Resource core facility. Mice were provided with antibiotic-containing water (Trimethoprim Sulfamethoxazole) for 4 weeks following irradiation and BM transfer. Mice were kept for a total of 8 weeks to ensure full BM reconstitution prior to EAE induction.
RT-qPCR analysis
Gene expression analysis was performed as previously described [11] using the following methods: Total RNA was extracted from cells with TRIzol and reverse transcribed using qScript cDNA Mix (Quantabio, Beverly, MA, USA) to cDNA, which was analyzed by quantitative polymerase chain reaction (PCR) with SYBR FAST qPCR Master Mix (Kapa Biosystems, Wilmington, MA, USA) with primers shown in Supplemental Table 2. Relative mRNA levels were determined using the -ΔΔCt method [17] with internal control, β-actin gene (Actb). Error bars denote mean ± SEM of biological replicates in Figures 1C–D, 1F–H, and 6K. In Figures 1A and 2A, B error bars (sometimes too short to be identified) were calculated using RQ-Min = 2−(ΔΔCt + T*SD(ΔCt)) and RQ-Max = 2−(ΔΔCt – T*SD(ΔCt)) from triplicate wells as suggested by Applied Biosystems (manufacturer of qPCR machines). Results shown are representative of multiple independent experiments with similar results.
Figure 2. Dectin-1 upregulates PD-L1 in vivo and ex vivo in a cell-type-dependent manner.
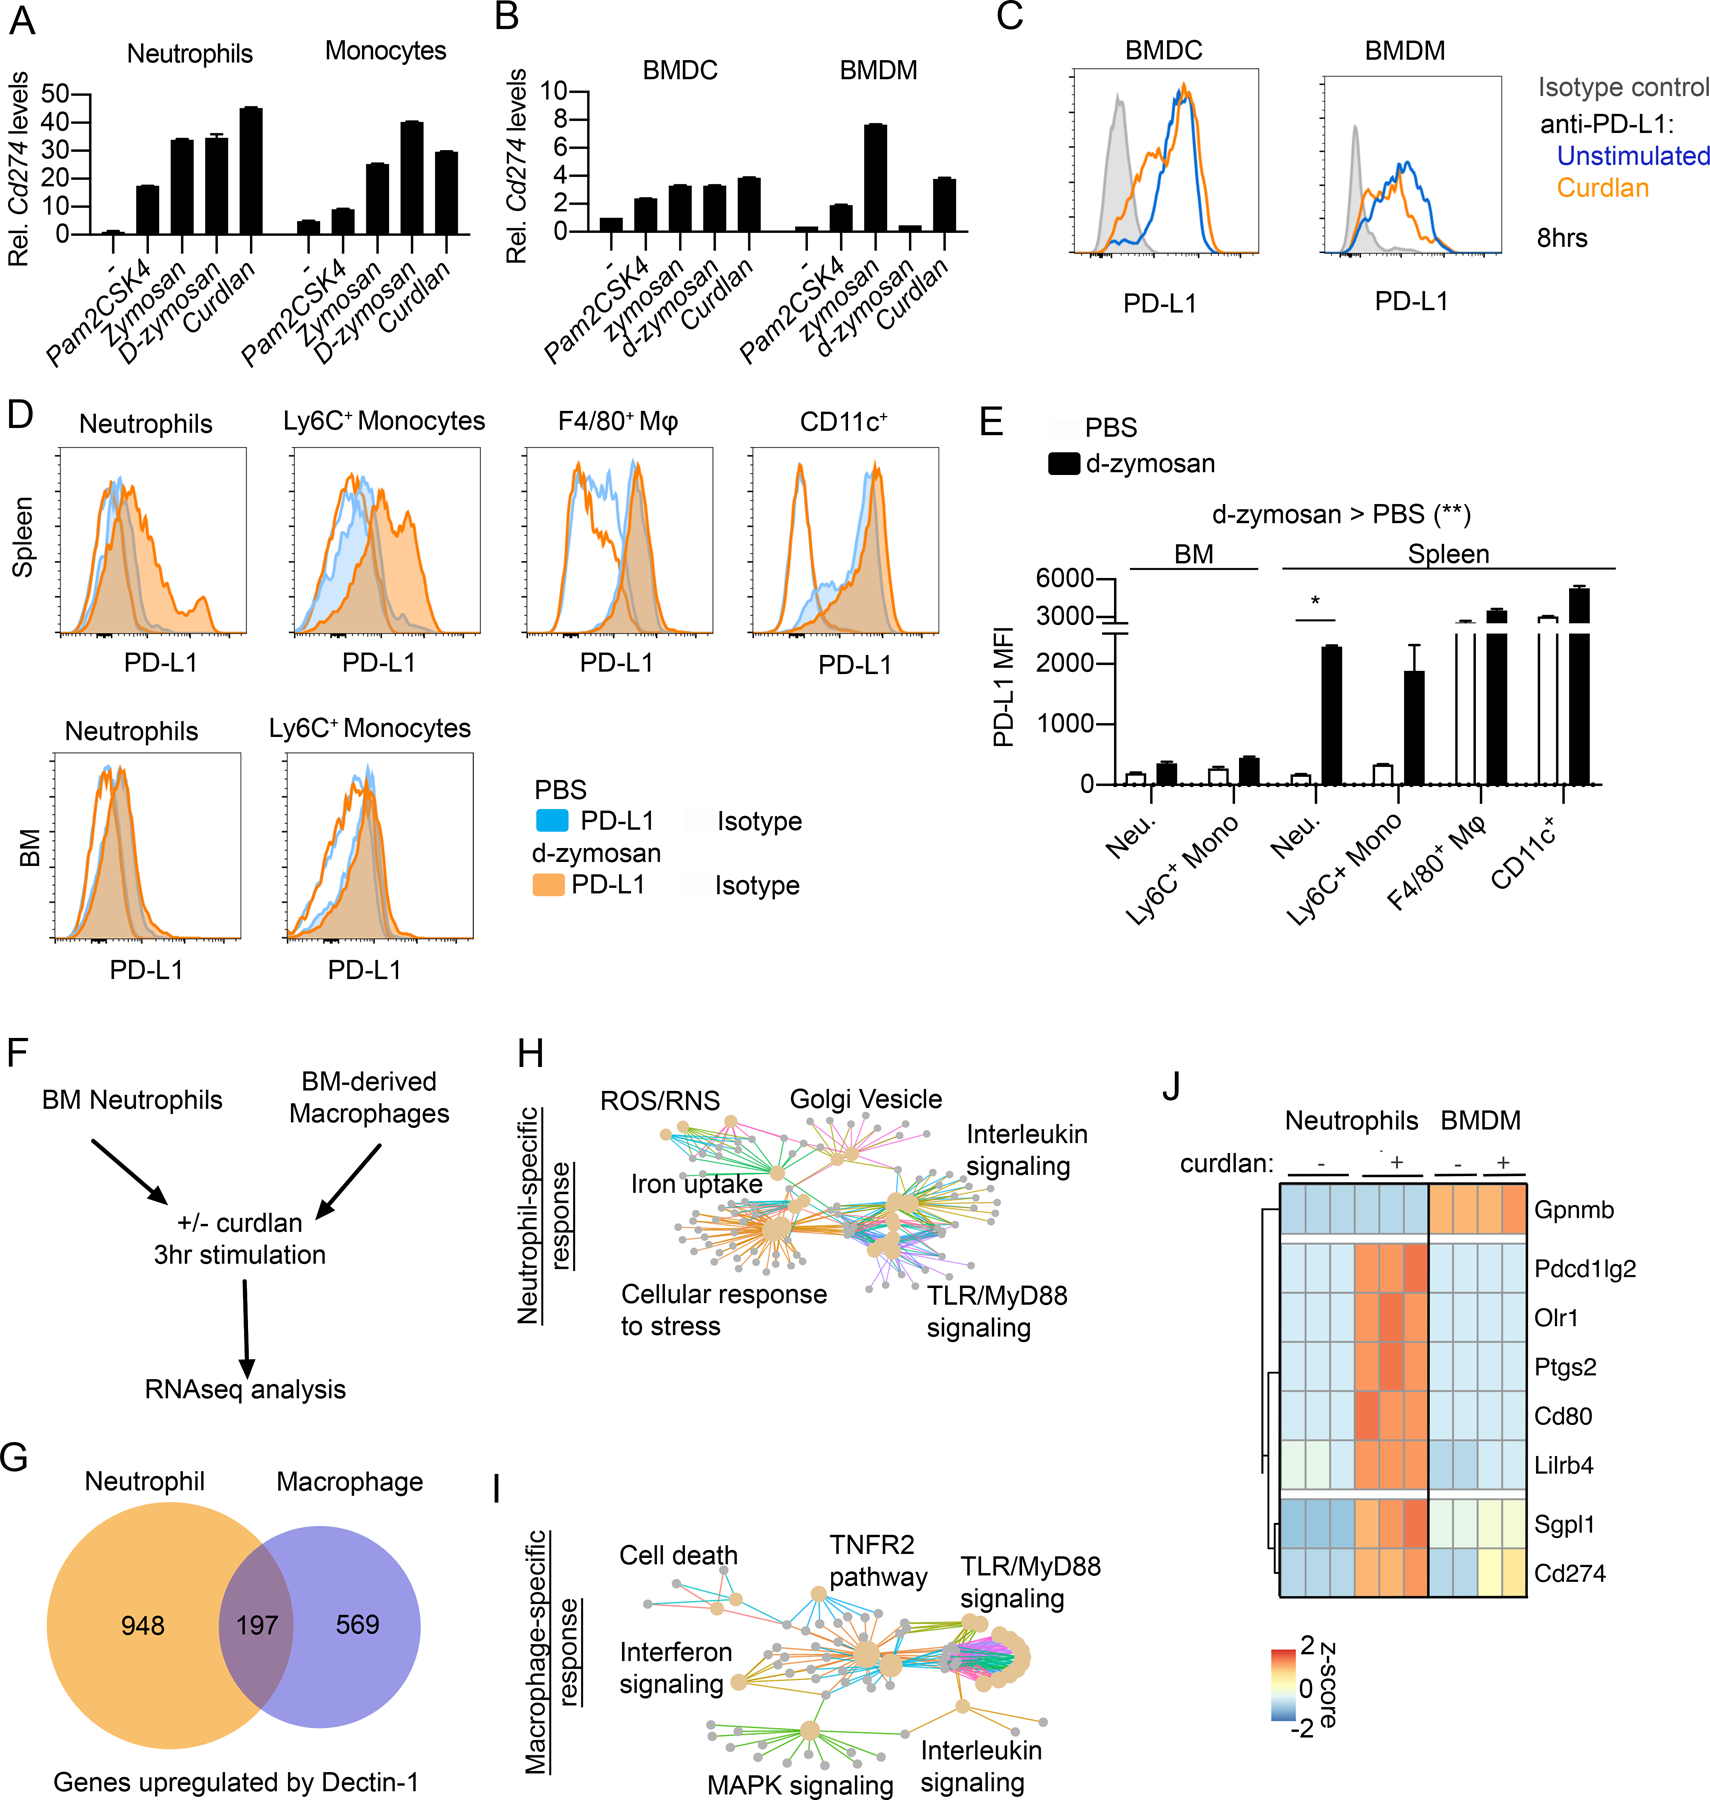
(A, B) RT-qPCR analysis of Cd274 gene expression in flow cytometry-sorted BM neutrophils and monocytes (A) and BMDMs and BMDCs (B) stimulated with Pam2CSK4 (100 ng/ml), Zymosan (100 μg/ml), d-zymosan (100 μg/ml), or curdlan (100 μg/ml) for 3 hrs. Representative of 2 independent experiments each, error bars denote technical variation. (C) Flow cytometry analysis of cell surface PD-L1 protein levels following 8 hr stimulation of BMDM and BMDCs with curdlan. Representative of 2 independent experiments. (D, E) Flow cytometry analysis of PD-L1 expression in indicated cell populations from spleen or BM 24 hrs following i.v. administration of PBS or d-zymosan (500 μg/mouse). Representative histograms (D) and quantified MFI (E) are shown. Mean ± SEM of n=2 mice/group shown. Representative of three independent experiments. (F-J) RNAseq analysis of BM neutrophils and BMDMs treated with curdlan (100 μg/ml) for 3 hrs. Schematic of experiment design (F) and numbers of genes significantly upregulated in neutrophils, macrophages, or in both (G). Reactome pathway analysis of neutrophil-specific (H) or macrophage-specific response genes (I). Heatmap of gene expression for immune checkpoint factors of interest showing neutrophil-specific upregulation with Dectin-1 signaling (J).
RNA-sequencing
BM neutrophils were obtained by MACS-column purification, and BMDMs were generated using M-CSF as described above. Each sample was obtained from an individual WT mouse (n=3 for neutrophil analysis; n=2 for BMDM analysis). Cells were stimulated for 3 hrs with curdlan (100 μg/ml). RNA-seq analysis was performed as previously described [11] using the following methods: Total RNA was extracted from cells using the Rneasy Micro Kit (Qiagen). cDNA libraries were prepared using the KAPA stranded mRNA-seq kit by Duke Sequencing and Genomic Technologies Shared Resource facility. cDNA libraries were sequenced on an Illumina HiSeq4000 using 50-bp single reads. Initial processing and analysis of sequencing results were performed by Duke Genomic Analysis and Bioinformatics core facility as follows: RNA-seq data was processed using the TrimGalore toolkit which employs Cutadapt [18] to trim low-quality bases and Illumina sequencing adapters from the 3’ end of the reads. Only reads that were 20-nt or longer after trimming were kept for further analysis. Reads were mapped to the GRCm38v73 version of the mouse genome and transcriptome [19] using the STAR RNA-seq alignment tool [20]. Reads were kept for subsequent analysis if they mapped to a single genomic location. Gene counts were compiled using the HTSeq tool. Only genes that had at least 10 reads in any given library were used in subsequent analysis. Normalization and differential expression were carried out using the DESeq2 [21] Bioconductor [22] package with the R statistical programming environment [23] (Supplemental Table 2). The false discovery rate was calculated to control for multiple hypothesis testing. Differential expression analysis results can be found in Supplemental Table 3. RNA sequencing data can be found in the NCBI Gene Expression Omnibus as GSE148850.
Neutrophil- and BMDM-enriched gene selection and reactome pathway analysis
We first selected genes with significantly upregulated gene expression with curdlan stimulation (log2 fold-change > 1.5 and adjusted p-value < 0.05) in WT neutrophils or in WT BMDMs. Among statistically significant upregulated genes, we then examined potential overlaps between those that were significantly upregulated in BM neutrophils and BMDMs (Fig. 2G). Those genes that were significantly upregulated only in neutrophils were labeled as “neutrophil-specific” while those significantly upregulated only in BMDMs were labeled as “macrophage-specific”. We performed pathway enrichment analysis on neutrophil-specific and macrophage-specific upregulated genes using the ReactomePA package and gene set overlap analysis [24] and plotted the resulting enriched pathways (adjusted p-value < 0.05) using a cnetplot network diagram (genes are small grey points, pathways are colored, lines indicate correspondence of genes with pathways). A heatmap showing genes of interest (Fig. 2J) was generated using the pheatmap package to plot z-scores and perform hierarchical clustering of selected genes.
Statistical analysis
Statistical analysis was performed as previously described [11] using the following methods: EAE clinical scores were analyzed by calculating the area under the curve (AUC) summing clinical scores over the indicated period. Statistical analysis of EAE clinical score AUC was performed using a non-parametric Mann-Whitney U-test. For remaining analyses, student’s t-test (paired or unpaired, as appropriate, two-sided in all cases) or analysis of variance (ANOVA) was applied (one- or two-factors, repeated measures and post-hoc Sidak testing as appropriate). Specifically, 1-factor ANOVA with post-hoc Sidak testing was applied for analysis of Fig. 3B, C. 2-factor ANOVA with post-hoc Sidak testing was applied for analysis of Fig. 1C, 1D, Fig. 2E, Fig. 6B, C and Fig. 6 E–G where indicated significance reflects post-hoc Sidak’s multiple comparisons testing. All results are expressed as means ± SEM unless otherwise noted, and the criterion of significance was set as p<0.05 (*), p<0.01 (**), or p<0.001 (***). Apart from the analysis of RNA-seq data (described below), Microsoft Excel and GraphPad Prism software were used for all statistical analyses. As indicated in the figure legends, all data shown are either representative of multiple replicate experiments or include combined data from multiple replicate experiments. Information on sample size (n) is also included in figure legends. Investigator blinding was used in EAE experiments which used littermate controls.
Figure 3. PD-L1 expression is upregulated on neutrophils in vivo during.

(A-C) Flow cytometry analysis of cell surface PD-L1 protein levels in BM, Spleen, LN, and SC of WT mice at EAE 15-dpi. Representative flow cytometry plots of PD-L1 expression on Ly6G+ neutrophils with isotype control shown in grey (A). Quantification of PD-L1 MFI in neutrophils (B) and monocytes (C). Data from n=3 mice, representative of three different experiments.
RESULTS
Dectin-1 promotes PD-L1 expression in neutrophils via Syk and Card9 signaling
To investigate whether Dectin-1 can regulate T cell suppressive factors in neutrophils, we examined several candidate genes by RT-qPCR using BM neutrophils (Fig. 1A). We found that the Dectin-1-specific agonist, curdlan, potently upregulated the expression of Cd274 (Fig 1A) encoding PD-L1. Additionally, Dectin-1 stimulation upregulated PD-L1 protein levels on neutrophils as evaluated by flow cytometry (Fig. 1B, Fig. S1A). Although IFNγ is a potent inducer of neutrophil PD-L1 expression [7, 25], neutralizing IFNγ did not limit Cd274 expression with Dectin-1 stimulation (Fig. 1C), suggesting Dectin-1 may act through a distinct signaling mechanism. To better understand which signaling pathways contribute to the Dectin-1/PD-L1 axis in neutrophils, we compared Cd274 expression in curdlan-stimulated neutrophils from WT, Dectin-1-deficient (Clec7a−/−) and Card9-deficient (Card9−/−) mice (Fig. 1D). Upregulation of Cd274 was inhibited in both Clec7a−/− and Card9−/− mice, indicating that PD-L1 upregulation by Dectin-1 is Card9-dependent. Furthermore, using small molecule inhibitors, we demonstrated that Dectin-1-mediated Cd274 upregulation depends on Syk but not on Raf1 signaling (Fig. 1E–G). We previously showed that NFAT signaling is important for mediating Card9-independent Dectin-1 signaling in neutrophils [11]. Although inhibition of NFAT showed a trend toward reduced Cd274 mRNA upregulation by neutrophils (Fig. 1H), no significant effect was seen at the level of cell surface protein expression. In summary, we find that Syk and Card9 signaling mainly mediates PD-L1 upregulation by Dectin-1 in neutrophils.
Dectin-1 signaling upregulates PD-L1 in vivo and ex vivo in a cell-type-dependent manner
Next, we asked whether Dectin-1 promotes PD-L1 expression on other myeloid cell types. Notably, both BM neutrophils and monocytes showed upregulation of Cd274 gene expression within 3 hrs of curdlan stimulation, with neutrophils showing slightly greater upregulation from baseline compared to monocytes (Fig. 2A). In contrast, BM-derived macrophages (BMDMs) and dendritic cells (BMDCs) showed a much smaller increase in Cd274 mRNA levels compared to neutrophils (Fig. 2B). Notably, BMDMs and BMDCs constitutively expressed relatively high levels of PD-L1 (Fig. 2C). Thus, the Dectin-1/PD-L1 axis is particularly potent in neutrophils compared to other myeloid cell types.
Next, we wanted to evaluate whether Dectin-1 agonists can promote PD-L1 expression on neutrophils and other myeloid cells in vivo. We administered hot alkali-depleted zymosan (d-zymosan), a Dectin-1-specific agonist, via intravenous (i.v.) injection and evaluated PD-L1 expression after 24 hrs (Fig. 2D, E; gating strategy in Fig. S1B–D). We found that d-zymosan upregulated PD-L1 expression on splenic neutrophils and monocytes to a greater extent than splenic F4/80+ macrophages or CD11c+ cells (Fig. 2D, E). Splenic neutrophils and monocytes also upregulated PD-L1 to a greater extent than BM neutrophils or monocytes after i.v. d-zymosan injection (Fig. 2D, E). Thus, while we observed a significant effect of d-zymosan on the overall increase in PD-L1 levels across myeloid cell types, the largest effect was observed with splenic neutrophils. Although the effect of d-zymosan administration in PD-L1 upregulation in vivo may be indirect, our findings both in vivo and ex vivo indicate that Dectin-1 promotes PD-L1 expression neutrophil-biased manner.
Differences between neutrophils and macrophages in Dectin-1-mediated transcriptional programs
To better understand the cell-type-specific differences in Dectin-1-mediated transcriptional programs beyond the expression of PD-L1, we performed RNA-seq on BMDMs and BM neutrophils treated with curdlan for 3 hrs [11]. BMDMs were selected along with neutrophils because Dectin-1-mediated PD-L1 expression in BMDMs was not greatly impacted as observed in neutrophils (Fig. 2A, B). We identified 197 genes that were significantly upregulated both in neutrophils and macrophages, while 948 genes were neutrophil-specific, and 569 genes were macrophage-specific (Fig. 2F, G). Pathway analysis also revealed that neutrophil and macrophage Dectin-1 signaling upregulates genes with different effector functions (Fig. 2H, I). In particular, neutrophil-specific genes included factors involved in cellular responses to stress (Hif1a, Ptges3, Ubc, Prdx1), ROS/RNS production in phagocytes (Atp6v1e1, Atp6v0c), and iron uptake/transport (Hmox1, Hmox2, Fbxl5, Tfrc) while macrophage-specific genes were enriched in cell death (Fas, Traf2, Cflar), interferon (Jak2, Mx2, Socs1, Socs3), and TNFR2 (Tnf, Cd40, Tnfsf4) signaling pathways. Examining factors involved in CD4+ T cell regulation, we found that curdlan upregulated multiple immune checkpoint factors (Pdcd1lg2, Cd80, Lilrb4) in a neutrophil-specific manner in addition to Cd274 (Fig. 2J). Together these findings indicate that, although expression patterns of some genes are conserved between neutrophils and macrophages, Dectin-1 signaling also triggers distinct cell-type-specific transcriptional programs with neutrophils showing more pronounced ROS, iron metabolism, and cellular stress responses, while macrophages show more pronounced TNF, interferon, and cell death signaling pathways. In addition, multiple immune checkpoint factors exhibit neutrophil-specific upregulation by Dectin-1.
Significant upregulation of PD-L1 expression on neutrophils in vivo with autoantigen immunization
To evaluate the expression of neutrophil PD-L1 in vivo in the setting of autoimmunity, we used the MOG-peptide autoantigen immunization mouse model of Experimental Autoimmune Encephalomyelitis (EAE). Following immunization, we observed that neutrophils in the LN and at the site of inflammation in the spinal cord (SC) showed significant upregulation in PD-L1 expression relative to spleen or BM neutrophils (Fig. 3A, B; gating strategy in Fig. S2A). Indeed, almost all neutrophils in the SC during peak disease were PD-L1+ (Fig. 3A). This trend of increasing PD-L1 expression from BM and spleen to LN and CNS was also observed for Ly6C+ monocytes (Fig. 3C). In addition, PD-1+CD4+ T cells were also identified at the site of inflammation at this timepoint (Fig. S2B).
Here, mixed BM chimera using WT and Clec7a−/− BM cells showed modestly higher PD-L1 expression on WT neutrophils, but not on WT monocytes, in the spinal cord, suggesting that Dectin-1 signaling promoted PD-L1 expression in vivo on neutrophils in a cell-intrinsic manner at the site of inflammation (Fig. S2C–F). When examining the effect on clinical disease, Cd274fl/fl;Mrp8cre mice with neutrophil-specific PD-L1 deletion (Fig. 4A, B) did not show a major impact on EAE score (Fig. 4C–E). Indeed, even PD-1-deficient (Pdcd1−/−) mice showed only a mild difference in clinical scores (Fig. 4F–I), thus the PD-L1/PD-1 axis may not have a critical anti-inflammatory role in this experimental setting. This is consistent with previous reports which demonstrated an incremental rather than dramatic role for PD-L1/PD-1 axis in the standard MOG35–55 C57BL/6 EAE model [26, 27], whereas immunization regimens without PTx [26] or use of the 129Sv strain [28, 29] demonstrate more potent PD-1/PD-L1 mediated regulation of EAE. In sum, although the impact of PD-L1 was not reflected in our model, the use of this autoantigen immunization model did clearly demonstrate the ability of neutrophils to potently upregulate PD-L1 expression in vivo at the site of inflammation.
Figure 4. Evaluation of neutrophil PD-L1 function in EAE.
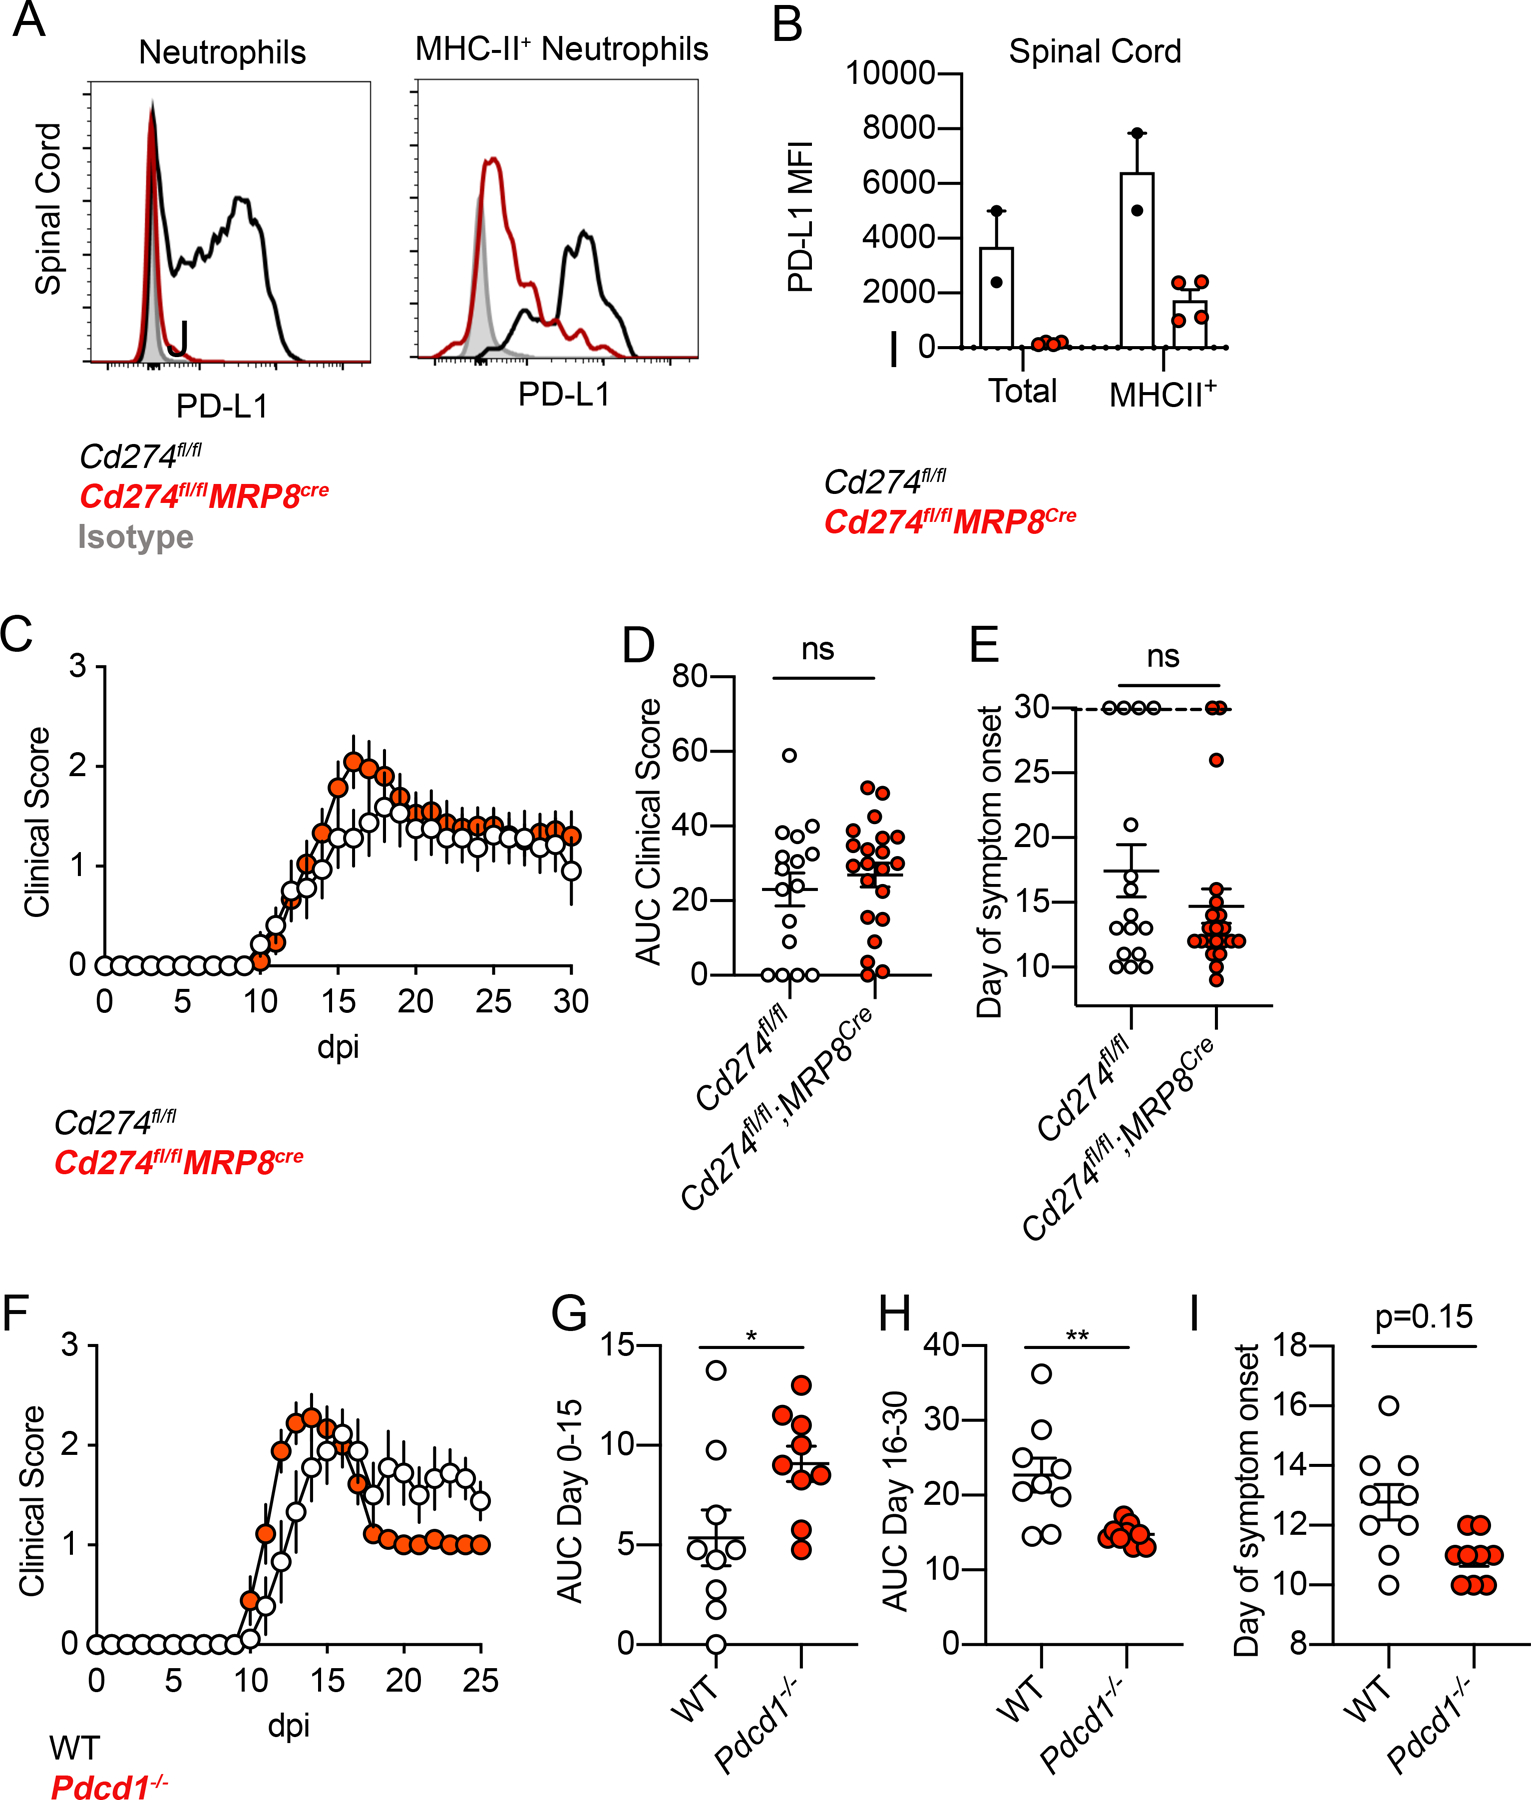
(A, B) Flow cytometry analysis of PD-L1 expression in total and MHC-II+ neutrophils at 16-dpi EAE from SC of Cd274fl/fl and Cd274fl/fl;MRP8cre mice. Representative flow cytometry plots (A) and quantification (B) are shown. Data representative of two independent experiments. One point denotes one mouse. (C-E) EAE clinical scores from Cd274fl/fl and Cd274fl/fl;MRP8cre mice (C), with AUC of clinical scores quantified in (D) and day of symptom onset quantified in (E). Data combined from two independent experiments. One point denotes one mouse. (F-I) EAE clinical scores from WT and Pdcd1−/− mice (F), clinical score AUC of day 0–15 (G) and day 16–30 (H), day of symptom onset (I). Data combined from two independent experiments. One point denotes one mouse.
Neutrophil MHC-II expression is not upregulated by Dectin-1
We next wanted to investigate whether Dectin-1 could also upregulate MHC-II expression in neutrophils. In EAE, we observed that a subset of PD-L1+ neutrophils also co-expressed MHC-II (Fig. 5A–C), although the majority of neutrophils remained MHC-II−. However, Dectin-1 signaling did not upregulate MHC-II expression in neutrophils in the spinal cord during EAE (Fig. 5D, E; Fig. S2G, H). From our RNA-seq dataset, we also found that ex vivo culture of BM neutrophils stimulated with curdlan alone did not result in upregulation of MHC-II encoding genes (Fig. 5F).
Figure 5. Dectin-1 does not upregulate neutrophil MHC-II expression either in vivo during EAE or ex vivo.
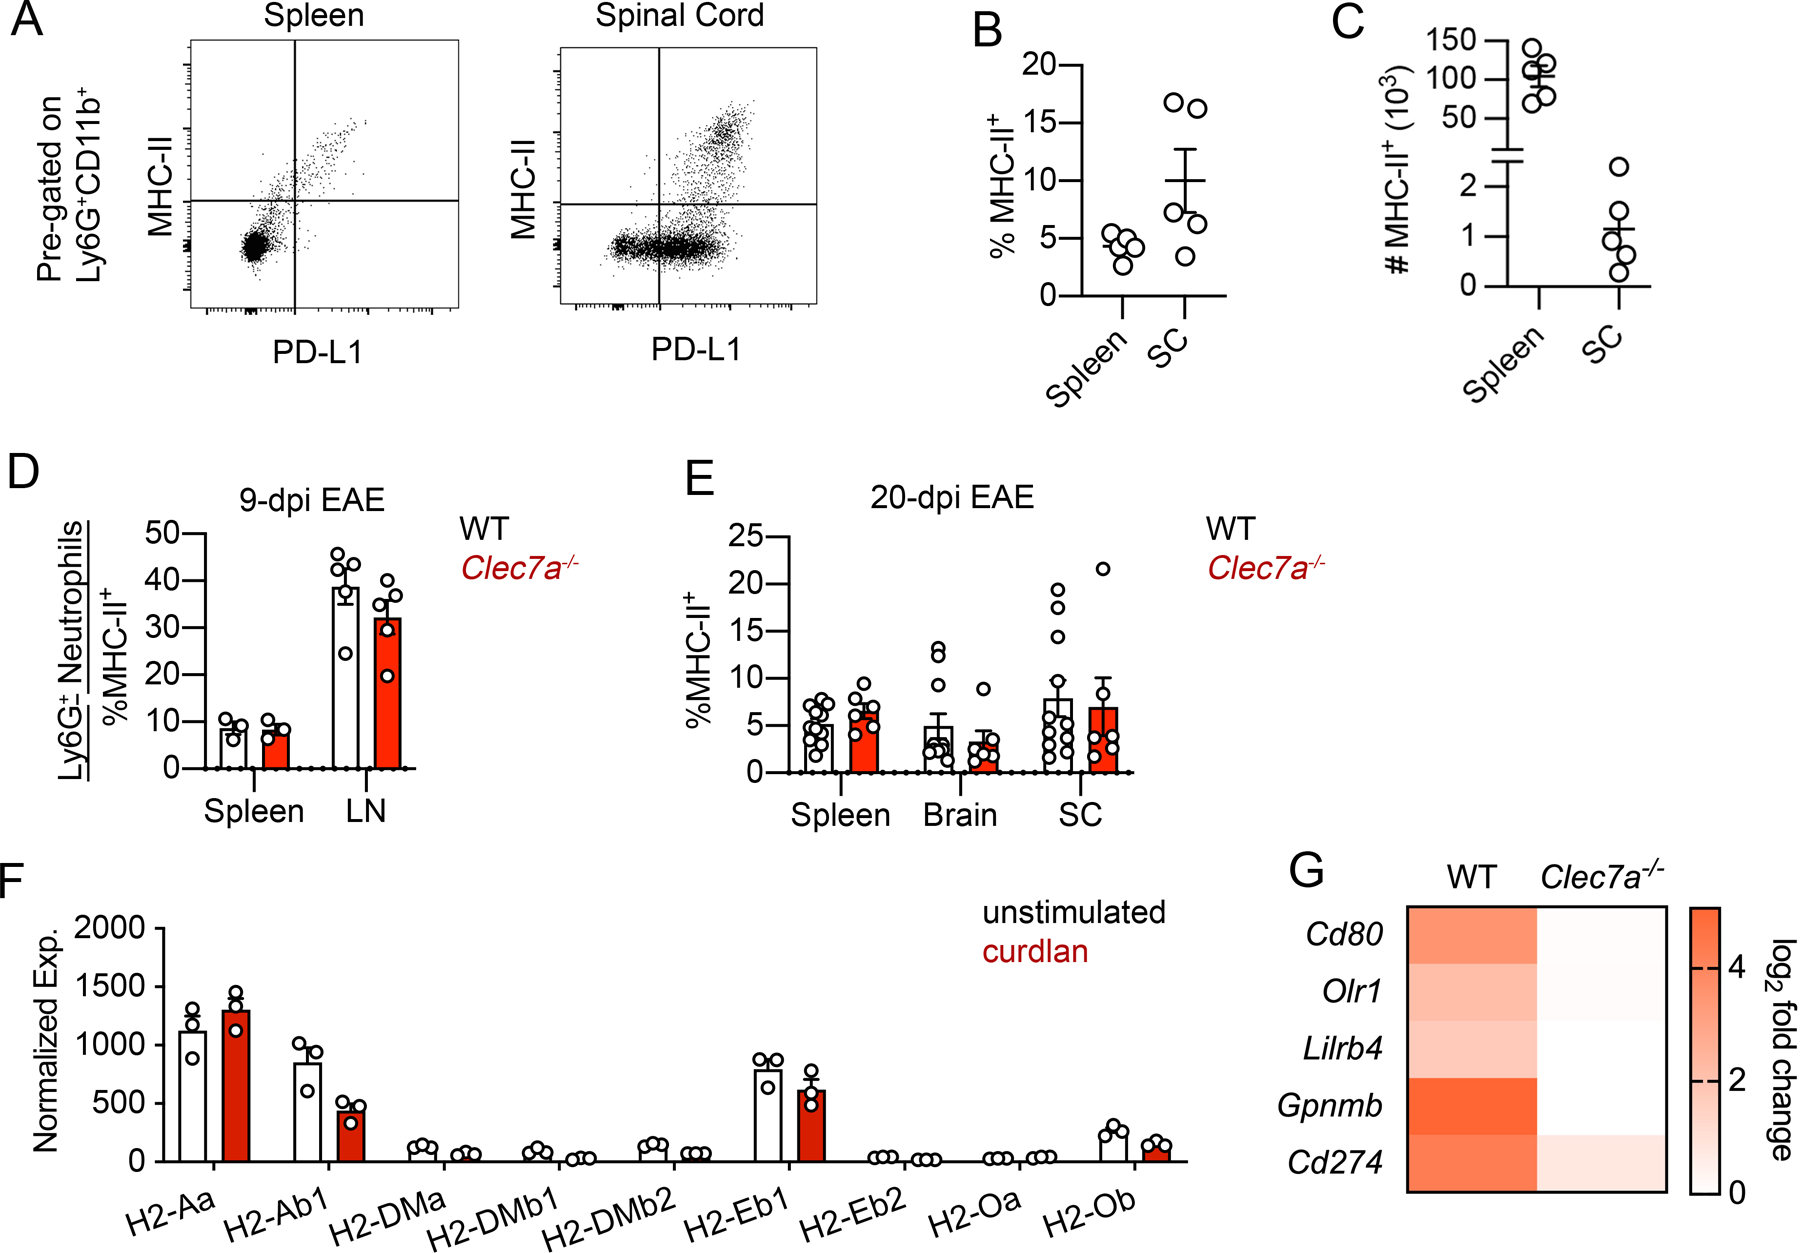
(A-C) Flow cytometry analysis of MHC-II and PD-L1 expression on neutrophils from the spleen and SC of WT mice at EAE 17-dpi with representative plots (A) and quantification of frequency (B) and cell number (C). (D, E) Flow cytometry analysis of the frequency of MHC-II+ neutrophils in indicated tissues from WT and Clec7a−/− mice at 9-dpi EAE (D) and 20-dpi EAE (E). Data representative of two independent experiments. One point denotes one mouse. (F) Expression of genes encoding MHC-II proteins in BM neutrophils treated with curdlan (100 μg/ml) for 3 hrs, from RNAseq dataset. (G) Heatmap showing fold-upregulation of indicated genes following 3hrs curdlan stimulation of BM neutrophils from WT and Clec7a−/− mice.
In addition, based on our RNAseq dataset using purified BM neutrophils, we validated by RT-qPCR that Dectin-1 directly upregulates the expression of Cd80, Lilrb4, Gpnmb in addition to Cd274 in a Dectin-1-dependent manner (Fig. 5G). Thus, while Dectin-1 does not upregulate neutrophil MHC-II expression, it can promote the expression of multiple immune checkpoint proteins in neutrophils, with the potential to further regulate the interaction of MHC-II+ neutrophils with CD4+ T cells. In summary, Dectin-1 induces multiple immune checkpoint factors, potentially regulating T cell activity, but Dectin-1 does not upregulate MHC-II expression by neutrophils either ex vivo or in vivo during EAE.
Neutrophils primed with a Dectin-1 agonist inhibit CD4+ T cell viability ex vivo
Neutrophil PD-L1 has been previously shown to inhibit CD4+ and CD8+ T cell activity [7, 31], suggesting that Dectin-1 signaling may promote this T cell-suppressive phenotype of neutrophils. Next, we asked if stimulating Dectin-1 signaling makes neutrophils inhibit CD4+ T cell activation. To do this, we co-cultured BM neutrophils and splenic CD4+ T cells on a plate coated with CD3/CD28 antibodies, in the presence or absence of a Dectin-1 agonist, curdlan. Notably, CD4+ T cells did not express Dectin-1 (Fig. 6A), indicating that neutrophils would be the sole mediators of Dectin-1 stimulation in the co-culture system. Addition of curdlan led to a dramatic loss of viable T cells within 24 hrs only when neutrophils were present (Fig. 6B). (Here, because the window of 24 hours is too short for evaluating T cell proliferation, we focused on T cell viability.) Dectin-1-activated neutrophils also significantly reduced T cell viability, i.e., diminished viability of naïve T cells in the absence of TCR stimulation (Fig. 6C). Again, curdlan alone had no significant impact on T cell viability in the absence of neutrophils (Fig. 6B, C) consistent with the lack of Dectin-1 expression on CD4+ T cells (Fig. 6A). Together, this suggests that Dectin-1 signaling in neutrophils can significantly inhibit CD4+ T cell viability in a rapid and T cell activation-independent manner.
ROS from Dectin-1-activated neutrophils inhibits T cell viability
Based on these findings, we predicted that a mechanism other than PD-1/PD-L1 immune checkpoint could mediate the inhibition of CD4+ T cell viability particularly because of attenuated viability of naïve CD4+ T cells (Fig. 6C) despite no PD-1 expression (Fig. 6D). Because TCR stimulation greatly upregulated PD-1 on CD4+ T cells (Fig. 6D), we used pre-activated PD-1-expressing CD4+ T cells for the following experiments. As expected from the result in Fig. 6A, the viability of pre-activated CD4+T cells was significantly reduced by the addition of neutrophils and curdlan in the T cell culture (Fig. 6E). This inhibitory effect on T cell viability was still intact with PD-1-deficient (Pdcd1−/−) CD4+ T cells (Fig. 6F). This suggests that the inhibitory effect of Dectin-1 activated neutrophils ex vivo does not require PD-L1/PD-1 interaction and suggests that an alternative rapid and T cell activation-independent mechanism is involved. Furthermore, it is unlikely that neutrophil MHC-II expression would contribute to this phenotype, given that Dectin-1 signaling is not sufficient to upregulate MHC-II in neutrophils (Fig. 5F).
Dectin-1 is known to induce ROS production in neutrophils [32], and ROS inhibits T cell activation and survival [33]. To test whether this could be a possible mechanism, we used N-acetyl cysteine (NAC) to inhibit ROS [34]. Notably, we found that the effect of Dectin-1 activated neutrophils on T cell viability was reduced in the presence of NAC, indicating the effect is dependent on ROS, at least in part (Fig. 6G). In addition, inhibiting extracellular ROS by adding recombinant catalase to the co-culture showed a trend toward blocking the effect of Dectin-1 activated neutrophils on T cell viability, although the effect was not statistically significant (Fig. 6H). Together, these findings indicate that, in addition to promoting the expression of a checkpoint molecule (PD-L1) on neutrophils, Dectin-1 induces ROS production by neutrophils to regulate CD4+ T cell viability.
Dectin-1 promotes a biphasic neutrophil response involving ROS production and PD-L1 upregulation
Next, we sought to characterize the dynamics of Dectin-1-triggered ROS and PD-L1 expression in neutrophils ex vivo. We found that ROS is rapidly produced upon Dectin-1 stimulation and peaked at 1 hour post-stimulation (Fig. 6I, J), while mRNA upregulation of Cd274 (Fig. 6K) was more gradual and continued to show upregulation at 6 hrs. Given that ROS production preceded Cd274 upregulation, we next asked whether ROS may help promote Cd274 expression. Indeed, we found that inhibiting ROS using NAC reduced upregulation of Cd274 expression (Fig. 6L), indicating that the rapid ROS production can also promote PD-L1 upregulation. In summary, we found that Dectin-1 signaling can elicit both ROS-mediated T cell suppression and PD-L1 upregulation in neutrophils, and that this occurs in a biphasic manner (Graphical Abstract). In the context of autoimmunity, modulating this Dectin-1-regulated biphasic response has the potential to harness neutrophils to restrain a pathogenic CD4+ T cell response.
DISCUSSION
In this study, we found that Dectin-1 signaling triggers a biphasic CD4+ T cell-suppressive neutrophil phenotype. Dectin-1 is primarily studied for its role in promoting pro-inflammatory cytokine production in macrophages and DCs which enhances the Th17 cell response during fungal infections [35]. However, the role of Dectin-1 signaling in neutrophils that interact with CD4+ T cells is less well characterized, although a recent study suggests that Dectin-1 may promote neutrophilic MDSCs in the context of fungal infections [36]. We found that Dectin-1-activated neutrophils rapidly diminish CD4+ T cell viability within three hours in a ROS-dependent manner. In addition, Dectin-1 in neutrophils promotes expression of an immune-checkpoint factor transcriptional program including PD-L1 at later time-points. Thus, Dectin-1 triggers a biphasic neutrophil response through (1) rapid release of T-cell-suppressive ROS and (2) subsequent upregulation of PD-L1 expression.
Dectin-1-triggered T cell-suppressive functions by neutrophils may have potential relevance in the setting of CD4+ T cell-mediated autoimmunity, as Dectin-1 promotes neutrophil PD-L1 expression in vivo during EAE. However, neutrophil PD-L1 had only a minimal effect on EAE development in our setting. Given our previous findings of a beneficial role of Dectin-1 in EAE mediated by a mechanism independent of PD-L1 [11], we believe that the Dectin-1/PD-L1 axis alone is likely insufficient to explain the beneficial function of Dectin-1 in our EAE setting. Indeed, EAE using the 129Sv strain demonstrated the protective role of PD-L1 and PD-1 [28, 29]. Thus, future studies in other disease models of autoimmunity and sterile inflammation may reveal a more potent role for neutrophil PD-L1 and its regulation by Dectin-1. In the context of cancer, neutrophil PD-L1 has been shown to inhibit CD4+ and CD8+ T cell anti-tumor activity [7, 31] and macrophage Dectin-1 stimulated with an endogenous agonist (Galectin-9) has been shown to promote a pro-tumor tolerogenic immune phenotype [32], while another study showed that Dectin-1 on macrophages and DCs enhances anti-tumor responses upon detecting N-glycans on tumor cells [37]. Understanding how Dectin-1 signaling is activated and balances its pro- vs. anti-inflammatory outcomes in tumor development merits further investigation, particularly regarding the role of Dectin-1 mediated neutrophil PD-L1 expression.
Given that myeloid cell expression of PD-L1 can inhibit TCR signaling in CD4+ T cells [10], the role of neutrophil PD-L1 remains to be determined in antigen presentation in the presence or absence of MHC-II expression. Neutrophils are not classically considered as antigen-presenting cells. However, recent studies suggest a potential role for neutrophil MHC-II in antigen presentation and modulation of the adaptive immune response [8, 9, 38] including in the setting of EAE [39]. In this study, we found that Dectin-1 promoted a PD-L1+MHC-II+ neutrophil subpopulation in the context of GM-CSF stimulation ex vivo. The role of Dectin-1 in regulating antigen presentation by PD-L1+MHC-II+ neutrophils merits further investigation.
We primarily focused on the role of non-endogenous Dectin-1 ligands (d-zymosan and curdlan, microbial β-glucans) in upregulating PD-L1 and triggering T cell-suppressive ROS production in our ex vivo studies. However, we also observed that an endogenous Dectin-1 ligand, Galectin-9, upregulated Cd274 expression by neutrophils ex vivo (data not shown). In addition, our data from EAE mice with sterile inflammation suggested that Dectin-1 signaling, which modestly promotes PD-L1 expression in a neutrophil-specific and cell-intrinsic manner, is triggered with endogenous ligands in the CNS. Thus, both microbial β-glucans and endogenous Dectin-1 ligands have the potential to induce PD-L1 expression in neutrophils. Because of this, Dectin-1/PD-L1 signaling may have relevance in multiple disease contexts from fungal infection to autoimmunity and cancer. Furthermore, β-glucans have been investigated as potential therapeutics to elicit anti-tumor immunity [41] and for their ability to elicit trained immunity in monocytes [42]. A more recent study demonstrated that Annexins act as endogenous Dectin-1 ligands to induce tolerance by eliciting Dectin-1 signaling distinct from β-glucan-mediated Dectin-1 signaling [43]. Therefore, a better understanding of ligand-specific activation of a selective Dectin-1 signaling pathway is critical and greatly merits further consideration in developing therapeutic approaches to target Dectin-1.
In conclusion, we found that Dectin-1 stimulation of neutrophils can elicit a biphasic T-cell suppressive phenotype in which rapid ROS production is followed by PD-L1 upregulation. Such a mechanism may serve as a check to prevent excessive T cell-driven inflammation during infection or autoimmunity, while still preserving the critical functions of neutrophils in rapid host defense.
Supplementary Material
Supplemental Table 1 – Reagents and Antibodies
Supplemental Table 2 – Primer sequences
Supplemental Table 3 – RNA-seq analysis of BM neutrophils and BMDMs stimulated with Dectin1 agonist, curdlan
ACKNOWLEDGEMENTS
We appreciate the assistance of the Duke Cancer Institute Flow Cytometry Core and the Duke Center for Genomic and Computational Biology core facility. Yiping Yang (Ohio State U.) provided the Cd274fl/fl mouse line. Yul Huh assisted with experiments in Fig. 6B, C. Tomoko Kadota in the Shinohara Lab provided assistance with mouse genotyping. The study was supported by NIH R01-AI088100, NIH R01-NS120417, and National Multiple Sclerosis Society (NMSS) RG-4536B2/1 to MLS; and NIH F30-AI140497 to MED.
Funding:
This study was funded by the NIH (R01-AI088100, R01-NS120417) to MLS and the NIH (F30-AI140497, T32-GM007171) to MED.
ABBREVIATIONS
- BM
Bone marrow
- BMDM
Bone marrow-derived macrophages
- CLR
C-type lectin receptor
- DCs
Dendritic cells
- EAE
Experimental autoimmune encephalomyelitis
- ROS
Reactive oxygen species
Footnotes
CONFLICT OF INTEREST DISCLOSURE
The authors declare no conflict of interest
DATA AVAILABILITY
All relevant data from this study will be made available upon request. RNA sequencing data can be found in the NCBI Gene Expression Omnibus as GSE148850.
REFERENCES
- 1.Kalia N, Singh J, Kaur M (2021) The role of dectin-1 in health and disease. Immunobiology 226, 152071. [DOI] [PubMed] [Google Scholar]
- 2.Deerhake ME and Shinohara ML (2021) Emerging roles of Dectin-1 in noninfectious settings and in the CNS. Trends Immunol 42, 891–903. [DOI] [PMC free article] [PubMed] [Google Scholar]
- 3.Gross O, Gewies A, Finger K, Schafer M, Sparwasser T, Peschel C, Forster I, Ruland J (2006) Card9 controls a non-TLR signalling pathway for innate anti-fungal immunity. Nature 442, 651–6. [DOI] [PubMed] [Google Scholar]
- 4.Kimberg M and Brown GD (2008) Dectin-1 and its role in antifungal immunity. Med Mycol 46, 631–6. [DOI] [PubMed] [Google Scholar]
- 5.Li Y, Wang W, Yang F, Xu Y, Feng C, Zhao Y (2019) The regulatory roles of neutrophils in adaptive immunity. Cell Commun Signal 17, 147. [DOI] [PMC free article] [PubMed] [Google Scholar]
- 6.Aarts CEM and Kuijpers TW (2018) Neutrophils as myeloid-derived suppressor cells. Eur J Clin Invest 48 Suppl 2, e12989. [DOI] [PubMed] [Google Scholar]
- 7.de Kleijn S, Langereis JD, Leentjens J, Kox M, Netea MG, Koenderman L, Ferwerda G, Pickkers P, Hermans PW (2013) IFN-gamma-stimulated neutrophils suppress lymphocyte proliferation through expression of PD-L1. PLoS One 8, e72249. [DOI] [PMC free article] [PubMed] [Google Scholar]
- 8.Matsushima H, Geng S, Lu R, Okamoto T, Yao Y, Mayuzumi N, Kotol PF, Chojnacki BJ, Miyazaki T, Gallo RL, Takashima A (2013) Neutrophil differentiation into a unique hybrid population exhibiting dual phenotype and functionality of neutrophils and dendritic cells. Blood 121, 1677–89. [DOI] [PMC free article] [PubMed] [Google Scholar]
- 9.Fites JS, Gui M, Kernien JF, Negoro P, Dagher Z, Sykes DB, Nett JE, Mansour MK, Klein BS (2018) An unappreciated role for neutrophil-DC hybrids in immunity to invasive fungal infections. PLoS Pathog 14, e1007073. [DOI] [PMC free article] [PubMed] [Google Scholar]
- 10.Qin W, Hu L, Zhang X, Jiang S, Li J, Zhang Z, Wang X (2019) The Diverse Function of PD-1/PD-L Pathway Beyond Cancer. Front Immunol 10, 2298. [DOI] [PMC free article] [PubMed] [Google Scholar]
- 11.Deerhake ME, Danzaki K, Inoue M, Cardakli ED, Nonaka T, Aggarwal N, Barclay WE, Ji RR, Shinohara ML (2021) Dectin-1 limits autoimmune neuroinflammation and promotes myeloid cell-astrocyte crosstalk via Card9-independent expression of Oncostatin M. Immunity [DOI] [PMC free article] [PubMed] [Google Scholar]
- 12.Taylor PR, Tsoni SV, Willment JA, Dennehy KM, Rosas M, Findon H, Haynes K, Steele C, Botto M, Gordon S, Brown GD (2007) Dectin-1 is required for beta-glucan recognition and control of fungal infection. Nat Immunol 8, 31–8. [DOI] [PMC free article] [PubMed] [Google Scholar]
- 13.Hsu YM, Zhang Y, You Y, Wang D, Li H, Duramad O, Qin XF, Dong C, Lin X (2007) The adaptor protein CARD9 is required for innate immune responses to intracellular pathogens. Nat Immunol 8, 198–205. [DOI] [PubMed] [Google Scholar]
- 14.Passegue E, Wagner EF, Weissman IL (2004) JunB deficiency leads to a myeloproliferative disorder arising from hematopoietic stem cells. Cell 119, 431–43. [DOI] [PubMed] [Google Scholar]
- 15.Petty AJ, Dai R, Lapalombella R, Baiocchi RA, Benson DM, Li Z, Huang X, Yang Y (2021) Hedgehog-induced PD-L1 on tumor-associated macrophages is critical for suppression of tumor-infiltrating CD8+ T cell function. JCI Insight 6. [DOI] [PMC free article] [PubMed] [Google Scholar]
- 16.Keir ME, Freeman GJ, Sharpe AH (2007) PD-1 regulates self-reactive CD8+ T cell responses to antigen in lymph nodes and tissues. J Immunol 179, 5064–70. [DOI] [PubMed] [Google Scholar]
- 17.Livak KJ and Schmittgen TD (2001) Analysis of relative gene expression data using real-time quantitative PCR and the 2(-Delta Delta C(T)) Method. Methods 25, 402–8. [DOI] [PubMed] [Google Scholar]
- 18.Martin M (2011) Cutadapt removes adapter squences from high-throughput sequencing reads. Bioinf. in action 17, 10–12. [Google Scholar]
- 19.Kersey PJ, Staines DM, Lawson D, Kulesha E, Derwent P, Humphrey JC, Hughes DS, Keenan S, Kerhornou A, Koscielny G, Langridge N, McDowall MD, Megy K, Maheswari U, Nuhn M, Paulini M, Pedro H, Toneva I, Wilson D, Yates A, Birney E (2012) Ensembl Genomes: an integrative resource for genome-scale data from non-vertebrate species. Nucleic Acids Res 40, D91–7. [DOI] [PMC free article] [PubMed] [Google Scholar]
- 20.Dobin A, Davis CA, Schlesinger F, Drenkow J, Zaleski C, Jha S, Batut P, Chaisson M, Gingeras TR (2013) STAR: ultrafast universal RNA-seq aligner. Bioinformatics 29, 15–21. [DOI] [PMC free article] [PubMed] [Google Scholar]
- 21.Love MI, Huber W, Anders S (2014) Moderated estimation of fold change and dispersion for RNA-seq data with DESeq2. Genome Biol 15, 550. [DOI] [PMC free article] [PubMed] [Google Scholar]
- 22.Huber W, Carey VJ, Gentleman R, Anders S, Carlson M, Carvalho BS, Bravo HC, Davis S, Gatto L, Girke T, Gottardo R, Hahne F, Hansen KD, Irizarry RA, Lawrence M, Love MI, MacDonald J, Obenchain V, Oles AK, Pages H, Reyes A, Shannon P, Smyth GK, Tenenbaum D, Waldron L, Morgan M (2015) Orchestrating high-throughput genomic analysis with Bioconductor. Nat Methods 12, 115–21. [DOI] [PMC free article] [PubMed] [Google Scholar]
- 23.Team RC (2013) R: A language and environment for statistical computing. In R Foundation for Statistical Computing [Google Scholar]
- 24.Yu G and He QY (2016) ReactomePA: an R/Bioconductor package for reactome pathway analysis and visualization. Mol Biosyst 12, 477–9. [DOI] [PubMed] [Google Scholar]
- 25.Langereis JD, Pickkers P, de Kleijn S, Gerretsen J, de Jonge MI, Kox M (2017) Spleen-derived IFN-gamma induces generation of PD-L1(+)-suppressive neutrophils during endotoxemia. J Leukoc Biol 102, 1401–1409. [DOI] [PubMed] [Google Scholar]
- 26.Wang C, Li Y, Proctor TM, Vandenbark AA, Offner H (2010) Down-modulation of programmed death 1 alters regulatory T cells and promotes experimental autoimmune encephalomyelitis. J Neurosci Res 88, 7–15. [DOI] [PMC free article] [PubMed] [Google Scholar]
- 27.Rui Y, Honjo T, Chikuma S (2013) Programmed cell death 1 inhibits inflammatory helper T-cell development through controlling the innate immune response. Proc Natl Acad Sci U S A 110, 16073–8. [DOI] [PMC free article] [PubMed] [Google Scholar]
- 28.Latchman YE, Liang SC, Wu Y, Chernova T, Sobel RA, Klemm M, Kuchroo VK, Freeman GJ, Sharpe AH (2004) PD-L1-deficient mice show that PD-L1 on T cells, antigen-presenting cells, and host tissues negatively regulates T cells. Proc Natl Acad Sci U S A 101, 10691–6. [DOI] [PMC free article] [PubMed] [Google Scholar]
- 29.Carter LL, Leach MW, Azoitei ML, Cui J, Pelker JW, Jussif J, Benoit S, Ireland G, Luxenberg D, Askew GR, Milarski KL, Groves C, Brown T, Carito BA, Percival K, Carreno BM, Collins M, Marusic S (2007) PD-1/PD-L1, but not PD-1/PD-L2, interactions regulate the severity of experimental autoimmune encephalomyelitis. J Neuroimmunol 182, 124–34. [DOI] [PubMed] [Google Scholar]
- 30.Gosselin EJ, Wardwell K, Rigby WF, Guyre PM (1993) Induction of MHC class II on human polymorphonuclear neutrophils by granulocyte/macrophage colony-stimulating factor, IFN-gamma, and IL-3. J Immunol 151, 1482–90. [PubMed] [Google Scholar]
- 31.Wang TT, Zhao YL, Peng LS, Chen N, Chen W, Lv YP, Mao FY, Zhang JY, Cheng P, Teng YS, Fu XL, Yu PW, Guo G, Luo P, Zhuang Y, Zou QM (2017) Tumour-activated neutrophils in gastric cancer foster immune suppression and disease progression through GM-CSF-PD-L1 pathway. Gut 66, 1900–1911. [DOI] [PMC free article] [PubMed] [Google Scholar]
- 32.Daley D, Mani VR, Mohan N, Akkad N, Ochi A, Heindel DW, Lee KB, Zambirinis CP, Pandian GSB, Savadkar S, Torres-Hernandez A, Nayak S, Wang D, Hundeyin M, Diskin B, Aykut B, Werba G, Barilla RM, Rodriguez R, Chang S, Gardner L, Mahal LK, Ueberheide B, Miller G (2017) Dectin 1 activation on macrophages by galectin 9 promotes pancreatic carcinoma and peritumoral immune tolerance. Nat Med 23, 556–567. [DOI] [PMC free article] [PubMed] [Google Scholar]
- 33.Ohl K and Tenbrock K (2018) Reactive Oxygen Species as Regulators of MDSC-Mediated Immune Suppression. Front Immunol 9, 2499. [DOI] [PMC free article] [PubMed] [Google Scholar]
- 34.Curtin JF, Donovan M, Cotter TG (2002) Regulation and measurement of oxidative stress in apoptosis. J Immunol Methods 265, 49–72. [DOI] [PubMed] [Google Scholar]
- 35.LeibundGut-Landmann S, Gross O, Robinson MJ, Osorio F, Slack EC, Tsoni SV, Schweighoffer E, Tybulewicz V, Brown GD, Ruland J, Reis e Sousa C (2007) Syk- and CARD9-dependent coupling of innate immunity to the induction of T helper cells that produce interleukin 17. Nat Immunol 8, 630–8. [DOI] [PubMed] [Google Scholar]
- 36.Rieber N, Singh A, Oz H, Carevic M, Bouzani M, Amich J, Ost M, Ye Z, Ballbach M, Schafer I, Mezger M, Klimosch SN, Weber AN, Handgretinger R, Krappmann S, Liese J, Engeholm M, Schule R, Salih HR, Marodi L, Speckmann C, Grimbacher B, Ruland J, Brown GD, Beilhack A, Loeffler J, Hartl D (2015) Pathogenic fungi regulate immunity by inducing neutrophilic myeloid-derived suppressor cells. Cell Host Microbe 17, 507–14. [DOI] [PMC free article] [PubMed] [Google Scholar]
- 37.Chiba S, Ikushima H, Ueki H, Yanai H, Kimura Y, Hangai S, Nishio J, Negishi H, Tamura T, Saijo S, Iwakura Y, Taniguchi T (2014) Recognition of tumor cells by Dectin-1 orchestrates innate immune cells for anti-tumor responses. Elife 3, e04177. [DOI] [PMC free article] [PubMed] [Google Scholar]
- 38.Pliyev BK, Dimitrieva TV, Savchenko VG (2015) Cytokine-mediated induction of MHC class II in human neutrophils is dependent on NADPH oxidase activity. Eur J Cell Biol 94, 67–70. [DOI] [PubMed] [Google Scholar]
- 39.Whittaker Hawkins RF, Patenaude A, Dumas A, Jain R, Tesfagiorgis Y, Kerfoot S, Matsui T, Gunzer M, Poubelle PE, Larochelle C, Pelletier M, Vallieres L (2017) ICAM1+ neutrophils promote chronic inflammation via ASPRV1 in B cell-dependent autoimmune encephalomyelitis. JCI Insight 2. [DOI] [PMC free article] [PubMed] [Google Scholar]
- 40.Goodridge HS, Simmons RM, Underhill DM (2007) Dectin-1 stimulation by Candida albicans yeast or zymosan triggers NFAT activation in macrophages and dendritic cells. J Immunol 178, 3107–15. [DOI] [PubMed] [Google Scholar]
- 41.Chiffoleau E (2018) C-Type Lectin-Like Receptors As Emerging Orchestrators of Sterile Inflammation Represent Potential Therapeutic Targets. Front Immunol 9, 227. [DOI] [PMC free article] [PubMed] [Google Scholar]
- 42.Netea MG, Dominguez-Andres J, Barreiro LB, Chavakis T, Divangahi M, Fuchs E, Joosten LAB, van der Meer JWM, Mhlanga MM, Mulder WJM, Riksen NP, Schlitzer A, Schultze JL, Stabell Benn C, Sun JC, Xavier RJ, Latz E (2020) Defining trained immunity and its role in health and disease. Nat Rev Immunol 20, 375–388. [DOI] [PMC free article] [PubMed] [Google Scholar]
- 43.Bode K, Bujupi F, Link C, Hein T, Zimmermann S, Peiris D, Jaquet V, Lepenies B, Weyd H, Krammer PH (2019) Dectin-1 Binding to Annexins on Apoptotic Cells Induces Peripheral Immune Tolerance via NADPH Oxidase-2. Cell Rep 29, 4435–4446 e9. [DOI] [PubMed] [Google Scholar]
Associated Data
This section collects any data citations, data availability statements, or supplementary materials included in this article.
Supplementary Materials
Supplemental Table 1 – Reagents and Antibodies
Supplemental Table 2 – Primer sequences
Supplemental Table 3 – RNA-seq analysis of BM neutrophils and BMDMs stimulated with Dectin1 agonist, curdlan
Data Availability Statement
All relevant data from this study will be made available upon request. RNA sequencing data can be found in the NCBI Gene Expression Omnibus as GSE148850.