

Abstract
Selenoprotein I (SELENOI) is an ethanolamine phospholipid transferase contributing to cellular metabolism and the synthesis of glycosylphosphatidylinositol (GPI) anchors. SELENOI knockout (KO) in T cells has been shown to impair metabolic reprogramming during T cell activation and reduce GPI-anchored Thy-1 levels, which are both crucial for Th17 differentiation. This suggests SELENOI may be important for Th17 differentiation, and we found that SELENOI was indeed upregulated early during the activation of naïve CD4+ T cells in Th17 conditions. SELENOI KO reduced RORγt mRNA levels by decreasing SOX5 and STAT3 binding to promoter and enhancer regions in the RORC gene encoding this master regulator of Th17 cell differentiation. Differentiation of naïve CD4+ T cells into inflammatory versus tolerogenic T helper cell subsets was analyzed and results showed that SELENOI deficiency skewed differentiation away from pathogenic Th17 cells (RORγt+ and IL-17A+) while promoting tolerogenic phenotypes (Foxp3+ and IL-10+). Wild-type (WT) and T cell-specific SELENOI KO mice were subjected to experimental autoimmune encephalitis (EAE), with KO mice exhibiting diminished clinical symptoms, reduced central nervous system (CNS) pathology and decreased T cell infiltration. Flow cytometry showed that SELENOI T cell KO mice exhibited lower CD4+RORγt+ and CD4+IL-17A+ T cells and higher CD4+CD25+FoxP3+ T cells in CNS tissues of mice subjected to EAE. Thus, the metabolic enzyme SELENOI is upregulated to promote RORγt transcription that drives Th17 differentiation, and SELENOI deficiency shifts differentiation toward tolerogenic phenotypes while protecting against pathogenic Th17 responses.
Keywords: inflammation, autoimmunity, ethanolamine phospholipid transferase, phosphatidylethanolamine, metabolism
Summary Sentence:
Selenoprotein I expression is required for increased levels of the transcription factor, RORγT, to drive Th17 differentiation.
Introduction
Upon T cell receptor (TCR) triggered activation, naive CD4+ T cells differentiate into one of several T helper cell lineages depending on signals from antigen presenting cells and cytokines present in the surrounding environment. These external stimuli along with TCR stimulation alter cellular metabolism in a regulated, dynamic manner that influences differentiation [1, 2]. CD4+ T cell subsets that arise during activation and differentiation express unique sets of cell surface markers and transcription factors, while secreting a defined array of cytokines that determines their functional properties [3]. T helper type 17 (Th17) cells are one of those subtypes that promote inflammation required for immune responses to specific extracellular bacteria and fungi [4]. However, dysregulated Th17 responses may also contribute to pathogenesis in autoimmune diseases such as rheumatoid arthritis and multiple sclerosis (MS) [5, 6].
Mouse naïve CD4+ T cells differentiate into Th17 cells in the presence of IL-23, TGF-β and IL-6. These cytokines establish an early commitment to the Th17 lineage by activating STAT3, which induces the expression of IL-21 [7]. STAT3 along with SOX5 serve as critical transcription factors to promote expression of a key transcription factor, RORγt [8]. As a master transcriptional regulator of Th17 cells, RORγt has the ability to drive the expression of hallmark cytokines like IL-17A [9]. In contrast, CD4+ regulatory T (Treg) cells contribute to the suppression of immune responses and immune homeostasis, countering Th17 cells to protect against autoimmune disorders. Treg differentiation relies on the upregulation of the transcription factor FoxP3, and Treg cells function to secrete immunosuppressive cytokines TGF-β and IL-10 [10]. Interestingly, both Th17 and Treg cell development share a similar signaling requirement mediated by TGF-β, but intrinsic factors influence differentiation into the different phenotypes [11, 12]. Understanding the mechanisms controlling the balance between pathogenic and tolerant phenotypes during T helper cell differentiation is important for developing new approaches for treating autoimmune disorders like MS.
Th17 differentiation during TCR activation has been shown to be influenced by metabolic reprogramming, which serves to meet increased demand for energy and metabolites [13]. Th17 cells take on a distinct metabolic signature that promotes differentiation into this subtype, heavily relying on finely tuned glycolysis, glutamine metabolism, fatty acid synthesis, and sustained mitochondrial oxidative phosphorylation for their differentiation and pro-inflammatory function [14–17]. Glycosylphosphatidylinositol (GPI) anchor synthesis is also important during T cell activation and differentiation due to roles played by GPI-anchored proteins on their cell surface [18]. Thy-1 (CD90) is a GPI anchored protein that regulates differentiation of several cell types [19], and a recent study revealed that Thy-1 can provide signals to promote RORγt expression and Th17 differentiation [20]. Thus, disruption of metabolic reprogramming and reducing cell surface levels of GPI anchored proteins may hinder effective Th17 differentiation.
Our recent work showed a crucial role for Selenoprotein I (SELENOI) during T cell activation for both effective metabolic reprogramming and sustained levels of GPI anchored proteins [21]. SELENOI is a versatile enzyme participating in the synthesis of both phosphatidylethanolamine (PE) and plasmenyl PE [22, 23], and SELENOI deficiency during T cell activation led to a disruption of ATP generation/expenditure and several metabolic pathways important for promoting proliferative capacity [21]. The effect of SELENOI deficiency on cell surface GPI anchored protein levels can be attributed to PE serving as precursor for GPI anchors [24], and Thy-1 was particularly reduced on activated SELENOI KO T cells. The dual effects of SELENOI deficiency on disrupted metabolic reprogramming and reduced Thy-1 levels, which both contribute to Th17 differentiation, led us to investigate the role of SELENOI in Th17 differentiation in the present study. Using T cell specific SELENOI KO mice, we found that naive CD4+ T cells activated in Th17 conditions expressed lower levels of RORγt, and exhibited reduced Th17 differentiation into pathogenic IL-17A+, IL-22+, and IL-23+ cells accompanied by increased tolerant FoxpP3+ and IL-10+ phenotypes. T cell specific KO of SELENOI reduced pathology and infiltrating RORγt+ and IL-17A+ T cells in a mouse model of MS, experimental autoimmune encephalitis (EAE), providing new insights into metabolic pathways regulating T cell mediated tolerance versus autoimmunity.
Materials and Methods
Mice, antibodies, and reagents
Generation of T cell specific SELENOI KO using lck-Cre (distal promoter) and SELENOIfl/fl mice was previously described [21]. Experiments using mice included age/sex matched male and females 8–12 wks of age, and littermate SELENOIfl/fl mice served as WT controls. Animal protocols were approved by the University of Hawaii Institutional Animal Care and Use Committee. To block Fcγ receptors during flow cytometry, cells were preincubated with anti-CD16/32 (2.4G2; BD Pharmingen) for 15 min followed by antibody stains. BioLegend antibodies used at concentrations recommended by vendor included FITC-anti-CD3 (145–2C11), PE- or APC-anti-CD4 (GK1.5), PE-anti-IL-17 (TC11–18H10.1), PE-anti-IFNγ (XMG1.2), PE-anti-IL-10 (JES5–16E3), PE-anti-TGF-β (TW7–16B4), BV421anti-FoxP3 (MF-14); also used were PE-anti-T-bet (4B10; eBioscience); APC-anti-CD25 (PC61.5; eBioscience), and PE-anti-RORγt (AFKJS-9; Invitrogen). Dead cells were detected with BV421 viable dye or Aqua Dead Cell stain (Invitrogen/ThermoFisher). For immunohistochemistry, antibodies included rabbit polyclonal anti-CD3 (IS503, 1:200; Dako) and SMI-32 Ab (801702, 1:5000; BioLegend). For immunofluorescence, PE-anti-IL-17A was used (17B7, 1:500; Ebioscience). Myelin oligodendrocyte glycoprotein (MOG) 35–55 peptide (InSolution AMPK Inhibitor, Compound C) were purchased from Sigma.
Isolation of naïve CD4+ T cells, flow cytometry and proliferation assays
Spleens, inguinal lymph nodes, and spinal cords from euthanized mice were processed into a single cell suspension using a GentleMACS™ Dissociator (Miltenyi/ThermoFisher). A Naïve Mouse CD4+ T cell isolation kit (Miltenyi) was used to purify cells, and isolated cells counted using a Millipore Sceptor. T cells were activated in 96-well plates pre-coated with BioLegend anti-CD3 (clone 145–2C11; 10 μg/mL) plus anti-CD28 (clone 37.51; 1 μg/ml) for different periods in RPMI-1640 media containing 10% Seradigm 1500–500 FBS (VWR), followed by flow cytometric analyses for differentiation markers or intracellular (ic) staining for cytokines and transcription factors as described [21]. Culture conditions included BioLegend cytokines for Th1: IL-2 (10 ng/mL) and IL-12 (10 ng/mL) and anti-IL-4 (10 mg/mL); Th17: TGF-β (2.5 ng/mL), IL-6 (20 ng/mL) and IL-23 (10 ng/mL); and Treg: TGF-β (5 ng/mL) and IL-2 (5 ng/mL). For flow cytometric evaluation, CD4+ or CD4+CD25+ T cells were analyzed by ic staining for levels of IFN-γ or IL-17 or IL-10 or TGF-β along with T-bet, RORγt, and FoxP3 (antibody clones listed above). For cytokine ic staining, Golgi Stop™ (Fisher Scientific) was added for the last 6 h of stimulation, then cells were 200 mL Fixation Buffer and permeabilized in 250 μL of Intracellular Staining Perm Wash Buffer (both from BioLegend), and PE-conjugated antibodies added at concentrations recommended by vendors. For analyzing T cells from cerebellum and spinal cords by flow cytometry, tissues were excised from mice at day 15 or 30 of EAE protocol, single cell suspensions prepared as previously described [25], and then cells subjected to flow cytometry using the same ic protocol as described above.
Western blots, real-time PCR, and enzyme assays
Cell lysates were prepared as previously described [26], and 30 μg of total protein was loaded per well on a 20% Criterion polyacrylamide gel (Bio-Rad), transferred to nitrocellulose (VWR), and incubated with blocking buffer (Millipore). Primary antibodies were added at 1:500–1000 final dilution. Secondary antibodies (Li-Cor) were added at 1:500–1000 final dilution, and fluorescent signals were detected using a Li-Cor Odyssey infrared imaging system. Primary antibodies included anti-SELENOI (custom Ab from ProMab), anti-β-actin (polyclonal cat#4967; Cell Signaling), anti-SOX5 (ab94396, Abcam) or anti-STAT3 (124H6, Cell Signaling Technology), and anti-RORγt (Invitrogen, clone AFKJS-9). Total RNA was extracted from T cell pellets using a using the E.Z.N.A. total RNA Kit (Omega Bio-tek), cDNA synthesized (Qiagen) and real-time PCR carried out on a LightCycler 480 (Roche) using a SYBR-Green kit (Qiagen) and primers as previously described [27, 28]. Some novel primers for this study included HIF1α fwd: 5’-ACC TGG CAA TGT CTC CTT TAC-3’, rev: 5’-CCA GTG ACT CTG GAC TTG ATT C-3’; IL-17A fwd: 5’- CAG GGA GAG CTT CAT CTG TGT-3’, rev: 5’-GCT GAG CTT TGA GGG ATG AT-3’; FoxP3 fwd: 5’- AAG TGG CAG AGA GGT ATT GAG G-3’, rev: 5’-CTT CTC TAA GCT TTC TTC TGT CTG G-3’; RORγt fwd: 5’- ACC TCT TTT CAC GGG AGG A-3’, rev: 5’-TCC CAC ATC TCC CAC ATT G-3’; BATF fwd: 5’-AGA AAG CCG ACA CCC TTC A-3’, rev: 5’-CGG AGA GCT GCG TTC TGT-3’; IRF4 fwd: 5’-AGC ACC TTA TGG CTC TCT GC-3’, rev: 5’-TGA CTG GTC AGG GGC ATA AT-3’; IL23R fwd: 5’-CCA AGT ATA TTG TGC ATG TGA AGA-3’, rev: 5’- AGC TTG AGG CAA GAT ATT GTT GT-3’; TGF-β fwd: 5’-TGG AGC AAC ATG TGG AAC TC-3’, rev: 5’-GTC AGC AGC CGG TTA CCA-3’; IL10Ra fwd: 5’-CGC TTG GAA TCC CGA ATT A-3’, rev: 5’-CTC AGG TTG GTC ACA GTG AAA T-3’; STAT4 fwd: 5’-CGG CAT CTG CTA GCT CAG T-3’, rev: 5’-TGC CAT AGT TTC ATT GTT AGA AGC-3’; STAT3 fwd: 5’-GTT CCT GGC ACC TTG GAT T-3’, rev: 5’-CAA CGT GGC ATG TGA CTC TT-3’; GPR65 fwd: 5’-CAC TGC TGG TTT CTC TTC TTG AT-3’, rev: 5’-GCC GTT TGG CAT TCT TTC-3’; SOCS3 fwd: 5’-ATT TCG CTT CGG GAC TAG C-3’, rev: 5’-AAC TTG CTG TGG GTG ACC AT-3’.
Immunofluorescence staining of ex vivo T cells
Naïve SELENOI KO CD4+ T cells and WT controls were activated for 18 h on glass coverslips coated with poly-D-lysine and anti-CD3/anti-CD28, followed by fixation with 4% paraformaldehyde (PFA) for 20 min. Nonactivated T cells were added to glass coverslips coated with poly-D-lysine alone, allowed to settle for 5 min followed by PFA fixation. After fixation, cells were permeabilized with 0.2% Triton-X in PBS for 10 min and blocked with 10% normal goat serum in PBS for 1 h. Primary antibodies were added including anti-SOX5 (1:500 Abcam, ab94396) and anti-STAT3 (1:1000 Cell Signaling Technology, 124H6) in blocking reagent for 2 h at RT. Secondary antibodies (anti-Rabbit IgG Alexa Fluor 488, A11070 Invitrogen, 1:1000; anti-Mouse IgG Alexa Fluor 594, A11020 Invitrogen, 1:500) in blocking buffer were added for 1 h at RT. Coverslips were washed with PBS and mounted in VECTASHIELD® Antifade Mounting Medium with DAPI. Images were captured at 40X using a Leica SP8 confocal microscope and analyzed for nuclear localization of SOX5 and STAT3 using Image J. A minimum of 200 cells were included per group.
Chromatin immunoprecipitation (ChIP) assays
Naïve SELENOI KO CD4+ T cells and WT controls were activated using plate-bound anti-CD3/anti-CD28 as described above for 24 h in 96-well plates. For the cross-linking steps, cells were first transferred from wells of plates to 50 mL tubes (one tube per condition) and centrifuged for 5 min at 4°C and ~300 × g. Media was removed and cell pellets were resuspended in 30 mL of RPMI and counted using a Millipore Spector. Cell concentrations were adjusted (20 × 106) in new 50 mL tubes and then were crosslinked with 1% of formaldehyde and quenching with 0.125 M glycine. Cells were pelleted and washed with cold PBS, then transferred to 1.5 mL tubes. The cell lysis steps were next performed by resuspending the cell pellets in 500 μL of RIPA buffer and incubating on ice for 10 min. Each sample was transferred to a sonication tube to shear DNA using M220 focused-ultrasonicator (Covaris, MA) according to the settings: Peak Incident Power 75W; Duty Factor 20%; Cycles per Burst 200; Treatment time 400s. After shearing DNA to 200–500 bp, the samples were transferred to 1.5 mL tubes and centrifuged for 10 min at 4 °C and ~18,000 × g. The supernatants were transferred to new tubes and diluted with the 2 volumes of dilution buffer, and pre-cleared with protein A agarose beads (Thermo Scientific, NY). Either anti-SOX5 (1:250, Abcam, ab94396) or anti-STAT3 (1:250, Cell Signaling Technology, 124H6) was added to pre-cleared lysates and rotated overnight at 4 °C. The beads were washed with 500 μL of RIPA buffer 3 times and high salt buffer one time followed by careful removal of all wash buffer. To purify DNA, 400 μL of reversal buffer (125 mM Tris pH 6.0, 10% β-mercaptoethanol, 4% SDS) was added to the beads and boiled for 30 min. For input, 400 μL of reversal buffer was added to 100 μL of precleared lysates directly. Phenol/chloroform/isoamyl alcohol (25:24:1) was added (400 μL) and tubes shaken for 15 s at RT and allowed to stand for 5 min followed by centrifugation for 5 min at 24°C and ~16,000 × g. The upper phase was transferred to new tubes and the process repeated. DNA was precipitated using 1/10 volume of 3M sodium acetate, 2.5 volume of 100% ethanol, and 3 μL of glycogen, followed by centrifugation for 15 min at 4°C and 20,000 × g. Pellets were dried, and DNA resuspended with 30 μL of water. This DNA was used as template (5 μL) and the samples prior to IP used as template for ‘input’ in real-time PCR reactions carried out as described above. Primers included enhancer SOX5 binding site fwd/rev TCC ACT ATG TTC CCA CCA C/GTC AGC ACG GAG GAT TGT T; enhancer STAT3 binding site fwd/rev GGG TAG GAT GGA CAG CTT CA/AAC AAC TGT ACA CTC ACC TTA G; promoter binding site for both SOX5 and STAT3 binding sites fwd/rev TTG ACA GTC CAC AGG GTC TC/GCC CTC TTC ACC AAG TGA CA. Protocols for ChIP assays analyzing STAT5 binding to distal (CNS0) and intronic (CNS2) enhancers in the FoxP3 gene were followed as previously described [29].
EAE model and assessment by histology and flow cytometry
An established protocol for inducing EAE was followed using inoculation with MOG35–55 peptide emulsified in complete Freund’s adjuvant in combination with pertussis toxin as previously described [30]. Female mice (8 to 10-wks-old) were used since this sex has been shown to exhibit a more chronic course of disease [31]. Mice were monitored daily for signs of paralysis, and clinical scores recorded according to these criteria: 0 = no clinical signs; 1 = slightly limp tail; 2 = moderately limp tail; 3 = paralyzed tail; 4 = One hind limb paralyzed; 5 = both hind limbs paralyzed; 6 = hind limbs paralyzed, weakness in forelimbs; 7 = hind limbs paralyzed, one forelimb paralyzed; 8 = hind limbs paralyzed, both forelimbs paralyzed; 9 = moribund; 10 = death. After EAE for 30 d, mice were euthanized and perfused with 10% buffered formalin, followed by brain and spinal cord removal. These tissues were formalin fixed and paraffin embedded for sectioning at 5 mm intervals. The sections were deparaffinized and subjected to heat and pressure to expose antigens as previously described [32], then were either stained using hematoxylin and eosin (H&E), or stained for CD3 and non-phosphorylated neurofilament H (SMI-32) by immunohistochemistry as previously described [31]. Immunofluorescence for IL-17A was carried out using PE-anti-IL-17A (1:500) on the same slides as above, and tissue mounted in DAPI-containing VECTASHIELD® mounting media (Vector Labs). Quantification of immunohistochemistry or immunofluorescence was performed using ImageJ. For flow cytometry, EAE was carried out for 15 d or 30 d followed by sacrifice of mice, excision of cerebellum and spinal cords, and homogenization of tissues into single cell suspension using a GentleMACS™ Dissociator (Miltenyi/ThermoFisher). Cells were washed twice with RPMI in 15 mL conical tubes, counted using a Millipore Sceptor, plated into 96-well plates and flow cytometry carried out as described above.
Statistical analyses
Comparison of two means was carried out using an unpaired Student’s t test using GraphPad Prism version 4.0. In assays involving three or more groups a one-way ANOVA was used to analyze groups with Tukey post-test used to compare means of each group. All comparisons were considered significant at P < 0.05. GraphPad Prism was also used to generate standard curves with regression analyses from which values were calculated for sample measurements.
Results
Increased SELENOI during Th17 differentiation is required for upregulated RORγt expression
Since SELENOI is important for metabolic reprograming during TCR-induced activation as well as GPI anchor synthesis for cell surface Thy-1 levels [21, 33] that both contribute to Th17 differentiation, we investigated the role of SELENOI in Th17 differentiation. Naïve CD4+ T cells from WT C57BL/6 mice were activated using plate-bound anti-CD3/28 in Th17 conditions over 48 h, and SELENOI mRNA was found to increase at early time-points (0–24 h) similar to Th17 master transcriptional regulator, RORγt (Fig. 1A). We also measured levels of mRNA for IL-17A and TGF-β cytokines that indicate the more pathogenic and tolerogenic Th17 cells, respectively, finding that mRNA for both increased later (8–48 h) post-TCR stimulation. Consistent with the mRNA data above, western blot analysis showed that SELENOI protein levels were increased after 24 h TCR stimulation in Th17 conditions (Fig. 1B). Given the upregulated SELENOI observed during TCR activation in Th17 conditions, SELENOI loss-of-function investigations were carried out to determine the consequences of SELENOI deficiency during Th17 differentiation. WT and SELENOI KO CD4+ naïve T cells were isolated from mice and activated using anti-CD3/anti-CD28 in Th17 conditions for 24 h, followed by real-time PCR analysis. Results showed that SELENOI KO exerted some effects on the mRNA levels indicative of pathogenic and regulatory Th17 cells. Not all mRNAs of the various markers measured were found to differ between WT and KO CD4+ T cells activated in Th17 conditions, although IL-17A mRNA was decreased and TGFβ mRNA was increased in SELENOI KO T cells (Supplemental Fig. 1). The strongest effect of SELENOI KO was a significant decrease in RORγt mRNA (Fig. 1C). Furthermore, naïve CD4+ T cells that were TCR activated overnight in Th17 conditions followed by flow cytometric and western blot analyses showed that SELENOI KO reduced the number of RORγt+ T cells (Fig. 1D and Supplementary Fig. 2), suggesting that optimal expression of this master regulator of Th17 cells relies on SELENOI expression.
Figure 1.

SELENOI is upregulated during Th17 differentiation to promote increased RORγt expression. Naïve CD4+ T cells purified from C57BL/6 spleens were stimulated with plate-bound anti-CD3/anti-CD28 in the presence of TGF-β (2.5 ng/mL), IL-6 (20 ng/mL) and IL-23 (10 ng/mL). (A) Real-time PCR results for 4 different target mRNAs are shown normalized to housekeeping mRNA (ubc) with 4 replicates per timepoint. (B) Western blot analysis of SELENOI levels 24 h after TCR stimulation in Th17 conditions described above, including 2 biological replicates and β-actin as a loading control. (C) Real-time PCR analyses of WT and KO CD4+ naïve T cells unstimulated or TCR stimulated (24 h) in Th17 conditions. (D) Flow cytometry was used to analyze RORγt levels in WT and KO CD4+ T cells during Th17 differentiation. Means of replicates (N=4) were compared using a student’s t-test and expressed as median ± IQR with *p < 0.05.
SELENOI is required for binding of transcription factors to the RORC gene
Given the effects of SELENOI KO on decreased RORγt mRNA levels described above, we investigated how SELENOI deficiency may affect transcription of the gene encoding RORγt, RORC. We first used confocal immunofluoresence to evaluate nuclear levels of two key transcription factors driving transcription of RORC, SOX5 and STAT3, when naïve CD4+ T cells were activated in Th17 conditions. Results showed that nuclear SOX5 was slightly decreased in SELENOI KO T cells, while levels of STAT3 in nuclei were not significantly different between SELENOI KO and WT T cells (Figure 2A). ChIP assays were then carried out to analyze established RORC enhancer and promoter regions that serve as binding sites for STAT3 and SOX5 [34]. When SELENOI KO and WT naïve CD4+ T cells were activated in Th17 conditions for 18 h, ChIP assays revealed that SELENOI KO T led to reduced binding of both STAT3 and SOX5 to the enhancer and promoter regions compared to WT controls (Figure 2B). ChIP assays were carried out to determine binding of STAT5 transcription factor to established CNS0 and CNS2 distal and intronic enhancers of the FoxP3 gene, respectively (29). Results showed that KO T cells exhibited increased binding compared to WT T cells for STAT5 binding to both enhancer regions (Fig. 3). Thus, SELENOI is required for metabolic conditions that preferentially promote RORC transcription over FoxP3 transcription during Th17 differentiation.
Figure 2.

SELENOI KO decreases transcription of the RORγt gene (RORC) by reducing STAT3 and SOX5 binding to enhancer and promoter regions. WT and SELENOI KO naïve CD4+ T cells were nonactivated or activated for 18 h using anti-CD3/anti-CD28 in Th17 conditions. (A) Confocal immunofluorescence was used to analyze nuclear levels of STAT3 and SOX5. Results showed that levels of SOX5, but not STAT3, were slightly reduced in DAPI-positive nuclei of SELENOI KO T cells compared to WT controls. Scalebar = 10 μm. (B) ChIP assays were performed to determine the binding of STAT3 and SOX5 to established enhancer and promoter regions of the RORC gene after 18 h activation in Th17 conditions. The DNA/protein fraction prior to IP (i.e. input) was used as a template for real-time PCR, and the results of the real-time PCR from each ChIP were normalized to their corresponding input real-time PCR results as described in the Methods section. Means of replicates (N=10 fields/group in A; N=3–4 in B) were compared using a student’s t-test and expressed as median ± IQR with *p < 0.05.
Figure 3.

SELENOI KO increases STAT5 binding to enhancer regions of the FoxP3 gene. WT and SELENOI KO naïve CD4+ T cells were activated for 18 h using anti-CD3/anti-CD28 in Th17 conditions and ChIP assays were performed to determine the binding of STAT5 to established CNS0 and CNS2 enhancers in the FoxP3 gene. Results showed higher binding of STAT5 to both enhancers, but no differences in IPs using an isotype control antibody. Means of replicates (N=4) were compared using a student’s t-test and expressed as median ± IQR with *p < 0.05.
SELENOI deficiency favors differentiation into tolerant over inflammatory phenotypes
We next used flow cytometry to analyze the differentiation of WT and SELENOI KO CD4+ T cells activated in pro-inflammatory Th17 conditions 72 h. When activated in Th17-promoting conditions (IL-6, TGF-β, and IL-23), WT and KO CD4+ naïve T cells exhibited similar levels of CD4+ purity and viability, but IL-17A cytokine expression decreased by nearly 50% compared to WT controls (Fig. 4A–C). Other markers of inflammatory Th17 cells including IL-22 and IL-23 were decreased in KO T cells, while the tolerogenic marker IL-10 was slightly increased. Because Th17 cells can acquire a pathogenic or regulatory phenotype characterized by RORγt and FoxP3, respectively [35, 36], we analyzed these intracellular markers. SELENOI KO CD4+ T cells activated in Th17 conditions exhibited lower levels of pathogenic RORγt+ cells and higher levels of regulatory FoxP3+ cells compared to WT controls (Fig. 4D). Other inflammatory or tolerogenic Th cells were impacted by SELENOI expression as well. For example, in Th1-promoting conditions (IL-12 and IL-2) the KO T cells exhibited moderately lower levels of IFN-γ+ and T-bet+ cells (Supplemental Fig. 3A–B). Activation in Treg-promoting conditions (TGF-β and IL-2) led to a higher percentage of IL-10+ and CD25+FoxP3+ levels (Supplemental Fig. 3C–D). It is important to note the low numbers of Th1, Th17, and Treg cells arising from the use of true naïve CD3+CD4+CD44- T cells, but our results focusing on differentiation of naïve T helper cells are consistent with other studies [37, 38]. Moreover, these data suggest that SELENOI deficiency promotes CD4+ T cell differentiation toward a tolerogenic phenotype and away from an inflammatory phenotype.
Figure 4.

SELENOI deficiency skews CD4+ T cell differentiation away from a pathogenic Th17 phenotype. Purifed WT and SELENOI KO T naïve CD4+ cells isolated using magnetic beads were activated with plate-bound anti-CD3/28 under different culture conditions for 72 h as described in the Methods section. (A-B) The high purity and viability of CD4+ T cells prior to and after 72 h activation did not differ between WT and KO as confirmed by flow cytometry. (C-D) Naïve CD4+ T cells activated for 72 h in Th17 conditions that were confirmed as live CD4+ T cells as described above were analyzed for Th17 pathogeic and tolerogenic markers. Compared to WT controls, SELENOI KO CD4+ T cells showed significantly lower levels of IL-17A+, IL-22+, and IL-23+ cells, but higher levels of IL-10+ cells. KO were also lower in levels of RORγt+ cells, but higher in levels of FoxP3+ cells. Means of replicates (N=4) were compared using a student’s t-test and expressed as median ± IQR with *p < 0.05.
SELENOI deficiency protects mice from EAE and decreases pathogenic Th17 cells in vivo
An established protocol for inducing EAE was followed by inoculating female mice with emulsified adjuvant and MOG35–55, which is a component of the CNS and present on the surface of oligodendrocytes and myelin [39]. The time course and experimental readouts for the EAE protocol are shown in Fig. 5A. In the WT mice, the clinical scores showed an expected rise in disease severity ~days 9–15, followed by a partial recovery that developed into chronic pathology characterized by hind limb paralysis (Fig. 5B). In contrast, T cell-specific SELENOI KO mice were slightly delayed in disease onset along with significantly decreased severity during the peak of disease and improved recovery during chronic stages of disease.
Figure 5.

SELENOI deficiency in T cells protects mice from EAE. (A) A time course of EAE protocol including experimental readouts is shown. (B) Female (8–10 wks of age) T cell-specific SELENOI KO and WT mice subjected to EAE protocol were monitored daily for disease symptoms and scored as described in the Methods section. (C) Means of replicates (n=6 mice/group; data pooled from 2 independent experiments) were compared using a student’s t-test and expressed as median ± IQR with *p < 0.05.
Spinal cord and cerebellum tissue sections of WT and T cell-specific SELENOI KO mice were analyzed for levels of immunopathology. At the peak of disease (day 15), we found decreased levels of CD4+IL-17A+ T cells, but not CD4+IL-10+ T cells in CNS tissues of SELENOI T cell specific KO mice compared to WT controls (Figure 6). At day 30, lower levels of CNS inflammatory infiltrate were evident in T cell specific KO mice compared to WT controls using H&E staining (Supplemental Fig. 4). Analysis of cerebellum and spinal cord tissues from mice at day 30 of the EAE model revealed a lower frequency of CD3+ T cells in tissues from KO mice compared to WT controls (Fig. 7A). Levels of IL-17A staining was also lower in cerebellum and spinal cord tissues from KO mice subjected to EAE compared to WT controls (Fig. 7B). Injured axons within spinal cord tissue can be identified by SMI-32+ staining [31], which was analyzed in WT and T cell-specific SELENOI KO subjected to EAE. KO tissues exhibited lower levels of SMI-32+ axons in spinal cord white matter compared to WT controls (Fig. 7C).
Figure 6.

SELENOI KO in T cells preferentially reduces CD4+IL-17A+ T cell levels in CNS tissues of EAE mice. After 15 d on EAE protocol, female mice were sacrificed and cerebellum and spinal cord tissues were analyzed by flow cytometry for IL-17A+ and IL-10+ T cells. (A) Single cell suspensions were gated on CD3+CD4+ T cells, which were then analyzed for levels of IL-17A and IL-10 (B). Compared to WT controls, levels of CD4+IL-17A+ T cells were reduced by SELENOI KO but levels of CD4+IL-10+ T cells were unaffected. Means of replicates (N=6 in top panel, N=5 in bottom panel) were compared using a student’s t-test and expressed as median ± IQR with *p < 0.05.
Figure 7.

CNS tissues analyzed for T cell inflammation and lesions show that SELENOI deficiency reduces EAE. After 30 d on EAE protocol, female mouse were sacrificed and cerebellum and spinal cord tissues were analyzed by immunohistochemistry and immunofluorescence. (A) Representative images are shown along with quantification of CD3+ T cells (dark brown). (B) Representative images are shown along with quantification of IL-17A (red), with nuclei counterstained by DAPI (blue). (C) Representative images are shown along with quantification of SMI-32+ lesions (dark brown). Scalebar = 50 μm for 5A-C. Means of replicates (n=5 mice/group, 2 fields counted per mouse) were compared using a student’s t-test and expressed as median ± IQR with *p < 0.05.
Spinal cords and cerebellum were excised from WT and T cell-specific SELENOI KO mice at day 30 of the EAE model and analyzed for levels of RORγt+ versus FoxP3+ in CD4+ T cells. In these CNS tissues of EAE mice, the SELENOI T cell specific KO mice exhibited lower levels of CD4+RORγt+ T cells compared to WT controls (Fig. 8A). In contrast, SELENOI T cell specific KO mice showed higher levels of CD4+CD25+FoxP3+ T cells compared to WT controls (Fig. 8B). Thus, lower levels of pathogenic Th17 cells along with less severe immunopathology in CNS tissues were detected in T cell-specific SELENOI KO mice subjected to EAE compared to WT mice subjected to EAE.
Figure 8.
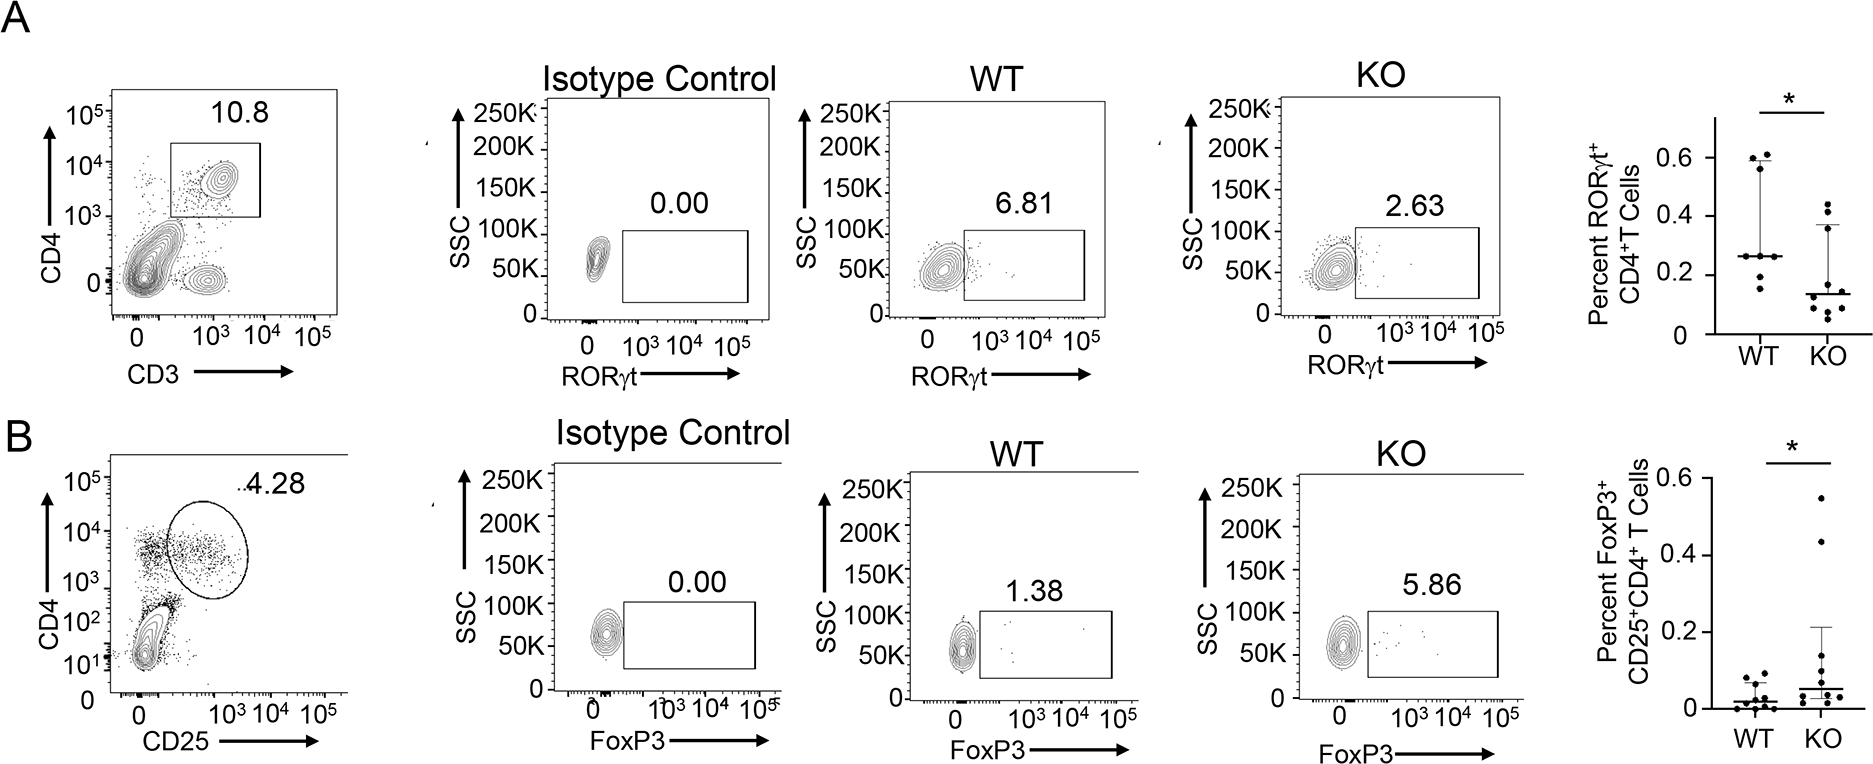
SELENOI deficiency in T cells favors a tolerogenic versus pathogenic T helper cell phenotype during EAE. Single cell suspensions from combined cerebellum and spinal cord tissues from each female mouse at day 30 in EAE protocol were analyzed by flow cytometry. (A) Pro-inflammatory CD4+RORγt+ T cells were calculated by multiplying CD3+CD4+ percentages by RORγt+ percentages. (B) Pro-tolerant CD4+CD25+FoxP3+ T cells were calculated by multiplying CD4+CD25+ percentages by FoxP3+ percentages. Means (n=8 mice/group) were compared using a student’s t-test and expressed as median ± IQR with *p < 0.05.
Discussion
The balance between Th17 and Treg cells is particularly important for promoting immunity to certain pathogens and maintaining mucosal barrier function while suppressing immune responses to self-antigens [40–42]. Treg cells have been suggested to be dedicated to the control of immune pathology and autoimmunity, substantiated by the finding that absence of the FoxP3 transcription factor that controls the generation of this subset results in a fatal autoimmune disorders [43]. Fatty acid oxidation has been shown to be important for Treg differentiation [44], but phospholipid synthesis pathways have not been well characterized for their influence on Th17/Treg differentiation. SELENOI is an enzyme involved in PE and plasmenyl PE synthesis, and all three have been shown to be upregulated upon TCR-stimulation of CD3+ T cells [21]. Our findings show that SELENOI KO during activation of naïve CD4+ T cells favors tolerogenic over pathogenic TH17 cells, promotes Treg differentiation, and protects mice from pathology in the mouse EAE model. Thus, SELENOI may represent a therapeutic target for treating MS or other autoimmune disorders, although the challenges of targeting this protein specifically in T cells and potential side-effects that may arise from such an approach must be considered.
While external factors such as cytokines and co-stimulatory molecules on antigen presenting cells are crucial for shaping T cell differentiation fates, metabolic shifts are also key for regulating Th17/Treg differentiation [45]. Transcription factors like c-Myc and HIF1α along with metabolic enzymes are critical in coordinating differentiation into different phenotypes, and our data herein implicate SELENOI as an additional factor regulating Th17/Treg differentiation. Th17 cells arising in different conditions or tissues may exhibit surprising plasticity and heterogeneity [36, 46], and Th17 cells have the potential to change their transcriptional profile and trans-differentiate into a potent immunosuppressive T cell subtype [47]. This altered phenotype is largely dependent on TGF-β and IL-10R signaling [48, 49], but our data show that metabolic pathways such as those in which SELENOI participates can influence the tolerogenic versus pathogenic phenotype of differentiating Th17 cells. Our previous work showed that SELENOI deficiency does not affect T cell viability, lipid raft organization, or TCR signaling; rather, a lack of this enzyme disrupts the metabolic reprograming required for generating energy and precursor molecules that drive proliferation [21, 50]. The data presented herein show that, in addition to proliferation, Th17 tolerogenic or pathogenic cell differentiation is also impacted by SELENOI deficiency.
It was established from the current studies that SELENOI is important for differentiation into the Th17 inflammatory phenotype by promoting STAT3 and SOX5 dependent RORγt transcription and protein expression However, precisely how SELENOI KO conditions lead to less SOX5 nuclear localization or RORC enhancer/promoter binding by these transcription factors was not definitively determined. There likely are several mechanisms contributing to this effect, including the ripple effect that decreased PE and plasmenyl PE synthesis has on disrupting multiple metabolic pathways as previously demonstrated [21, 51]. The importance of tightly controlled metabolism in Th17 differentiation has been well established [52]. In addition to metabolism, GPI anchored Thy-1 regulates RORγt expression [20]. GPI anchored proteins like Thy-1 have been shown to promote TCR-like signals in T cells [53, 54], but since SELENOI KO does not alter TCR signaling [21] the lowered Thy-1 on the surface of SELENOI KO T cells may instead contribute to lower RORγt transcription through metabolic pathways that converge at transcription factor activation including STAT3 and SOX5. Overall, the data from the current studies suggest that disruption of one step of ethanolamine phospholipid synthesis can tip the balance of inflammatory/tolerant Th17 cell phenotypes toward tolerance, which may reveal therapeutic targets for diseases like MS.
Supplementary Material
Acknowledgements
This research was supported by NIH grants R01AI147496, P20GM113134, P30GM131944, P30GM114737.
Abbreviations
- AAG
1-akyl, acylglycerol
- CNS
central nervous system
- DAG
diacylglycerol
- ER
endoplasmic reticulum
- EAE
experimental autoimmune encephalitis
- GPI
glycosylphosphatidylinositol
- H&E
hematoxylin and eosin
- ic
intracellular
- KO
knockout
- MS
multiple sclerosis
- MOG
myelin oligodendrocyte glycoprotein
- OCR
oxygen consumption rate
- PFA
paraformaldehyde
- PE
phosphatidylethanolamine
- SELENOI
Selenoprotein I
- TCR
T cell receptor
- Th17
T helper cell type 17
- Treg
T regulatory
- WT
wild-type
Footnotes
Conflict-of-Interest Disclosure
The authors declare no conflict of interests.
References
- 1.Chisolm DA and Weinmann AS (2018) Connections Between Metabolism and Epigenetics in Programming Cellular Differentiation. Annu Rev Immunol 36, 221–246. [DOI] [PubMed] [Google Scholar]
- 2.Loftus RM and Finlay DK (2016) Immunometabolism: Cellular Metabolism Turns Immune Regulator. J Biol Chem 291, 1–10. [DOI] [PMC free article] [PubMed] [Google Scholar]
- 3.Pawlak M, Ho AW, Kuchroo VK (2020) Cytokines and transcription factors in the differentiation of CD4(+) T helper cell subsets and induction of tissue inflammation and autoimmunity. Curr Opin Immunol 67, 57–67. [DOI] [PMC free article] [PubMed] [Google Scholar]
- 4.Harrington LE, Hatton RD, Mangan PR, Turner H, Murphy TL, Murphy KM, Weaver CT (2005) Interleukin 17-producing CD4+ effector T cells develop via a lineage distinct from the T helper type 1 and 2 lineages. Nat Immunol 6, 1123–32. [DOI] [PubMed] [Google Scholar]
- 5.Gaffen SL, Jain R, Garg AV, Cua DJ (2014) The IL-23-IL-17 immune axis: from mechanisms to therapeutic testing. Nat Rev Immunol 14, 585–600. [DOI] [PMC free article] [PubMed] [Google Scholar]
- 6.Ghoreschi K, Laurence A, Yang XP, Hirahara K, O’Shea JJ (2011) T helper 17 cell heterogeneity and pathogenicity in autoimmune disease. Trends Immunol 32, 395–401. [DOI] [PMC free article] [PubMed] [Google Scholar]
- 7.Wei L, Laurence A, Elias KM, O’Shea JJ (2007) IL-21 is produced by Th17 cells and drives IL-17 production in a STAT3-dependent manner. J Biol Chem 282, 34605–10. [DOI] [PMC free article] [PubMed] [Google Scholar]
- 8.Tanaka S, Suto A, Iwamoto T, Kashiwakuma D, Kagami S, Suzuki K, Takatori H, Tamachi T, Hirose K, Onodera A, Suzuki J, Ohara O, Yamashita M, Nakayama T, Nakajima H (2014) Sox5 and c-Maf cooperatively induce Th17 cell differentiation via RORgammat induction as downstream targets of Stat3. J Exp Med 211, 1857–74. [DOI] [PMC free article] [PubMed] [Google Scholar]
- 9.Nurieva R, Yang XO, Martinez G, Zhang Y, Panopoulos AD, Ma L, Schluns K, Tian Q, Watowich SS, Jetten AM, Dong C (2007) Essential autocrine regulation by IL-21 in the generation of inflammatory T cells. Nature 448, 480–3. [DOI] [PubMed] [Google Scholar]
- 10.Sakaguchi S, Sakaguchi N, Asano M, Itoh M, Toda M (1995) Immunologic self-tolerance maintained by activated T cells expressing IL-2 receptor alpha-chains (CD25). Breakdown of a single mechanism of self-tolerance causes various autoimmune diseases. J Immunol 155, 1151–64. [PubMed] [Google Scholar]
- 11.O’Shea JJ and Paul WE (2010) Mechanisms underlying lineage commitment and plasticity of helper CD4+ T cells. Science 327, 1098–102. [DOI] [PMC free article] [PubMed] [Google Scholar]
- 12.Yang XP, Ghoreschi K, Steward-Tharp SM, Rodriguez-Canales J, Zhu J, Grainger JR, Hirahara K, Sun HW, Wei L, Vahedi G, Kanno Y, O’Shea JJ, Laurence A (2011) Opposing regulation of the locus encoding IL-17 through direct, reciprocal actions of STAT3 and STAT5. Nat Immunol 12, 247–54. [DOI] [PMC free article] [PubMed] [Google Scholar]
- 13.Shen H and Shi LZ (2019) Metabolic regulation of TH17 cells. Mol Immunol 109, 81–87. [DOI] [PMC free article] [PubMed] [Google Scholar]
- 14.Araujo L, Khim P, Mkhikian H, Mortales CL, Demetriou M (2017) Glycolysis and glutaminolysis cooperatively control T cell function by limiting metabolite supply to N-glycosylation. Elife 6. [DOI] [PMC free article] [PubMed] [Google Scholar]
- 15.Berod L, Friedrich C, Nandan A, Freitag J, Hagemann S, Harmrolfs K, Sandouk A, Hesse C, Castro CN, Bahre H, Tschirner SK, Gorinski N, Gohmert M, Mayer CT, Huehn J, Ponimaskin E, Abraham WR, Muller R, Lochner M, Sparwasser T (2014) De novo fatty acid synthesis controls the fate between regulatory T and T helper 17 cells. Nat Med 20, 1327–33. [DOI] [PubMed] [Google Scholar]
- 16.Delgoffe GM, Kole TP, Zheng Y, Zarek PE, Matthews KL, Xiao B, Worley PF, Kozma SC, Powell JD (2009) The mTOR kinase differentially regulates effector and regulatory T cell lineage commitment. Immunity 30, 832–44. [DOI] [PMC free article] [PubMed] [Google Scholar]
- 17.Shin B, Benavides GA, Geng J, Koralov SB, Hu H, Darley-Usmar VM, Harrington LE (2020) Mitochondrial Oxidative Phosphorylation Regulates the Fate Decision between Pathogenic Th17 and Regulatory T Cells. Cell Rep 30, 1898–1909 e4. [DOI] [PMC free article] [PubMed] [Google Scholar]
- 18.Loertscher R and Lavery P (2002) The role of glycosyl phosphatidyl inositol (GPI)-anchored cell surface proteins in T-cell activation. Transpl Immunol 9, 93–6. [DOI] [PubMed] [Google Scholar]
- 19.Yang J, Zhan XZ, Malola J, Li ZY, Pawar JS, Zhang HT, Zha ZG (2020) The multiple roles of Thy-1 in cell differentiation and regeneration. Differentiation 113, 38–48. [DOI] [PubMed] [Google Scholar]
- 20.Furlong S, Coombs MRP, Ghassemi-Rad J, Hoskin DW (2018) Thy-1 (CD90) Signaling Preferentially Promotes RORgammat Expression and a Th17 Response. Front Cell Dev Biol 6, 158. [DOI] [PMC free article] [PubMed] [Google Scholar]
- 21.Ma C, Hoffmann FW, Marciel MP, Page KE, Williams-Aduja MA, Akana ENL, Gojanovich GS, Gerschenson M, Urschitz J, Moisyadi S, Khadka VS, Rozovsky S, Deng Y, Horgen FD, Hoffmann PR (2021) Upregulated ethanolamine phospholipid synthesis via selenoprotein I is required for effective metabolic reprogramming during T cell activation. Mol Metab 47, 101170. [DOI] [PMC free article] [PubMed] [Google Scholar]
- 22.Horibata Y and Hirabayashi Y (2007) Identification and characterization of human ethanolaminephosphotransferase1. J Lipid Res 48, 503–8. [DOI] [PubMed] [Google Scholar]
- 23.Vance JE (2018) Historical perspective: phosphatidylserine and phosphatidylethanolamine from the 1800s to the present. J Lipid Res 59, 923–944. [DOI] [PMC free article] [PubMed] [Google Scholar]
- 24.Menon AK and Stevens VL (1992) Phosphatidylethanolamine is the donor of the ethanolamine residue linking a glycosylphosphatidylinositol anchor to protein. J Biol Chem 267, 15277–80. [PubMed] [Google Scholar]
- 25.Manglani M, Gossa S, McGavern DB (2018) Leukocyte Isolation from Brain, Spinal Cord, and Meninges for Flow Cytometric Analysis. Curr Protoc Immunol 121, e44. [DOI] [PMC free article] [PubMed] [Google Scholar]
- 26.Verma S, Hoffmann FW, Kumar M, Huang Z, Roe K, Nguyen-Wu E, Hashimoto AS, Hoffmann PR (2011) Selenoprotein K knockout mice exhibit deficient calcium flux in immune cells and impaired immune responses. J Immunol 186, 2127–37. [DOI] [PMC free article] [PubMed] [Google Scholar]
- 27.Hoffmann PR, Hoge SC, Li PA, Hoffmann FW, Hashimoto AC, Berry MJ (2007) The selenoproteome exhibits widely varying, tissue-specific dependence on selenoprotein P for selenium supply. Nucleic Acids Res 35, 3963–73. [DOI] [PMC free article] [PubMed] [Google Scholar]
- 28.Hoffmann FW, Hashimoto AC, Shafer LA, Dow S, Berry MJ, Hoffmann PR (2010) Dietary selenium modulates activation and differentiation of CD4+ T cells in mice through a mechanism involving cellular free thiols. J Nutr 140, 1155–61. [DOI] [PMC free article] [PubMed] [Google Scholar]
- 29.Dikiy S, Li J, Bai L, Jiang M, Janke L, Zong X, Hao X, Hoyos B, Wang ZM, Xu B, Fan Y, Rudensky AY, Feng Y (2021) A distal Foxp3 enhancer enables interleukin-2 dependent thymic Treg cell lineage commitment for robust immune tolerance. Immunity 54, 931–946 e11. [DOI] [PMC free article] [PubMed] [Google Scholar]
- 30.Bittner S, Afzali AM, Wiendl H, Meuth SG (2014) Myelin oligodendrocyte glycoprotein (MOG35–55) induced experimental autoimmune encephalomyelitis (EAE) in C57BL/6 mice. J Vis Exp. [DOI] [PMC free article] [PubMed] [Google Scholar]
- 31.Drohomyrecky PC, Doroshenko ER, Akkermann R, Moshkova M, Yi TJ, Zhao FL, Ahn JJ, McGaha TL, Pahan K, Dunn SE (2019) Peroxisome Proliferator-Activated Receptor-delta Acts within Peripheral Myeloid Cells to Limit Th Cell Priming during Experimental Autoimmune Encephalomyelitis. J Immunol 203, 2588–2601. [DOI] [PubMed] [Google Scholar]
- 32.Huang Z, Rose AH, Hoffmann FW, Hashimoto AS, Bertino P, Denk T, Takano J, Iwata N, Saido TC, Hoffmann PR (2013) Calpastatin prevents NF-kappaB-mediated hyperactivation of macrophages and attenuates colitis. J Immunol 191, 3778–88. [DOI] [PMC free article] [PubMed] [Google Scholar]
- 33.Shan J, Jin H, Xu Y (2020) T Cell Metabolism: A New Perspective on Th17/Treg Cell Imbalance in Systemic Lupus Erythematosus. Front Immunol 11, 1027. [DOI] [PMC free article] [PubMed] [Google Scholar]
- 34.Tian Y, Han C, Wei Z, Dong H, Shen X, Cui Y, Fu X, Tian Z, Wang S, Zhou J, Yang D, Sun Y, Yuan J, Ni B, Wu Y (2021) SOX-5 activates a novel RORgammat enhancer to facilitate experimental autoimmune encephalomyelitis by promoting Th17 cell differentiation. Nat Commun 12, 481. [DOI] [PMC free article] [PubMed] [Google Scholar]
- 35.Veldhoen M, Hocking RJ, Atkins CJ, Locksley RM, Stockinger B (2006) TGFbeta in the context of an inflammatory cytokine milieu supports de novo differentiation of IL-17-producing T cells. Immunity 24, 179–89. [DOI] [PubMed] [Google Scholar]
- 36.Nakayamada S, Takahashi H, Kanno Y, O’Shea JJ (2012) Helper T cell diversity and plasticity. Curr Opin Immunol 24, 297–302. [DOI] [PMC free article] [PubMed] [Google Scholar]
- 37.Ivanov II, McKenzie BS, Zhou L, Tadokoro CE, Lepelley A, Lafaille JJ, Cua DJ, Littman DR (2006) The orphan nuclear receptor RORgammat directs the differentiation program of proinflammatory IL-17+ T helper cells. Cell 126, 1121–33. [DOI] [PubMed] [Google Scholar]
- 38.Jones GW, Stumhofer JS, Foster T, Twohig JP, Hertzog P, Topley N, Williams AS, Hunter CA, Jenkins BJ, Wang EC, Jones SA (2011) Naive and activated T cells display differential responsiveness to TL1A that affects Th17 generation, maintenance, and proliferation. FASEB J 25, 409–19. [DOI] [PMC free article] [PubMed] [Google Scholar]
- 39.Delarasse C, Smith P, Baker D, Amor S (2013) Novel pathogenic epitopes of myelin oligodendrocyte glycoprotein induce experimental autoimmune encephalomyelitis in C57BL/6 mice. Immunology 140, 456–64. [DOI] [PMC free article] [PubMed] [Google Scholar]
- 40.Nakae S, Komiyama Y, Nambu A, Sudo K, Iwase M, Homma I, Sekikawa K, Asano M, Iwakura Y (2002) Antigen-specific T cell sensitization is impaired in IL-17-deficient mice, causing suppression of allergic cellular and humoral responses. Immunity 17, 375–87. [DOI] [PubMed] [Google Scholar]
- 41.Chen Y, Thai P, Zhao YH, Ho YS, DeSouza MM, Wu R (2003) Stimulation of airway mucin gene expression by interleukin (IL)-17 through IL-6 paracrine/autocrine loop. J Biol Chem 278, 17036–43. [DOI] [PubMed] [Google Scholar]
- 42.Ogawa A, Andoh A, Araki Y, Bamba T, Fujiyama Y (2004) Neutralization of interleukin-17 aggravates dextran sulfate sodium-induced colitis in mice. Clin Immunol 110, 55–62. [DOI] [PubMed] [Google Scholar]
- 43.Sakaguchi S (2005) Naturally arising Foxp3-expressing CD25+CD4+ regulatory T cells in immunological tolerance to self and non-self. Nat Immunol 6, 345–52. [DOI] [PubMed] [Google Scholar]
- 44.Shi H and Chi H (2019) Metabolic Control of Treg Cell Stability, Plasticity, and Tissue-Specific Heterogeneity. Front Immunol 10, 2716. [DOI] [PMC free article] [PubMed] [Google Scholar]
- 45.Shi LZ, Wang R, Huang G, Vogel P, Neale G, Green DR, Chi H (2011) HIF1alpha-dependent glycolytic pathway orchestrates a metabolic checkpoint for the differentiation of TH17 and Treg cells. J Exp Med 208, 1367–76. [DOI] [PMC free article] [PubMed] [Google Scholar]
- 46.Krebs CF and Panzer U (2018) Plasticity and heterogeneity of Th17 in immune-mediated kidney diseases. J Autoimmun 87, 61–68. [DOI] [PubMed] [Google Scholar]
- 47.Gagliani N, Amezcua Vesely MC, Iseppon A, Brockmann L, Xu H, Palm NW, de Zoete MR, Licona-Limon P, Paiva RS, Ching T, Weaver C, Zi X, Pan X, Fan R, Garmire LX, Cotton MJ, Drier Y, Bernstein B, Geginat J, Stockinger B, Esplugues E, Huber S, Flavell RA (2015) Th17 cells transdifferentiate into regulatory T cells during resolution of inflammation. Nature 523, 221–5. [DOI] [PMC free article] [PubMed] [Google Scholar]
- 48.Brockmann L, Gagliani N, Steglich B, Giannou AD, Kempski J, Pelczar P, Geffken M, Mfarrej B, Huber F, Herkel J, Wan YY, Esplugues E, Battaglia M, Krebs CF, Flavell RA, Huber S (2017) IL-10 Receptor Signaling Is Essential for TR1 Cell Function In Vivo. J Immunol 198, 1130–1141. [DOI] [PMC free article] [PubMed] [Google Scholar]
- 49.Zhang S (2018) The role of transforming growth factor beta in T helper 17 differentiation. Immunology 155, 24–35. [DOI] [PMC free article] [PubMed] [Google Scholar]
- 50.Ma C, Martinez-Rodriguez V, Hoffmann PR (2021) Roles for Selenoprotein I and Ethanolamine Phospholipid Synthesis in T Cell Activation. Int J Mol Sci 22. [DOI] [PMC free article] [PubMed] [Google Scholar]
- 51.Fu G, Guy CS, Chapman NM, Palacios G, Wei J, Zhou P, Long L, Wang YD, Qian C, Dhungana Y, Huang H, Kc A, Shi H, Rankin S, Brown SA, Johnson A, Wakefield R, Robinson CG, Liu X, Sheyn A, Yu J, Jackowski S, Chi H (2021) Metabolic control of TFH cells and humoral immunity by phosphatidylethanolamine. Nature 595, 724–729. [DOI] [PMC free article] [PubMed] [Google Scholar]
- 52.Cribbs AP, Terlecki-Zaniewicz S, Philpott M, Baardman J, Ahern D, Lindow M, Obad S, Oerum H, Sampey B, Mander PK, Penn H, Wordsworth P, Bowness P, de Winther M, Prinjha RK, Feldmann M, Oppermann U (2020) Histone H3K27me3 demethylases regulate human Th17 cell development and effector functions by impacting on metabolism. Proc Natl Acad Sci U S A 117, 6056–6066. [DOI] [PMC free article] [PubMed] [Google Scholar]
- 53.Malek TR, Fleming TJ, Codias EK (1994) Regulation of T lymphocyte function by glycosylphosphatidylinositol (GPI)-anchored proteins. Semin Immunol 6, 105–13. [DOI] [PubMed] [Google Scholar]
- 54.Haeryfar SM, Al-Alwan MM, Mader JS, Rowden G, West KA, Hoskin DW (2003) Thy-1 signaling in the context of costimulation provided by dendritic cells provides signal 1 for T cell proliferation and cytotoxic effector molecule expression, but fails to trigger delivery of the lethal hit. J Immunol 171, 69–77. [DOI] [PubMed] [Google Scholar]
Associated Data
This section collects any data citations, data availability statements, or supplementary materials included in this article.