

Abstract
Rencofilstat (RCF) demonstrated antifibrotic effects in preclinical models and was safe and well tolerated in Phase 1 studies. The aim of this Phase 2a study was safety, tolerability, pharmacokinetics, and exploration of efficacy biomarkers in subjects with nonalcoholic steatohepatitis (NASH). This Phase 2a, multicenter, single‐blind, placebo‐controlled study randomized 49 presumed F2/F3 subjects to RCF 75 mg once daily (QD), RCF 225 mg QD, or placebo for 28 days. Primary safety and tolerability endpoints were explored using descriptive statistics with post hoc analyses comparing active to placebo groups. Pharmacokinetics were evaluated using population pharmacokinetics methods. Efficacy was explored using biomarkers, transcriptomics, and lipidomics. RCF was safe and well tolerated, with no safety signals identified. The most frequently reported treatment‐emergent adverse events were constipation, diarrhea, back pain, dizziness, and headache. No clinically significant changes in laboratory parameters were observed, and RCF pharmacokinetics were unchanged in subjects with NASH. Alanine transaminase (ALT) reduction was greater in active subjects than in placebo groups. Nonparametric analysis suggested that ALT reductions were statistically different in the 225‐mg cohort compared with matching placebo: −16.3 ± 25.5% versus −0.7 ± 13.4%, respectively. ProC3 and C6M reduction was statistically significant in groups having baseline ProC3 > 15.0 ng/ml. RCF was safe and well tolerated after 28 days in subjects with presumed F2/F3 NASH. Presence of NASH did not alter its pharmacokinetics. Reductions in ALT, ProC3, and C6M suggest direct antifibrotic effects with longer treatment duration. Reductions in key collagen genes support a mechanism of action via suppression and/or regression of collagen deposition. Conclusion: These results support advancement of rencofilstat into a larger and longer Phase 2b study.
INTRODUCTION
Nonalcoholic fatty liver disease (NAFLD) is characterized by fat accumulation in the liver and often is associated with obesity, insulin resistance, diabetes mellitus, dyslipidemia, hypertension, and other aspects of the metabolic syndrome.[ 1 , 2 ] Its global prevalence is estimated to be 24%, with the highest rates reported in South America (31%) and the Middle East (32%), with a prevalence in the United States approximated to be about 24%.[ 3 ] A more severe form of NAFLD, nonalcoholic steatohepatitis (NASH), shares many characteristics of NAFLD, but additionally includes liver inflammation, hepatocyte injury, and fibrosis.[ 2 , 4 , 5 ] Liver fibrosis in NASH has been directly linked to mortality via cirrhosis and cardiovascular disease,[ 6 ] but is also associated with an increased risk of hepatocellular carcinoma (HCC).[ 7 ] Recently, NASH has surpassed chronic hepatitis C as the most common indication for liver transplantation.[ 8 ] There are currently no US Food and Drug Administration–approved medications specifically for NAFLD or NASH, although there are many drug candidates in various phases of development.
Cyclophilins (Cyp) is a family of peptidyl‐prolyl cis‐trans isomerases that primarily regulate protein folding and trafficking. They specifically catalyze the cis‐trans isomerization of peptide bonds at proline residues, which alters protein folding, allowing cyclophilins to moderate structure and function of a vast array of proteins. There are 17 known Cyp in humans, with well‐documented roles in many physiologic and pathophysiologic processes. One mechanism of action for improvements in NASH is to prevent collagen synthesis via Cyp B inhibition, although anti‐inflammatory and mitochondrial pore mechanisms may also be involved via Cyp A and Cyp D inhibition, respectively.[ 9 ]
Rencofilstat (RCF, formerly known as CRV431) is a cyclophilin inhibitor. RCF is proposed to directly target the hepatotoxic effects of steatosis, including oxidative stress, cell injury, cell death, leukocyte recruitment and activation of infiltrating cells and resident macrophages, profibrogenic activation of hepatic stellate cells, fibrosis, and carcinogenic transformation of liver cells via CypB, CypA, and CypD inhibition.[ 9 ] RCF has consistently demonstrated the ability to prevent the progression of liver fibrosis in a variety of animal NASH models and in precision‐cut human liver slices. Preclinical studies demonstrated that RCF hepatic concentrations were 5‐fold to 10‐fold higher than whole blood concentrations, and clinical physiologically based pharmacokinetic modeling confirms at least a 10‐fold‐higher accumulation of RCF in the liver compared with whole blood. Preclinical studies reveal that RCF is a potent cyclophilin inhibitor with a half maximal inhibitory concentration (IC50) for Cyp inhibition that ranges from 3.2 to 9.5 ng/ml.[ 10 ] Phase 1 pharmacokinetic studies demonstrate that RCF doses between 75 mg and 225 mg per day achieve steady‐state concentrations that exceed IC50 values, especially in the liver. Preclinical toxicology and Phase 1 safety studies reveal no significant safety signals.
Hepion pharmaceuticals is currently developing RCF for both NASH and HCC. This paper reports results from the completed Phase 2a, multicenter, single‐blind, placebo‐controlled study (AMBITION) to evaluate the safety and tolerability of CRV431 dosed once daily (QD) in NASH‐induced F2 and F3 subjects. The study was designed to assess the safety, tolerability, and pharmacokinetics (PK) of RCF in subjects with NASH and explore noninvasive efficacy signals in order to power a larger Phase 2b trial.
METHODS
This multicenter, randomized, single‐blind, placebo‐controlled, Phase 2a study was conducted at 10 sites in the United States. Subjects were eligible for the study if they were between the ages of 18–75 years, capable of providing informed written consent, and were presumed to have F2 or F3 NASH based on abnormalities at Screening in the following NASH biomarkers: aspartate aminotransferase (AST) level > 20 IU/L, Pro‐C3 > 15.5 ng/ml, enhanced liver fibrosis (ELF) score > 9.8, and a vibration‐controlled transient elastography (VCTE) kPa value > 8.5 kPa. Key exclusion criteria included pregnancy or breastfeeding, known allergy to RCF, positive hepatitis B surface antigen, hepatitis C virus (HCV) antibodies (HCVAb), or human immunodeficiency virus antibodies. If the HCVAb test was positive, an HCV‐RNA test was performed. If the HCV‐RNA test was negative, the subject was allowed to participate in the study, as long as the subject met all other inclusion criteria and had never been treated for HCV or was treated > 2 years ago and achieved a sustained virologic response at that time. Subjects with cirrhosis were also excluded. Subjects with a platelet count < 150,000/ml, a hemoglobin A1c (HbA1c) > 9.5%, uncontrolled hypertension (systolic > 150 mm Hg or diastolic > 90 mm Hg), or an estimated glomerular filtration rate (eGFR) < 60 ml/min/1.73 m2 were also excluded. A full list of inclusion and exclusion criteria is provided in the Appendix A. The inclusion criteria were amended before the 225‐mg cohort recruitment, to require either a qualifying PRO‐C3 level or ELF score but not both. This protocol modification supported enrollment but decreased baseline liver enzymes and ProC3 in this cohort.
Subjects were recruited from clinical research centers associated with Summit Clinical Research. All subjects provided written informed consent. This study was conducted in accordance with 21 Code of Federal Regulations Part 312, Good Clinical Practice (CPMP/International Council on Harmonization/135/95), and with the ethical principles laid down in the Declaration of Helsinki and applicable regulatory requirements. The detailed study design, including inclusion and exclusion criteria, is registered with ClinicalTrials.gov (NCT04480710).
Randomization and blinding
Subjects were randomized 2:1 to receive RCF (75 or 225 mg) or placebo orally once daily as soft gelatin capsules. Randomization was based on a predefined computer‐generated randomization schedule generated by a non–study statistician. Using this randomization schedule, pharmacy staff or designee assigned treatment sequentially to each eligible subject within a given cohort. Subjects were randomized to ensure at least 12 subjects in each dose level of RCF and 6 subjects in each dose level of matching placebo completed the study through Day 42 procedures. A data safety monitoring board reviewed the safety and PK data of the 75‐mg cohort before subjects were recruited for the 225 mg cohort. Only subjects were blinded to treatment assignments.
Procedures
Subjects received placebo, RCF 75 mg or RCF 225 mg, orally in the form of 75‐mg soft‐gelatin capsules once daily in the morning in the fasted state. Safety and tolerability parameters, including adverse events (AEs), serious adverse events (SAEs), physical examinations including weight and height, concomitant medications, laboratory assessments including blood chemistry, hematology and coagulation, urinalysis, pregnancy screening, electrocardiogram (ECG), and vital sign assessments were determined at screening, with baseline assessed on Day 1 before drug administration and then weekly for 4 weeks. Whole‐blood PK samples were analyzed for RCF and its primary metabolites on Day 1 and Day 28.
Primary outcomes
The primary outcomes for the study were safety, tolerability, PK, and exploratory NASH biomarkers identified in subjects with presumed F2/F3 NASH.
Exploratory efficacy outcomes
Efficacy biomarkers were collected at baseline, after 28 days of daily oral administration of RCF, and at the end of study following a 14‐day observation period. Biomarkers were included to assess antifibrotic mechanisms in subjects with presumed F2/F3 NASH. Due to the short duration of the trial, robust changes in traditional biomarkers of fibrosis such as ELF score, FibroScan, alanine aminotransferase (ALT), or Pro‐C3 were not anticipated, and liver biopsy was not ethical for this short observation period. However, a host of biomarkers were measured to confirm the mechanism of action of RCF and to assess the potential for therapeutic success in a longer and larger Phase 2b trial. Biomarkers presented in this report include the following: ALT, Pro‐C3, collagen biomarkers (C1M, Pro‐C3, C3M, Pro‐C3/C3M ratio, C4M, Pro‐C4, Pro‐C5, Pro‐C6, C6M, Pro‐C6/C6M ratio, and C‐Reactive Protein degraded by matrix Metalloprotease [CRPM]), and whole‐blood RNA transcriptomics.
Statistical methods
Continuous variables were summarized by presenting the number of non‐missing observations, mean, SD, median, minimum, and maximum. Categorical variables were summarized by presenting the number of subjects and percentages for each category. Efficacy endpoints were all exploratory in this study and included the absolute and percent change from baseline for AST and ALT, Pro‐C3, ELF score, and FibroScan score. Further exploratory efficacy analyses included parametric analysis of variance (ANOVA)/analysis of covariance for repeated partial measures using PROC GLM with Bonferroni multiplicity correction. In the presence of a nonnormal distribution or if the sample size was too small to accurately assess the distribution, nonparametric tests including Friedman ANOVA for repeated partial measures with or without ranking or Savage ANOVA were performed using PROC NPAR1WAY. Statistical analyses were performed using SAS for Windows statistical software, version 9.4 or higher.
Population PK analyses were performed in Nonmem version 7.5 (ICON PLC) using Pirana version 3.0 (Certara) running Perl Speaks Nonmem (PsN 5.2.6) and R version 4.1.0. The final model was selected based on the minimization of the objective function (−2LL), Akaike, and Bayesian (Schwarz) criteria and %RSE combined with visual inspection of the residuals (weighted and conditional), visual predictive check, and observed versus predicted plots. The best model was used to predict concentrations in the subjects with NASH out to 816 h. The nonliner mixed effect (NLME) estimation method used was first‐order condition estimation with interaction. Confidence intervals were obtained via a jackknife bootstrap (n = 500 runs).
RNA sequencing was performed using whole‐blood samples stabilized for RNase in Tempus tubes. Sequencing was performed by Canopy Biosciences targeting 60 M paired‐end reads. Differentially expressed gene (DEG) analysis was analyzed by Hepion Pharmaceuticals using the quasi‐mapping, two‐phased inference algorithms implemented in Salmon[ 11 ] with DEG performed in R v4.1.0 using DESEq[ 12 ] or edgeR[ 13 ] after testing for bias.
CTI Clinical Trial and Consulting Services performed all safety statistical analyses. Hepion Pharmaceuticals performed the popPK analysis with additional analyses of efficacy and biomarker data.
RESULTS
A total of 181 subjects were screened at 10 sites in the United States, with 49 subjects randomly assigned between August 3, 2020, and June 29, 2021, to receive RCF 75 mg (n = 15), RCF 225 mg (n = 18), or placebo (pooled = 16). A total of 47 subjects were included in the safety analysis (Figure 1).
FIGURE 1.

Disposition of subjects. PK, pharmacokinetics.
Subject demographics for the safety data set are summarized in Table 1. The study population had a mean age ranging from 54 to 61.8 years across the different dosing cohorts, and was generally well‐balanced with the exception of gender in the placebo group given three capsules. Most subjects were White and of Hispanic or Latino ethnicity. The mean body mass index BMI ranged from 36.1 to 39.2 kg/m2, with an overall BMI range from 24.6 to 56.7 kg/m2. No baseline differences were detected among the treatment cohorts, although ALT and AST approached statistical significance, suggesting a potentially important difference in baselines between the RCF 75 mg/placebo 1 capsule and the RCF225 mg/placebo 3 capsule groups. Concomitant medications are included to demonstrate the safety of RCF in the presence of commonly prescribed medications in subjects with NASH.
TABLE 1.
Demographics
| Characteristic | Placebo 1 cap (N = 6) | RCF 75 mg (N = 15) | Placebo 3 cap (N = 9) | RCF 225 mg (N = 17) | p |
|---|---|---|---|---|---|
| Age (years) | 61.8 ± 8.7 | 59.1 ± 9.9 | 61.1 ± 13.8 | 54.0 ± 13.3 | 0.37 |
| Gender, n (%) | |||||
| Male | 3 (50%) | 7 (46.7%) | 7 (77.8%) | 7 (41.2%) | |
| Female | 3 (50%) | 8 (53.3%) | 2 (22.2%) | 10 (58.8%) | |
| Race, n (%) | |||||
| White | 5 (83.3%) | 14 (93.3%) | 9 (100%) | 17 (100%) | |
| Other | 1 (16.7%) | 1 (6.7%) | 0 (0%) | 0 (0%) | |
| Ethnicity, n (%) | |||||
| Hispanic or Latino | 3 (50%) | 6 (40%) | 6 (66.7%) | 10 (58.8%) | |
| Not Hispanic or Latino | 3 (50%) | 9 (60%) | 3 (33.3%) | 7 (41.2%) | |
| Weight (kg) | 100.2 ± 22.9 | 104.5 ± 22.6 | 118.3 ± 31.2 | 106.6 ± 20.0 | 0.45 |
| BMI (kg/m2) | 36.1 ± 6.5 | 37.1 ± 8.5 | 39.2 ± 10.6 | 37.7 ± 6.4 | 0.89 |
| ALT (IU/L) | 75.8 ± 36.8 | 62.5 ± 42.1 | 52.9 ± 35.6 | 39.3 ± 18.4 | 0.05 |
| AST (IU/L) | 70.2 ± 40.1 | 51.9 ± 35.3 | 44.7 ± 36.0 | 33.1 ± 14.3 | 0.07 |
| Pro‐C3 (ng/L) | |||||
| n | 5 | 15 | 8 | 14 | |
| Mean ± SD | 23,190 ± 10,554 | 23,147 ± 6883 | 18,563 ± 5842 | 19,936 ± 9073 | 0.49 |
| ELF score | |||||
| N | 6 | 15 | 8 | 16 | |
| Mean ± SD | 10.1 ± 0.4 | 10.3 ± 0.8 | 9.7 ± 1.0 | 9.8 ± 0.9 | 0.27 |
| FibroScan fibrosis (kPa) | |||||
| n | 6 | 15 | 9 | 16 | |
| Mean ± SD | 21.8 ± 20.6 | 18.8 ± 16.1 | 23.0 ± 20.7 | 13.6 ± 5.4 | 0.45 |
| FibroScan steatosis (dB/m) | |||||
| N | 6 | 9 | 16 | ||
| Mean ± SD | 351.0 ± 29.2 | 353.2 ± 34.8 | 341.1 ± 55.6 | 329.4 ± 49.1 | 0.48 |
| Proton pump inhibitors | 5 (35.7%) | 2(33.3%) | 2 (25%) | 8 (61.5%) | |
| HMG COA RI | 7 (50%) | 4(66.7%) | 6 (75%) | 8 (61.5%) | |
| HMG COA RI + lipid‐modifying agents | 1 (7.1%) | 0 (0%) | 0 (0%) | 0 (0%) | |
| Platelet aggregation inhibitors excl. heparin | 6 (42.9%) | 1 (16.7%) | 3 (37.5%) | 8 (61.5%) | |
| Biguanides | 5 (35.7%) | 3 (50%) | 6 (75%) | 7 (53.8%) | |
| ARBs, plain | 4 (25.6%) | 3 (50%) | 1 (12.5%) | 4 (30.8%) | |
| ARBs + diuretics | 0 (0%) | 0 (0%) | 2 (25%) | 0 (0%) | |
| ARBs + CCB | 0 (0%) | 0 (0%) | 0 (0%) | 1 (7.7%) | |
| ACEi, plain | 3 (21.4%) | 2 (33.3%) | 4 (50%) | 4 (30.8%) | |
| ACEi + diuretics | 2 (14.3%) | 0 (0%) | 0 (0%) | 0 (0%) | |
| ACEi + CCB | 0 (0%) | 0 (0%) | 1 (12.5%) | 0 (0%) |
Note: Values are defined as LSMEANS ± SD. Percentages are based on the number of subjects in the Safety Set in each treatment group (N).
Abbreviations: ACEi, angiotensin converting enzyme inhibitors; ALT, alanine transaminase; ARBs, angiotensin II receptor blockers; AST, aspartate aminotransferase; BMI, body mass index; CCB, calcium channel blockers; ELF, enhanced liver fibrosis; cap, capsule; HMG COA RI, HMG‐CoA reductase inhibitors(statins); N, number of subjects in each treatment group; n, number of subjects in the category. Source: HEPA‐CRV431‐201 Ambition Trial CSR.
Safety
Treatment‐emergence adverse events (TEAEs) are summarized in Table 2. A total of 21 (44.7%) subjects experienced 36 TEAEs. Sixteen (34.0%) subjects had 25 TEAEs unrelated to the study drug; 2 (4.3%) subjects had two TEAEs possibly related to the study drug; and 5 (10.6%) subjects had nine TEAEs probably related to the study drug as determined by the Investigators. Most TEAEs (35 of 36; 97.2%) were graded as mild to moderate, with 1 classified as severe. There were no deaths or treatment‐emergent SAEs (TESAEs) during the study.
TABLE 2.
Treatment‐emergent adverse events
| System organ class Preferred term | Placebo 1 cap (N = 6) | RCF 75 mg (N = 15) | Placebo 3 cap (N = 9) | RCF 225 mg (N = 17) |
|---|---|---|---|---|
| Subjects with any TEAE | 3 (50.0%) | 5 (33.3%) | 3 (33.3%) | 10 (58.8%) |
| Gastrointestinal disorders | 0 (0%) | 1 (6.7%) | 2 (22.2%) | 5 (29.4%) |
| Constipation | 0 (0%) | 1 (6.7%) | 1 (11.1%) | 2 (11.8%) |
| Diarrhea | 0 (0%) | 0 (0%) | 0 (0%) | 2 (11.8%) |
| Musculoskeletal disorders | 1 (16.7%) | 2 (13.3%) | 0 (0%) | 2 (11.8%) |
| Back pain | 1 (16.7%) | 0 (0%) | 0 (0%) | 1 (5.9%) |
| Nervous system disorders | 1 (16.7%) | 1 (6.7%) | 0 (0%) | 2 (11.8%) |
| Dizziness | 1 (16.7%) | 0 (0%) | 0 (0%) | 1 (5.9%) |
| Headache | 1 (16.7%) | 0 (0%) | 0 (0%) | 1 (5.9%) |
Note: All data are presented as n (%). Percentages are based on the number of subjects in the Safety Set in each treatment group (N).
Abbreviations: PT, preferred term; TEAE, treatment‐emergent adverse event.
Source: HEPA‐CRV431‐201 Ambition Trial CSR.
PK of rencofilstat in NASH versus healthy subjects
Whole‐blood RCF concentrations in NASH were compared with healthy subjects and depicted in Figure 2. Visual inspection of the concentration versus time curves suggests that RCF achieves maximum concentrations within 2–8 h after dosing. Subjects with NASH have very similar whole‐blood concentrations to healthy subjects at 75 mg QD, while slightly higher exposure was observed at 225 mg QD, although this was not statistically significant. PK were analyzed using nonlinear mixed‐effects modeling and compared with the Phase 1 multiple ascending dose study.
FIGURE 2.

Rencofilstat (RCF) whole‐blood concentrations versus time in subjects with nonalcoholic steatohepatitis (NASH) and healthy subjects (mean ± SD).
The overall estimates for clearance after oral administration (CL/F) and volume central compartment after oral administration (VC/F) are in good agreement with parameter estimates from pooled 75‐mg and 225‐mg doses of RCF in healthy subjects of 4.3 ± 0.57 L/h and 202.1 ± 43.7 L, respectively. This confirmed that the effective half‐life of elimination for RCF in subjects with F2/F3 NASH was 33.7 ± 11.1 h. RCF PK are not significantly altered in subjects with F2/F3 NASH.
Exploratory efficacy
Descriptive statistics for key efficacy biomarkers measured in the study are summarized in Table 3. Next, ALT and Pro‐C3 are analyzed further. Collagen biomarkers C1M, C6M, and Pro‐C8 demonstrate non–statistically significant reductions over 28 days in the active treatment arms. VCTE kPa demonstrated a reduction over 28 days in all active and placebo groups, whereas VCTE with controlled attenuation parameter results were unchanged. Serum ALT demonstrated greater reduction by Day 28 in both active treatment cohorts compared with the comparably dosed placebo (Figure 3). Due to the differences in baseline ALT, all four cohorts are presented. Nonparametric analysis (Savage ANOVA) revealed that on Day 28 the 225‐mg QD cohort was statistically different from both the 75‐mg and placebo 1 capsule cohorts (exact p = 0.017).
TABLE 3.
Descriptive summary of key efficacy biomarkers
| Day 1 | Day 14 | Day 28 | Day 42 | ||||||
|---|---|---|---|---|---|---|---|---|---|
| ALT (IU/L) | N | Mean | SD | Mean | SD | Mean | SD | Mean | SD |
| RCF 225 mg | 16 | 36.06 | 15.74 | 31.59 | 13.73 | 30.56 | 15.99 | 33.75 | 14.18 |
| RCF 75 mg | 15 | 60.53 | 39.07 | 47.00 | 25.15 | 42.50 | 22.50 | 50.00 | 30.19 |
| Placebo, 1 capsule | 6 | 70.67 | 32.43 | 72.83 | 37.04 | 68.50 | 28.42 | 63.17 | 27.18 |
| Placebo, 3 capsules | 9 | 50.89 | 33.55 | 40.00 | 16.20 | 36.88 | 15.58 | 37.75 | 15.38 |
| AST (IU/L) | N | Mean | SD | Mean | SD | Mean | SD | Mean | SD |
| RCF 225 mg | 16 | 31.94 | 13.11 | 32.82 | 16.3 | 32.38 | 14.84 | 31.38 | 14.89 |
| RCF 75 mg | 15 | 49.47 | 30.78 | 39.42 | 16.49 | 35.08 | 14.37 | 41.45 | 20.85 |
| Placebo, 1 capsule | 6 | 61.17 | 29.23 | 62 | 34.52 | 59.5 | 24.56 | 50.50 | 19.86 |
| Placebo, 3 capsules | 9 | 44.00 | 35.14 | 29.88 | 8.13 | 30.13 | 9.95 | 29.25 | 7.29 |
| Pro‐C3 (pg/ml) | N | Mean | Std | Mean | Std | Mean | Std | Mean | Std |
| RCF 225 mg | 15 | 24413.33 | 20491.56 | 22418.75 | 18792.59 | 24043.75 | 19538.95 | 20026.67 | 10840.69 |
| RCF 75 mg | 14 | 23792.86 | 8204.45 | 22916.67 | 6887.52 | 22933.33 | 7686.15 | 21,350 | 9840.87 |
| Placebo, 1 capsule | 5 | 29540.00 | 5942.89 | 26900.00 | 8248.64 | 29533.33 | 9028.1 | 27116.67 | 6450.25 |
| Placebo, 3 capsules | 8 | 17512.5 | 5334.64 | 16600.00 | 3816.13 | 17,800 | 4701.37 | 17385.71 | 2921.43 |
| C1M (pg/ml) | N | Mean | Std | Mean | Std | Mean | Std | Mean | Std |
| RCF 225 mg | 16 | 70262.50 | 41561.90 | 55843.75 | 34060.55 | 62100.00 | 37891.9 | 69850.00 | 44243.34 |
| RCF 75 mg | 14 | 90185.71 | 56195.51 | 80125.00 | 35655.27 | 70490.91 | 35336.71 | 65309.09 | 28876.27 |
| Placebo, 1 capsule | 5 | 74040.00 | 40121.42 | 64216.67 | 44570.95 | 69233.33 | 48712.49 | 52666.67 | 19646.34 |
| Placebo, 3 capsules | 8 | 65712.50 | 42816.53 | 71,050 | 42844.7 | 69850.00 | 48911.64 | 67150.00 | 34374.28 |
| C6M (pg/ml) | N | Mean | Std | Mean | Std | Mean | Std | Mean | Std |
| RCF 225 mg | 16 | 31406.25 | 11275.78 | 29168.75 | 10683.61 | 31362.5 | 10693.67 | 33168.75 | 11966.44 |
| RCF 75 mg | 14 | 25142.86 | 7193.24 | 25825.00 | 7533.46 | 23354.55 | 3910.08 | 23783.33 | 3522.35 |
| Placebo, 1 capsule | 5 | 25480.00 | 7158 | 27833.33 | 9336.95 | 27850.00 | 7908.16 | 26883.33 | 4951.53 |
| Placebo, 3 capsules | 8 | 34012.50 | 10323.27 | 36300.00 | 7943.55 | 36250.00 | 9855.09 | 36400.00 | 8814.92 |
| PRO‐C8 (pg/ml) | N | Mean | Std | Mean | Std | Mean | Std | Mean | Std |
| RCF 225 mg | 15 | 4693.33 | 3192.90 | 4138.13 | 2792.36 | 4416.88 | 3331.62 | 4712.94 | 3381.66 |
| RCF 75 mg | 15 | 4985.33 | 2809.75 | 4693.33 | 2743.01 | 4683.33 | 2590.6 | 4923.33 | 2353.2 |
| Placebo, 1 capsule | 6 | 3191.67 | 1445.99 | 3236.67 | 1699.74 | 3260.00 | 1445.59 | 3106.67 | 1385.68 |
| Placebo, 3 capsules | 8 | 6032.50 | 5087.42 | 6257.50 | 4773.09 | 6018.75 | 4183.39 | 5805.00 | 3834.44 |
| FibroScan: fibrosis | |||||||||
| RCF 225 mg | 16 | 13.62 | 5.36 | 12.05 | 4.59 | ||||
| RCF 75 mg | 14 | 18.76 | 16.74 | 13.84 | 6.00 | ||||
| Placebo, 1 capsule | 6 | 21.80 | 20.60 | 16.90 | 14.40 | ||||
| Placebo, 3 capsules | 8 | 23.01 | 20.65 | 15.58 | 7.93 | ||||
| FibroScan: steatosis | |||||||||
| RCF 225 mg | 16 | 329.44 | 49.14 | 328.88 | 56.93 | ||||
| RCF 75 mg | 14 | 354.08 | 36.02 | 336.83 | 45.52 | ||||
| Placebo, 1 capsule | 6 | 351.00 | 29.20 | 341.83 | 38.32 | ||||
| Placebo, 3 capsules | 8 | 341.11 | 55.56 | 333.50 | 49.18 | ||||
FIGURE 3.
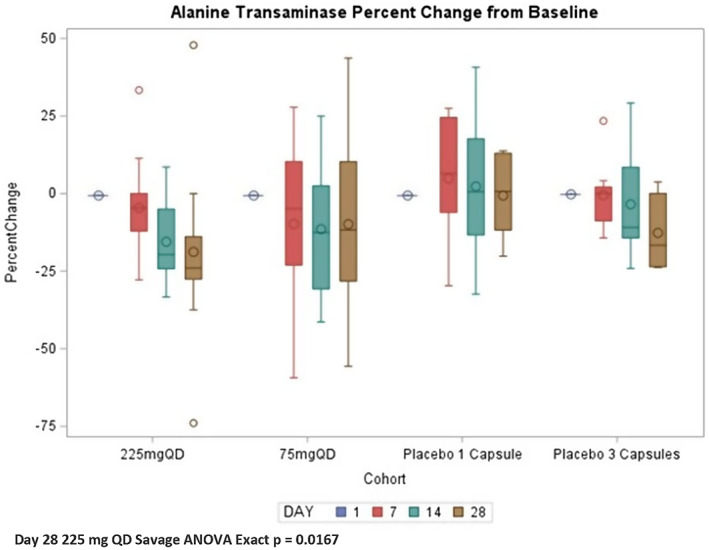
Serum alanine transaminase by cohort and day. ANOVA, analysis of variance; QD, once daily.
Overall, plasma Pro‐C3 did not show a clear response over 28 days of dosing when compared with placebo; however, analysis of all subjects with a baseline Pro‐C3 ≥ 15.0 ng/ml did demonstrate a dose response greater than placebo for both doses of RCF. Previous NASH research has indicated that those subjects with baseline Pro‐C3 above 15.0 ng/ml have more advanced fibrosis, and these individuals would be the most appropriate clinical targets for rencofilstat.[ 14 , 15 ] Placebo cohorts were pooled for clarity in Figure 4.
FIGURE 4.

Plasma PRO‐C3 (ng/ml) by cohort and day for subjects with PRO‐C3 baseline >15 ng/ml.
Additional collagen biomarkers demonstrated a similar pattern when stratified by Pro‐C3 baseline ≥ 15.0 ng/ml, with reductions in C1M, C3M, C4M, C7M, and Pro‐C8; however, only C6M demonstrated a statistically significant reduction in the 225‐mg cohort on Day 28 (placebo = 8.7 ± 15.2 ng/ml vs. 225 mg = −5.8 ± 9.9 ng/ml; p = 0.0176).
Transcriptomics
RNA sequencing demonstrated statistically significant down‐regulation of several collagen genes summarized in Table 4. All Gene Ontology (GO) domains were in the cellular component and in the collagen containing extracellular matrix with a GO ID of 0062023.
TABLE 4.
Statistically significant collagen genes via edgeR and GeneWalk
| HGNC symbol | edgeR Log2FC | edgeR p value | HGNC ID | Ncon gene | Ncon GO | Global padj | p value |
|---|---|---|---|---|---|---|---|
| COL18A1 | −3.1 | 0.034 | 2195 | 47 | 66 | 0.052 | 0.008 |
| COL6A5 | −2.2 | 0.043 | 26,674 | 12 | 66 | 0.080 | 0.031 |
| COL7A1 | −4.7 | 0.001 | 2214 | 45 | 66 | 0.055 | 0.011 |
| COL8A2 | −4.8 | 0.001 | 2216 | 33 | 66 | 0.055 | 0.014 |
Abbreviations: GO, Gene Ontology; HGNC, HUGO Gene Nomenclature Committee; Ncon genes, number of communication genes; NconGO, number of GO genes; global_padj, false discovery rate.
DISCUSSION
This study represents the first clinical use of Rencofilstat in subjects with presumptive F2/F3 NASH. The duration of treatment for 28 days allowed a direct comparison to healthy subjects in the multiple‐ascending dose trial (CTRV‐CRV431‐101) on the two primary endpoints of safety and PK.
No safety signals were identified during this trial of RCF in subjects with NASH. This is consistent with both the preclinical toxicology data as well as the Phase 1 program in healthy subjects. The most frequently reported TEAEs were constipation, diarrhea, back pain, dizziness, and headache. There were no clinically significant changes or changes from baseline observed in any of the laboratory parameters (hematology, coagulation, blood chemistry, liver biochemical tests, urinalysis), vital signs (except one occurrence of body temperature decreased), pulse oximetry, or ECG findings, with the exception of one event of hypercholesterolemia in the 225‐mg group and one event of increased blood pressure in the 225‐mg group. No deaths or TESAEs were reported during the study. These safety results in subjects with NASH are in alignment with the Phase 1 program in healthy subjects. Constipation requiring treatment with polyethylene glycol 3350 is the only AE that was reported in both the Phase 1 program and this Phase 2a trial. No deaths or TESAEs were reported during the study. Overall, these results demonstrate that RCF is well tolerated at dose levels of 75 mg and 225 mg for up to 28 days and has a favorable safety profile in this study population with F2/F3 fibrosis that reflects the target indication population.
Rencofilstat exposure in subjects with presumed F2/F3 NASH was similar to the exposure observed in healthy subjects (Figure 2). This was confirmed by nearly identical drug clearance (CL/F) and volume of distribution (Vc/F) determined in NASH and healthy subjects. The elimination half‐life (T1/2) derived from these estimates was 33.7 ± 11.1 h, which supports QD dosing.
Biomarker efficacy
ALT levels observed during the study demonstrated a nonsignificant reduction over the 28 days of active treatment. Although nonnormally distributed with significant outliers in several treatment cohorts, both the 225‐mg and 75‐mg cohorts demonstrated a mean percent reduction on Day 28 of −16.31 ± 25.50% and −18.36 ± 25.75%, respectively. The corresponding placebo groups with three capsules and one capsule demonstrated a reduction of −10.24 ± 12.32% and −0.65 ± 13.44%, respectively, revealing greater reduction of ALT in the active treatment groups. The 75‐mg cohort entered the study with a higher baseline ALT of 62.52 ± 42.06 IU/L compared with the 225‐mg cohort of 36.06 ± 15.74 IU/L. The higher baseline in the 75‐mg cohort may reflect a difference in subjects in this cohort having greater liver inflammation or more active disease and could explain the slightly greater mean reduction in ALT in this cohort compared with the 225‐mg dose. However, variability in ALT was less in the 225‐mg cohort with increasing reduction from day 7 to day 28. This is consistent with a more reliable effect on ALT in the 225‐mg versus the 75‐mg cohort, in which the 75‐mg cohort had greater outliers and fewer ALT responders. Nonparametric analysis did suggest that only the 225‐mg QD cohort was statistically different than the other cohorts. No statistically significant changes were observed in VCTE or ELF measurements, as expected for this short 28‐day observation time.
Collagens are the main constituents of the fibrotic extracellular matrix (ECM) and are heavily represented in accumulation fibrosis.[ 16 ] Pro‐C3 has emerged as biomarker, which is predictive of fibrosis progression in HCV[ 17 ] and NASH and has been used as a biomarker in at least two Phase 2 trials.[ 18 , 19 ] In these published studies, elevations in Pro‐C3 from baseline are the most predictive of disease progression. The original inclusion criteria of this trial used a Pro‐C3 baseline of 15.5 combined with an ELF score > 9.8; however, this was amended to a Pro‐C3 baseline ≥ 15.5 or an ELF score ≥ 9.8 for the 225‐mg cohort to aide in recruitment of subjects. This change allowed subjects to enter the study with a lower Pro‐C3 baseline and may have influenced the overall effectiveness of Pro‐C3 as a biomarker. Stratification of the data into those subjects with Pro‐C3 > 15.0 demonstrated a statistically significant reduction in Pro‐C3 even over 28 days. In the same group with Pro‐C3 > 15.0 ng/ml, several other collagen biomarkers demonstrated clinically relevant reductions over the 28‐day study. However, only C6M achieved statistical significance by Day 28.
C6M as a biomarker detects a fragment generated by matrix metalloproteinase (MMP)–2 and MMP‐9 cleavage of type VI collagen, and serum levels have been shown to be increased in liver fibrosis.[ 20 ] In a study by Karsdal et al., Pro‐C3 and C6M both emerged as predictors of liver fibrosis progression. However, it was only in subjects with high baseline Pro‐C3 and C6M that these biomarkers were independent predictors of fibrosis progression, with individual odds ratios of 19.4 (p = 0.003) and 11.6 (p = 0.011) for subjects with baseline levels of Pro‐C3 > 22.4 and C6M > 11.6 ng/ml, respectively.[ 21 ] In this study, Pro‐C3 and C6M baselines were above these elevated baselines in over half of the subjects, suggesting that a reduction in both Pro‐C3 and C6M reported here with 28 days of RCF use could predict a lack of disease progression for subjects with advanced NASH.
Changes in the transcriptome were anticipated to reveal the greatest impact of pharmacodynamic activity of RCF in subjects with NASH due to the short duration of this Phase 2a study. Initial results of the differential gene expression confirmed down‐regulation of several clinically relevant collagen genes. This finding was consistent with the preclinical animal models and precision‐cut human liver slices. The transcriptome changes confirm the hypothesis that cyclophilin inhibition with RCF results in an antifibrotic effect through the reduction of collagen formation. In this study, COL6A5, COL7A1, COL8A2, and COL18A1 were all down‐regulated with log2‐fold changes greater than −2.2. Gene enrichment using the GeneWalk[ 22 ] algorithm identified the GO as the collagen‐containing ECM cellular component with significant interaction with other genes. In particular, type IV collagens are considered network‐forming collagens and include collagen IV, VI, VII, VIII, and X.[ 23 ] Thus, treatment with RCF would be anticipated to have a significant downstream effect on network‐forming collagens. In addition, the GeneWalk algorithm identified interconnectivity of these genes, suggesting a key role for RCF's mechanism of action. Interestingly, COL18A1 is known as a multiplexin collagen and is involved indirectly in endostatin function, which has been shown to predict peroxisome proliferator‐activated receptor α antifibrotic activity in tumor angiogenesis.[24] This preliminary transcriptomic analysis confirms that 28 days of treatment with RCF results in down‐regulation of collagen genes in subjects with NASH in a manner that could facilitate both a reduction in collagen formation and an increased collagen catabolism with extended dosing.
Taken together, the findings in this Phase 2a clinical trial in subjects with presumed F2/F3 NASH provide the rationale for further assessment in a paired liver biopsy cohort of patients at risk of NASH.
FUNDING INFORMATION
Supported by Hepion Pharmaceuticals. The study was designed by expert consultants in the NASH field with Hepion Pharmaceuticals staff. The corresponding author and sponsor had full access to all study data and final authority for publication decisions. The authors of the study were responsible for data analysis, data interpretation, and writing of the report.
CONFLICT OF INTEREST
Stephen A. Harrison, M.D., Principal Investigator, receives research grants from Akero Therapeutics, Inc., Axcella Health, Inc., Cirius Therapeutics, Inc., CiVi Biopharma Inc., Cymabay Therapeutics, Inc., Enyo Pharma S.A, Galectin Therapeutics, Inc., Galmed Research & Dev. LTD., Genfit Corp, Gilead Sciences, Inc., Hepion Pharmaceuticals, Inc., Hightide Therapeutics, Inc., Intercept Pharmaceuticals, Inc., Madrigal Pharmaceuticals, Inc., Metacrine Inc., NGM Biopharmaceuticals Inc., Northsea Therapeutics, Novartis Pharmaceuticals Corp, Novo Nordisk, Poxel, Sagimet Biosciences, and Viking Therapeutics, Inc.; consults for AgomAB, Akero Therapeutics, Inc., Alentis Therapeutics AG, Alimentiv, Inc., Altimmune, Axcella Health, Inc., Boston Pharmaceuticals, B Riley FBR Inc., BVF Partners LP, Cohbar, Inc. Canfite, Corcept Therapeutics, Inc, Cymabay Therapeutics, Inc., Echosens North America Inc., Enyo Pharma S.A, Fibronostics, Foresite Labs, LLC, Fortress Biotech, Inc., Galectin Therapeutics, Inc., Genfit Corp, GNS, Hepion Pharmaceuticals Inc., Hightide Therapeutics, Inc., HistoIndex PTE LTD, Inipharm, Intercept Pharmaceuticals, Inc., Ionis, Kowa Research Institute, Inc., Madrigal Pharmaceuticals, Inc., Medpace, Inc. Metacrine Inc., Microba, NGM Biopharmaceuticals INC., Northsea Therapeutics B.V, Novo Nordisk, Nutrasource, Perspectum Diagnostics, Piper Sandler, Poxel, Prometic, Pharma SMT LTD, Ridgeline, Sagimet Biosciences, Sonic Incytes Medical Corp, Terns Inc., and Viking Therapeutics, Inc.; is on the advisory board for 89 Bio, Akero Therapeutics, Inc., Altimmune, Arrowhead, Axcella Health, Inc., Chronwell, CiVi, Cymabay Therapeutics, Inc., Echosens North America Inc., Foresite Labs, LLC, Galectin Therapeutics, Inc., Galmed Research & Dev. LTD, Genfit Corp, Gilead Sciences, Inc, Hepion Pharmaceuticals, Inc., Hightide Therapeutics, Inc., HistoIndex PTE LTD, Indalo, Intercept Pharmaceuticals, Inc., Madrigal Pharmaceuticals, Inc., Medpace Inc., Metacrine Inc., NGM Biopharmaceuticals., Northsea Therapeutics B.V, Novartis Pharmaceuticals, Novo Nordisk, PathAI, Poxel, Prometic Pharma SMT LTD, Ridgeline, Sagimet Biosciences, Sonic Incytes Medical Corp, Terns Inc., and Theratechnologies; and owns stocks in Akero Therapeutics, Inc., Chronwell Inc., Cirius Therapeutics, Inc, Galectin Therapeutics, Inc., Genfit Corp, Hepion Pharmaceuticals Inc., HistoIndex PTE LTD, Metacrine Inc., NGM Biopharmaceuticals., Northsea Therapeutics B.V, and Sonic Incytes Medical Corp.
APPENDIX A. INCLUSION AND EXCLUSION CRITERIA
Inclusion criteria:
Subjects were required to fulfill all of the following inclusion criteria to be eligible for participation in the study:
Capable of giving written, informed consent and able to effectively communicate with the Investigator and study personnel. A signed informed consent form had to be on file before initiating the screening procedures;
Willing and able to complete all study requirements, restrictions, visits, and procedures;
AST ≥ 2 0 IU/L and FibroScan ≥ 8.5 kPa values. Historical value of FibroScan obtained within 3 months before Screening could be accepted. If historical value was not available, a FibroScan had to be obtained as part of Screening. If a potential subject did not meet the inclusion AST and/or FibroScan requirements, a historical biopsy obtained within 6 months confirming NASH F2 fibrosis stage or a historical biopsy obtained within 12 months confirming NASH F3 fibrosis stage could be accepted to supersede the AST and/or FibroScan results;
Pro‐C3 ≥ 15.5 ng/ml or ELF score ≥ 9.8;
Male or female between the ages of 18 and 75 years (inclusive);
Females of reproductive potential, defined as women who had not been postmenopausal for at least 24 consecutive months (i.e., those who had menses within the preceding 24 months) or women who had not undergone surgical sterilization, specifically hysterectomy, bilateral salpingectomy, bilateral oophorectomy, hysteroscopic sterilization, and/or tubal ligation, had to have a negative pregnancy test at Screening and within the 24‐h period before Day 1; and
All participants had to agree not to participate in a conception process (i.e., active attempt to become pregnant or to impregnate, sperm or egg donation, in vitro fertilization). If participating in sexual activity that could lead to pregnancy, the participant had to agree to use two reliable methods of contraception simultaneously while receiving study treatment and for 3 months after subject stopped taking study drug. A combination of two of the following methods had to be used appropriately:
Condoms (male or female) with or without a spermicidal agent;
Diaphragm or cervical cap with spermicide;
Intrauterine device; and
-
Hormonal‐based contraception.
Note: Participants not of reproductive potential (women who had been postmenopausal for at least 24 consecutive months or undergone hysterectomy, bilateral salpingectomy, bilateral oophorectomy, hysteroscopic sterilization, and/or tubal ligation, or men who had documented azoospermia) were eligible without requiring the use of contraceptives. Acceptable documentation of sterilization, menopause, or male partner's azoospermia had to be provided; serum follicle stimulating hormone measurement could be used to document menopausal status.
Exclusion criteria:
Subjects who met any of the following criteria prior to the first dose of study drug were not eligible for randomization.
Pregnant or breastfeeding or planning to become pregnant during the study period;
Known allergy to CRV431, cyclosporine, or any of their inactive ingredients;
Positive test for hepatitis B surface antigen, hepatitis C virus (HCV) antibody, or human immunodeficiency virus (HIV) antibody. If HCV antibody test was positive, then an HCV RNA test was performed. If the HCV‐RNA test was negative, the subject was allowed to participate in the study, as long as the subject met all other inclusion criteria and had never been treated for HCV or was treated > 2 years ago and achieved a sustained virologic response at that time;
History of or any current medical condition that could have compromised the safety of the participant in the study, as determined by the Investigator;
Subjects with a systolic pressure > 150 or a diastolic pressure > 90. At the discretion of the Investigator, the blood pressure could be remeasured after 10 min to ensure the blood pressure was in fact out of range. Out of range blood pressure after the second measurement excluded a subject. If a subject had a blood‐pressure reading within the desired range due to antihypertension medication, that subject could be included at the discretion of the Investigator, provided the antihypertension medication was not a contraindicated medication;
Clinically significant gastrointestinal, cardiovascular, neurologic, psychiatric, metabolic, renal, hepatic, respiratory, inflammatory, or infectious disease, as determined by the Investigator;
Subjects with a history of clinically significant acute cardiac event within 6 months before Screening such as stroke, transient ischemic attack, or coronary heart disease (angina pectoris requiring therapy, myocardial infarction, revascularization procedures, with left ventricular ejection fraction < 50% as determined by previous echocardiography or multigated acquisition scan);
- Subjects with uncontrolled or unstable cardiac arrhythmias:
- Severe conduction disturbance (e.g., second‐degree or third‐degree atrioventricular [AV] block);
- Corrected QT interval (QTc) interval > 450 ms (males) or >470 ms (females); or
- History of congenital long QT syndrome, congenital short QT interval (QT) syndrome, Torsades de Pointes, or Wolff Parkinson White syndrome
Subjects with transaminases >5 × upper limit of normal (ULN) and with alkaline phosphatase > 2 × ULN;
Subjects with total serum bilirubin > 1.5 × ULN, unless the subject had Gilbert's Syndrome, in which case the subject could be enrolled provided the direct bilirubin was within 30% of the total bilirubin;
Subjects with a platelet count < 150,000/mm3;
Systemic immunosuppression within 6 months before the first dose of study drug apart from short‐term treatment for asthma, chronic obstructive pulmonary disease, or other respiratory conditions;
Current clinically significant diarrhea or gastric stasis that, in the Investigator's opinion, could have influenced drug absorption or bioavailability;
Subject with any history or presence of decompensated cirrhosis;
- Other well‐documented causes of chronic liver disease according to standard diagnostic procedures including, but not restricted to:
- Suspicion of drug‐induced liver disease;
- Alcohol‐associated liver disease;
- Autoimmune hepatitis;
- Wilson disease;
- Primary biliary cholangitis, primary sclerosing cholangitis;
- Genetic hemochromatosis (homozygosity for C282Y or C282Y/H63D compound heterozygote);
- Known or suspected hepatocellular carcinoma (HCC); or
- History or planned liver transplant, or current Model for End‐Stage Liver Disease score > 15
History of, or current evidence of, gallstones, gall bladder disease, cholestasis that had not been treated with cholecystectomy, or pancreatitis;
Subjects with glycosylated hemoglobin (HbA1c) > 9.5%. For subjects with an HbA1c > 9.5% at the Screening Visit, a repeat test could be performed. A repeat HbA1c result > 9.5% led to exclusion;
At Screening, an estimated glomerular filtration rate (eGFR) < 60 ml/min/1.73 m2 (calculated by the Chronic Kidney Disease Epidemiology Collaboration method) and/or a Kidney Disease Improving Global Health category > G2;
Safety laboratory abnormalities at Screening that were clinically significant as determined by the Investigator;
Weight loss > 5% within 3 months before randomization;
Current abuse of alcohol or illicit drugs, or history of alcohol or illicit drug abuse within the preceding 2 years, as determined by the Investigator. History of excess alcohol intake as defined as ≥21 units of alcohol per week in males and ≥14 units of alcohol per week in females for 2 years before enrollment (a “unit” of alcohol is equivalent to 12 oz. of beer, 4 oz. of wine, or a 1‐oz. shot of hard liquor);
A positive urine drug screen for drugs with a high potential for abuse (amphetamines, cannabinoids, opiates, cocaine, benzodiazepine) or alcohol test at Screening or Day −1. For benzodiazepines only: Positive results were accepted if due to an approved prescription. For cannabinoids, opiates, and cocaine: On a case‐by‐case basis, positive results were evaluated by the Sponsor and Medical Monitor to determine the subject's eligibility to safely be included in the study;
Significant medical or psychiatric illness that would have interfered with compliance and ability to tolerate treatment as outlined in the protocol;
Subjects who could not be contacted in case of emergency;
Judgment by the Investigator that the subject should not participate in the study if the subject was unlikely to comply with all study procedures and treatment;
Received an investigational drug or investigational vaccine or used an investigational medical device within 30 days before the first dose of study drug;
Subjects who had used any drugs or substances known to be strong inhibitors or inducers of cytochrome P450 3A4/5 and drugs whose major elimination pathway is the bile salt export pump or organic anion transporter 3 (OAT3), and drugs that are major substrates of the hepatic uptake transporters, OATP1B1 and OATP1B3, within 30 days before the first dose of study drug; and
Subjects with a history of organ transplantation (corneal transplantation was allowed).
Harrison SA, Mayo PR, Hobbs TM, Canizares C, Foster EP, Zhao C, et al. Rencofilstat, a cyclophilin inhibitor: A phase 2a, multicenter, single‐blind, placebo‐controlled study in F2/F3 NASH . Hepatol Commun. 2022;6:3379–3392. 10.1002/hep4.2100
REFERENCES
- 1. Mantovani A, Scorletti E, Mosca A, Alisi A, Byrne CD, Targher G. Complications, morbidity and mortality of nonalcoholic fatty liver disease. Metabolism. 2020;111:154170. [DOI] [PubMed] [Google Scholar]
- 2. Powell EE, Wong VWS, Rinella M. Non‐alcoholic fatty liver disease. Lancet. 2021;397:2212–24. [DOI] [PubMed] [Google Scholar]
- 3. Younossi Z, Anstee QM, Marietti M, Hardy T, Henry L, Eslam M, et al. Global burden of NAFLD and NASH: trends, predictions, risk factors and prevention. Nat Rev Gastroenterol Hepatol. 2018;15:11–20. Nature Publishing Group. [DOI] [PubMed] [Google Scholar]
- 4. Povsic M, Wong OY, Perry R, Bottomley J. A structured literature review of the epidemiology and disease burden of non‐alcoholic steatohepatitis (NASH). Adv Ther. 2019;36:1574–94. [DOI] [PMC free article] [PubMed] [Google Scholar]
- 5. Manne V, Handa P, Kowdley KV. Pathophysiology of nonalcoholic fatty liver disease/nonalcoholic steatohepatitis. Clinics Liver Disease. 2018;22:23–37. [DOI] [PubMed] [Google Scholar]
- 6. Targher G, Byrne CD, Lonardo A, Zoppini G, Barbui C. Non‐alcoholic fatty liver disease and risk of incident cardiovascular disease: a meta‐analysis. J Hepatol. 2016;65:589–600. [DOI] [PubMed] [Google Scholar]
- 7. Huang DQ, El‐Serag HB, Loomba R. Global epidemiology of NAFLD‐related HCC: trends, predictions, risk factors and prevention. Nat Rev Gastroenterol Hepatol. 2021;18:223–38. [DOI] [PMC free article] [PubMed] [Google Scholar]
- 8. Burra P, Becchetti C, Germani G. NAFLD and liver transplantation: disease burden, current management and future challenges. JHEP Rep. 2020;2:100192. [DOI] [PMC free article] [PubMed] [Google Scholar]
- 9. Ure DR, Trepanier DJ, Mayo PR, Foster RT. Cyclophilin inhibition as a potential treatment for nonalcoholic steatohepatitis (NASH). Expert Opin Investig Drugs. 2020;29:163–78. [DOI] [PubMed] [Google Scholar]
- 10. Kuo J, Bobardt M, Chatterji U, Mayo PR, Trepanier DJ, Foster RT, et al. A pan‐cyclophilin inhibitor, CRV431, decreases fibrosis and tumor development in chronic liver disease models. J Pharmacol Exp Ther. 2019;371:231–41. [DOI] [PMC free article] [PubMed] [Google Scholar]
- 11. Patro R, Duggal G, Love MI, Irizarry RA, Kingsford C. Salmon provides fast and bias‐aware quantification of transcript expression. Nat Methods. 2017;14:417–9. [DOI] [PMC free article] [PubMed] [Google Scholar]
- 12. Love MI, Huber W, Anders S. Moderated estimation of fold change and dispersion for RNA‐seq data with DESeq2. Genome Biol. 2014;15:550. [DOI] [PMC free article] [PubMed] [Google Scholar]
- 13. Chen Y, Lun ATL, Smyth GK. From reads to genes to pathways: differential expression analysis of RNA‐Seq experiments using Rsubread and the edgeR quasi‐likelihood pipeline. F1000Research. 2016;5:1438. [DOI] [PMC free article] [PubMed] [Google Scholar]
- 14. Erhardtsen E, Rasmussen D, Frederiksen P, Leeming DJ, Shevell D, Gluud LL, et al. Determining a healthy reference range and factors potentially influencing PRO‐C3—a biomarker of liver fibrosis. JHEP Rep. 2021;3:100317. [DOI] [PMC free article] [PubMed] [Google Scholar]
- 15. Nielsen MJ, Leeming DJ, Goodman Z, Friedman S, Frederiksen P, Rasmussen D, et al. Comparison of ADAPT, FIB‐4 and APRI as non‐invasive predictors of liver fibrosis and NASH within the CENTAUR screening population. J Hepatol. 2021;75:1292–300. [DOI] [PubMed] [Google Scholar]
- 16. Karsdal MA, Nielsen SH, Leeming DJ, Langholm LL, Nielsen MJ, Manon‐Jensen T, et al. The good and the bad collagens of fibrosis—their role in signaling and organ function. Adv Drug Delivery Rev. 2017;121:43–56. [DOI] [PubMed] [Google Scholar]
- 17. Nielsen MJ, Veidal SS, Karsdal MA, Ørsnes‐Leeming DJ, Vainer B, Gardner SD, et al. Plasma Pro‐C3 (N‐terminal type III collagen propeptide) predicts fibrosis progression in patients with chronic hepatitis C. Liver Int. 2015;35:429–37. [DOI] [PubMed] [Google Scholar]
- 18. Sanyal A, Charles ED, Neuschwander‐Tetri BA, Loomba R, Harrison SA, Abdelmalek MF, et al. Pegbelfermin (BMS‐986036), a PEGylated fibroblast growth factor 21 analogue, in patients with non‐alcoholic steatohepatitis: a randomised, double‐blind, placebo‐controlled, phase 2a trial. Lancet. 2018;392:2705–17. [DOI] [PubMed] [Google Scholar]
- 19. Harrison SA, Rinella ME, Abdelmalek MF, Trotter JF, Paredes AH, Arnold HL, et al. NGM282 for treatment of non‐alcoholic steatohepatitis: a multicentre, randomised, double‐blind, placebo‐controlled, phase 2 trial. Lancet. 2018;391:1174–85. [DOI] [PubMed] [Google Scholar]
- 20. Veidal SS, Karsdal MA, Vassiliadis E, Nawrocki A, Larsen MR, Nguyen QHT, et al. MMP mediated degradation of type VI collagen is highly associated with liver fibrosis—identification and validation of a novel biochemical marker assay. PLoS ONE. 2011;6:e24753. [DOI] [PMC free article] [PubMed] [Google Scholar]
- 21. Karsdal MA, Hjuler ST, Luo Y, Rasmussen DGK, Nielsen MJ, Holm Nielsen S, et al. Assessment of liver fibrosis progression and regression by a serological collagen turnover profile. Am J Physiol Gastrointest Liver Physiol. 2019;316:25–31. [DOI] [PubMed] [Google Scholar]
- 22. Ietswaart R, Gyori BM, Bachman JA, Sorger PK, Churchman LS. GeneWalk identifies relevant gene functions for a biological context using network representation learning. Genome Biol. 2021;22:55. [DOI] [PMC free article] [PubMed] [Google Scholar]
- 23. Karsdal MA, Daniels SJ, Holm Nielsen S, Bager C, Rasmussen DGK, Loomba R, et al. Collagen biology and non‐invasive biomarkers of liver fibrosis. Liver Int. 2020;40:736–50. [DOI] [PubMed] [Google Scholar]