

Abstract
Background:
Hyperphosphorylation of tau leads to conformational changes that destabilize microtubules and hinder axonal transport in Alzheimer’s disease (AD). However, it remains unknown whether white matter (WM) decline due to AD is associated with specific Tau phosphorylation site(s).
Methods:
In autosomal dominant AD (ADAD) mutation carriers (MC) and non-carriers (NC) we compared cerebrospinal fluid (CSF) phosphorylation at tau sites (pT217, pT181, pS202, and pT205) and total tau with WM measures, as derived from diffusion tensor imaging (DTI), and cognition. A WM composite metric, derived from a principal component analysis, was used to identify spatial decline seen in ADAD.
Results:
The WM composite explained over 70% of the variance in MC. WM regions that strongly contributed to the spatial topography were located in callosal and cingulate regions. Loss of integrity within the WM composite was strongly associated with AD progression in MC as defined by the estimated years to onset (EYO) and cognitive decline. A linear regression demonstrated that amyloid, gray matter atrophy and phosphorylation at CSF tau site pT205 each uniquely explained a reduction in the WM composite within MC that was independent of vascular changes (white matter hyperintensities), and age. Hyperphosphorylation of CSF tau at other sites and total tau did not significantly predict WM composite loss.
Conclusions:
We identified a site-specific relationship between CSF phosphorylated tau and WM decline within MC. The presence of both amyloid deposition and Tau phosphorylation at pT205 were associated with WM composite loss. These findings highlight a primary AD-specific mechanism for WM dysfunction that is tightly coupled to symptom manifestation and cognitive decline.
Keywords: Phosphorylated tau, ADAD, White matter, PCA, CSF
1. Introduction
Alzheimer’s disease (AD) is diagnosed and staged neuropathologically by the distribution and abundance of two hallmark lesions: extracellular amyloid-β (Aβ) plaques and intracellular accumulations of phosphorylated tau (p-tau) (Bloom, 2014). Initially Aβ plaques deposit in neocortical regions and spread to limbic and subcortical areas. Tau pathology is characterized by hyperphosphorylation and subsequent aggregation of tau into neurofibrillary tangles (NFTs) and neuropil threads (NTs) (Hu et al., 2016). In multiple etiologies of AD, including autosomal dominant AD (ADAD) and late onset AD (LOAD), symptomatic individuals have significantly elevated cerebrospinal fluid (CSF) t-tau/Aβ42 ratio compared to cognitively normal controls (Bateman et al., 2012). Phosphorylation of the tau protein is not a single process and in fact 70 different sites along the tau protein are known to be altered in AD. Recent work has shown that phosphorylation of tau at specific sites is associated with different stages of the disease process (Barthelemy et al., 2020a; Barthelemy et al., 2019). For example, elevations in pT205 change after pT181 and pT217, and are more strongly associated with gray matter volume. However, relationships between pT205 and white matter integrity remain unknown. Since AD pathology involves both gray matter (GM) and white matter (WM), we sought to determine if changes in specific Tau phosphorylation sites are associated with WM changes seen in autosomal dominant AD (ADAD).
Dynamic changes in p-tau can be differentiated using mass spectrometry to quantify the percentage of phosphorylation occupancy at specific sites (Barthelemy et al., 2019). Previous studies of CSF p-tau have primarily focused on p-tau181 (pT181) due to its’ relative abundance and ease in quantification. Recently, additional CSF Tau phosphorylation sites (pT217, pS202, and pT205) have been identified with a temporal order of phosphorylation sites occurring with disease progression (Barron et al., 2017; Kimura et al., 2018; Shahpasand et al., 2012). Hyperphosphorylation at these sites can differ in the stoichiometry suggesting their propensity to be sequestered into brain tau tangles (pT181, pT217, pS202) or the soluble (pt205) matrix including CSF (Horie et al., 2020a). Specifically, increased percentage of phosphorylation at CSF pT181 and CSF pT217 occur earlier in disease progression and have been associated with amyloid accumulation while an increased percentage of phosphorylation at CSF pT205 occurs at symptom onset and is associated more with neurodegenerative markers (e.g. gray matter (GM) atrophy) (Kimura et al., 2018).
Tau hyperphosphorylation has been associated with not only GM but also WM decline (Musi et al., 2018). Animal studies have demonstrated that post-translational hyperphosphorylation of tau is necessary for GM and WM loss (Wang et al., 2018). Hyperphosphorylation leads to a loss of binding of tau to microtubules that is associated with demyelination. This can lead to impaired communication between local and distant brain regions (Pierpaoli et al., 1996). This process of myelinoclasis is not considered to be a byproduct of neuronal loss but rather a distinct AD-related mechanism that affects WM. These changes in WM can be detected in vivo utilizing diffusion tensor imaging (DTI), a neuroimaging method that monitors the diffusion of water (Strain et al., 2018). DTI has been studied extensively in AD with loss of WM associated with increases in tau positron emission tomography (PET) (McDade et al., 2018). Prior work from our group has shown that tau PET in temporal regions is tightly coupled to WM loss in LOAD (Strain et al., 2018).
ADAD provides a unique window to evaluate WM pathology due to AD without age-related vascular contributions that are seen with LOAD (Bateman et al., 2012). In particular, ADAD individuals are often younger and do not have significant vascular burden typically seen in LOAD. Furthermore, ADAD individuals are genetically predisposed to develop symptoms at a known age with the estimated “years to symptom onset” (EYO) derived from other family members who have a similar mutation (McDade et al., 2018). EYO represents the conversion point when cognitive changes manifest and provides a metric of disease “time” that is currently unavailable in LOAD. By evaluating WM loss in relation to cognition and EYO we can derive the spatial pattern of WM loss seen in ADAD.
This study evaluated whether CSF phosphorylation at various tau sites (pT217, pT181, pS202, and pT205) and total tau are associated with WM loss, as quantified by DTI. The spatial topography of WM integrity loss across multiple tracts was reduced in dimensional space using principal component analysis (PCA) to derive a WM composite. This WM composite measure statistically reduces the number of comparisons but still retains spatial information. Within this composite, tracks are weighted differently depending on their contribution to the primary component. We examined the decline in WM composite with regards to EYO and cognitive changes in ADAD.
2. Methods
2.1. Participants
This original sample included 221 participants from the international Dominantly Inherited Alzheimer Network (DIAN) and included 123 ADAD mutation carriers (MC) and 98 non-carriers from ADAD families (MN). A unique attribute of the ADAD cohort is the capability of estimating the conversion to symptomatic cognitive changes based on the average onset from other family members with the same genetic mutation. For inclusion within this analysis, a participant completed: 1) a general physical, including neurologic examination; 2) health and medication history questionnaires; 3) a clinical assessment for dementia and neuropsychological evaluation; 4) a lumbar puncture for CSF tau; and 5) neuroimaging on a 3 T Siemens Tim Trio scanner (Erlangen, Germany). The neurologic examination was conducted as part of the clinical dementia rating (CDR) scale to define disease stage. All participants or their representatives provided written, informed consent approved by the institutional review boards at the respective institution.
2.1.1. Clinical Dementia Rating (CDR)
Experienced clinicians conducted semi-structured interviews with each participant and a knowledgeable collateral source. The CDR was used to evaluate a participant’s degree of impairment (Morris, 1993). A score of CDR 0 indicates that the individual is cognitively normal, CDR 0.5 corresponds to very mild dementia, and CDR ≥ 1 specifies mild-to-moderate dementia. Participants with a score of CDR > 0 had a clinical diagnosis of dementia due to AD.
2.1.2. Estimated Years to Onset (EYO)
A unique attribute of the ADAD cohort is the capability of estimating the conversion point for cognitive changes. Parental age at symptomatic onset was determined from semi-structured interviews with the participant, a knowledgeable collateral source, and/or other informants familiar with the parental history of disease. The age at onset of the affected parent was determined by estimating the time of onset of consistent symptoms (e.g., memory/cognition, motor, or behavior) (Morris, 1993). The EYO for each individual from DIAN was defined as the participant’s age at testing minus the age at symptom onset for that individual’s affected parent (McDade et al., 2018).
2.2. Cognition
Participants underwent a comprehensive neuropsychological test battery that has been previously described (Storandt et al., 2014). A cognitive composite z-score was calculated from three domains including: 1) episodic memory (word list delayed recall and logical memory delayed recall); 2) processing speed and executive function (Digit Symbol Substitution); and 3) general mental status (Mini-Mental Status Examination [MMSE]) (Folstein et al., 1975; Wechsler, 1987; Wechsler, 1981). These tests include multiple cognitive domains affected by AD and closely mirror the primary cognitive endpoints used in clinical trials (Bateman et al., 2017; Donohue et al., 2014). Scores from each test were standardized to the mean and standard deviation of DIAN MC with EYO ≤ −15 and averaged together to form a composite score. Due to ceiling effects in the MMSE, an adjusted standard deviation was used. A summary value was computed for each participant with higher scores indicating better performance.
2.3. CSF
CSF was acquired to evaluate phosphorylation of tau at pT181, pS202, pT205, and pT217 using corresponding (p-tau/t-tau) ratios. Further details on CSF preparation has been previously described (Barthelemy et al., 2020a). Tau phosphorylation was analyzed by nano liquid chromatography-high-resolution mass spectrometry (nanoLC-MS/HRMS) using Parallel Reaction Monitoring with Higher-energy collisional dissociation (HCD) fragmentation. NanoLC-MS/HRMS experiments were performed using a nanoAcquity UPLC system (Waters, Mildford, Massachusetts) coupled to a Fusion Tribrid mass spectrometer (Thermo Scientific, San Jose, California). CSF Tau phosphorylation ratios were calculated using measured ratios between MS/HRMS transitions of endogenous unphosphorylated peptides and 15 N labeled peptides from protein internal standard. Each phosphorylated/unphosphorylated peptide endogenous ratio was normalized using the ratio measured on the MS/HRMS transitions of the corresponding AQUA phosphorylated/unphosphorylated peptide internal standards (Barthelemy et al., 2020a).
2.4. Amyloid PET acquisition and analysis
PET imaging was performed using Pittsburgh compound B (PiB) to measure amyloid load. Amyloid PET imaging analyses were performed using a previously described PET Unified Pipeline (Su et al., 2015). Data from the 40–70-min post-injection window for PiB were converted to standardized uptake value ratios (SUVRs) within defined regions of interest using the cerebellar cortex as a reference region. Partial-volume correction was performed with a regional spread function.
2.4.1. Magnetic Resonance Imaging (MRI) acquisition
MRI data were analyzed from participants scanned on 3 T Siemens Tim Trio scanners (Siemens Medical Systems, Iselin, NJ). Scanners were calibrated using standard protocols previously described. Structural T1 images were acquired using the Alzheimer’s Disease Neuroimaging Initiative (ADNI) protocol (Jack et al., 2008). High-resolution T2-weighted images were acquired with the following parameters: repetition time (TR) = 3200 ms, echo time (TE) = 455 ms, flip angle = 120°, with a 256 × 256 field of view, and a 1 mm isotropic resolution. T2-weighted fluid attenuated inversion recovery (FLAIR) scans (TR = 9000 ms, TE = 90 ms, inversion time (TI) = 2500 ms, flip angle = 150°, 0.9 × 0.9 × 5.0 mm3 resolution) were acquired. In addition, a single diffusion-weighted scan was obtained (2.5 × 2.5 × 2.5, TR = 11,000 milliseconds, TE = 87 milliseconds, flip angle = 90°, 64 directions, b-value 1000 s/mm2) for each participant.
2.4.2. Diffusion Tensor Imaging (DTI) processing
DTI, an imaging modality that assesses the flow of water around axons, was used to evaluate WM structural integrity. DTI preprocessing included correction for motion and eddy current distortions, followed by skull stripping using FSL 5.0.9 (www.fmrib.ox.ac.uk/fsl). Scans were visually inspected to ensure that head movement was <3 mm for all participants during data acquisition. Individuals were also excluded if the field of view (FOV) provided insufficient brain coverage. Diffusion maps including fractional anisotropy (FA), mean diffusivity (MD), radial diffusivity (DR), and axial diffusivity (DA) were generated using DTIFIT. Each diffusion map was warped to the FA-FMRIB_58 space, and WM voxels were condensed to a 1-mm-thick skeleton derived from tract-based spatial statistics (TBSS) (Smith et al., 2006). The TBSS approach utilized a search algorithm to identify the highest FA in the eminent vicinity which alleviated potential partial volume effects and registration errors.
2.4.3. MRI volumetric and White Matter Hyperintensity (WMH) processing
T1-weighted scans were automatically segmented into regions of interest according to the Desikan atlas through FreeSurfer 5.3 (Martinos Center for Biomedical Imaging, Charlestown, Massachusetts, USA). A trained evaluator reviewed each segmentation output and performed manual edits when necessary. Changes associated with vascular disease were quantified using WMH volumes derived from FLAIR. An opensource SPM lesion segmentation tool that contained a lesion growth algorithm was used to identify WM lesions (applied-statistics.de/lst.html). A global WMH volume was calculated and log-transformed due to non-normal distribution.
2.5. WM composite
DTI metrics were calculated and converted to a single voxel width skeleton that represents the core of the WM constrained by the TBSS pipeline. Skeletonized voxels were overlaid onto twelve predefined WM tracts and averaged to yield tract-wise values (Strain et al., 2017). Briefly, all WM tracts were generated with deterministic tractography algorithms and overlapping voxels assigned to specific tracts based on data driven approaches. Tracts are comprised of the average values of the skeletal voxels residing within a tract mask. A principal component analysis (PCA) identified the optimal linear combination of WM tracts that best explained the variance within the MC group only. All MC individuals with DTI imaging were incorporated into the PCA (n = 123). Data from NC were not included into the formation of the WM composite. However, the primary component derived from the MC cohort was projected onto the NC for group comparisons. PCA is a multivariate analysis that reveals internal data organization and its variance. This reduced the dimensionality of the data into a scalar value (WM composite) based on the primary component. Separate PCA’s were performed for each DTI metric [fractional anisotropy (FA), mean diffusivity (MD), radial diffusivity (DR), and axial diffusivity (DA)].
2.6. Comparison of Voxel-Wise and WM composites
An additional analysis focused on the spatial topography and inherent bias that can occur using a disease population. We analyzed the relationship between CSF Tau phosphorylation site (pT181, pS202, pT205, or pT217) and WM loss for the WM composite and an unbiased voxel-wise analysis. Both analyses included age and gender as a covariate and involved all MC for whom both CSF and DTI data were available.
The voxel-wise validation of the WM composite was conducted on the white matter skeleton generated from TBSS using Randomise (Winkler et al., 2014), a statistical package in FSL. A statistical threshold of p < 0.05 corrected for multiple comparisons was performed using 5000 Monte Carlo permutations and threshold free clustering.
The WM composite was evaluated with a linear regression that used the same statistical threshold and FDR correction used to control for multiple comparisons.
2.7. Relationship between WM composite and EYO or cognition
These analyses included age and gender as a covariate and involved all MC for whom both CSF and DTI data were available. We evaluated the timing of changes in the WM composite in relation to EYO, and whether changes in WM composite were associated with cognitive performance. Both linear and quadratic models were performed with the WM composite predicted by either EYO or global cognitive score. In addition to the global cognitive score we evaluated the individual cognitive domains of memory (Logicial Memory Delayed Recall, Word list delayed recall, Paired associates recall) and executive functioning (Digit Symbol Substitution, Trail Making Part B, task switching) to determine cognitive domain specificity.
Prior work has shown that several CSF Tau phosphorylation sites change at distinct times with reference to EYO, but their relationships to cognitive changes are less understood. Therefore, we analyzed CSF phosphorylation at each tau site as a function of global cognitive performance to determine if decline was tau site specific. A statistical threshold of p < 0.05 was set for each analysis.
2.8. WM composite regression
Several factors can contribute to WM loss either in conjunction or independent of AD progression. Confounding covariates that can contribute to WM decline were included in the analysis that evaluated the relationship between CSF phosphorylation at each tau site and WM composite. All MC individuals who had multiple modal imaging and CSF were used in a linear regression model to predict WM composite loss with age, white matter hyperintensity (WMH) load, amyloid PET SUVR, CSF Tau phosphorylation site, and MRI cortical volume included as predictive variables. Each variable, except CSF Tau phosphorylation site, was included as a representative potential source of variance for WM decline. Increasing age has consistently been associated with WM loss (Molloy et al., 2021). WMHs due to cerebrovascular disease are also associated with WM loss (Maillard et al., 2013). Cortical volume can serve as a proxy for neurodegeneration that occurs due to WM loss (Sintini et al., 2018). Finally, AD biomarkers (e.g. amyloid PET accumulation) has also been associated with WM loss. The main effects of each of these variables were evaluated to determine which predictor(s) significantly contributed to the model. Separate regressions were performed for each CSF Tau phosphorylation site with a statistical threshold of p < 0.05 and adjusted for multiple comparisons (FDR). The following formula represents the linear model that was utilized to predict the WM composite with GM representing the cortical volume, Aß representing amyloid PET, WMH representing lesion load, and Tau representing the different phosphorylation sites (a) for each participant (j).
3. Results
3.1. Demographics
The original cohort consisted of 123 MC who had an average age of 36.5 years old and consisted of more females than males (M/F = 54/69). Additionally, 98 NC were on average 39.9 years old and consisted of more males than females (M/F = 52/46). Within this cohort 38 NC and 72 MC had CSF Tau phosphorylation site measurements. Six NC and 23 MC lacked an amyloid PET scan and two additional MC lacked a FLAIR scan resulting in 32 NC and 47 MC that contained the following data DTI, T1, amyloid PET, FLAIR, and Tau phosphorylation sites. Sample sizes for each analysis were maximized based on the modalities involved. Further demographic information on the full cohort can be found in Table 1.
Table 1.
Demographics.
| N | Age (years) | Sex (F/M) | CDR (=0/=0.5 > 0.5) | Mut. Type (PS1/PS2/APP) | WMH (voxels) | PET AG (SUVR) | |
|---|---|---|---|---|---|---|---|
|
| |||||||
| NC | 98 | 39.9(11.1) | 52/46 | 98/0/0 | NA | 2504(2233) | 1.04(0.07) |
| MC | 123 | 37(11.7) | 54/69 | 80/36/7 | 99/15/9 | 5296(7957) | 1.82(0.94) |
Aß = amyloid-beta.
WMH = White matter hyperintensities.
CDR = Clinical dementia rating.
PS1 = Presenilin 1 PS2 = Presenilin 2 APP = amyloid precursor protein. PET = Positron Emission Tomography.
3.2. WM composite
The resulting primary components, from the entire MC group (n = 123), represent the linear combination of WM tracts. For FA, MD, and DR the primary component explained greater than 70% of the variance but only 56% of the variance for DA (Fig. 1). The WM composite identified for each DTI metric was comprised of four pathways (anterior and posterior corpus callosum, cingulum, and forceps major). Since FA, MD, and DR had similar topographies, FA was selected as the representative WM composite for subsequent analyses. For the remaining analyses individual factor scores from the FA WM composite represented an individual’s deviation from this pattern with higher scores representing healthier WM.
Fig. 1.
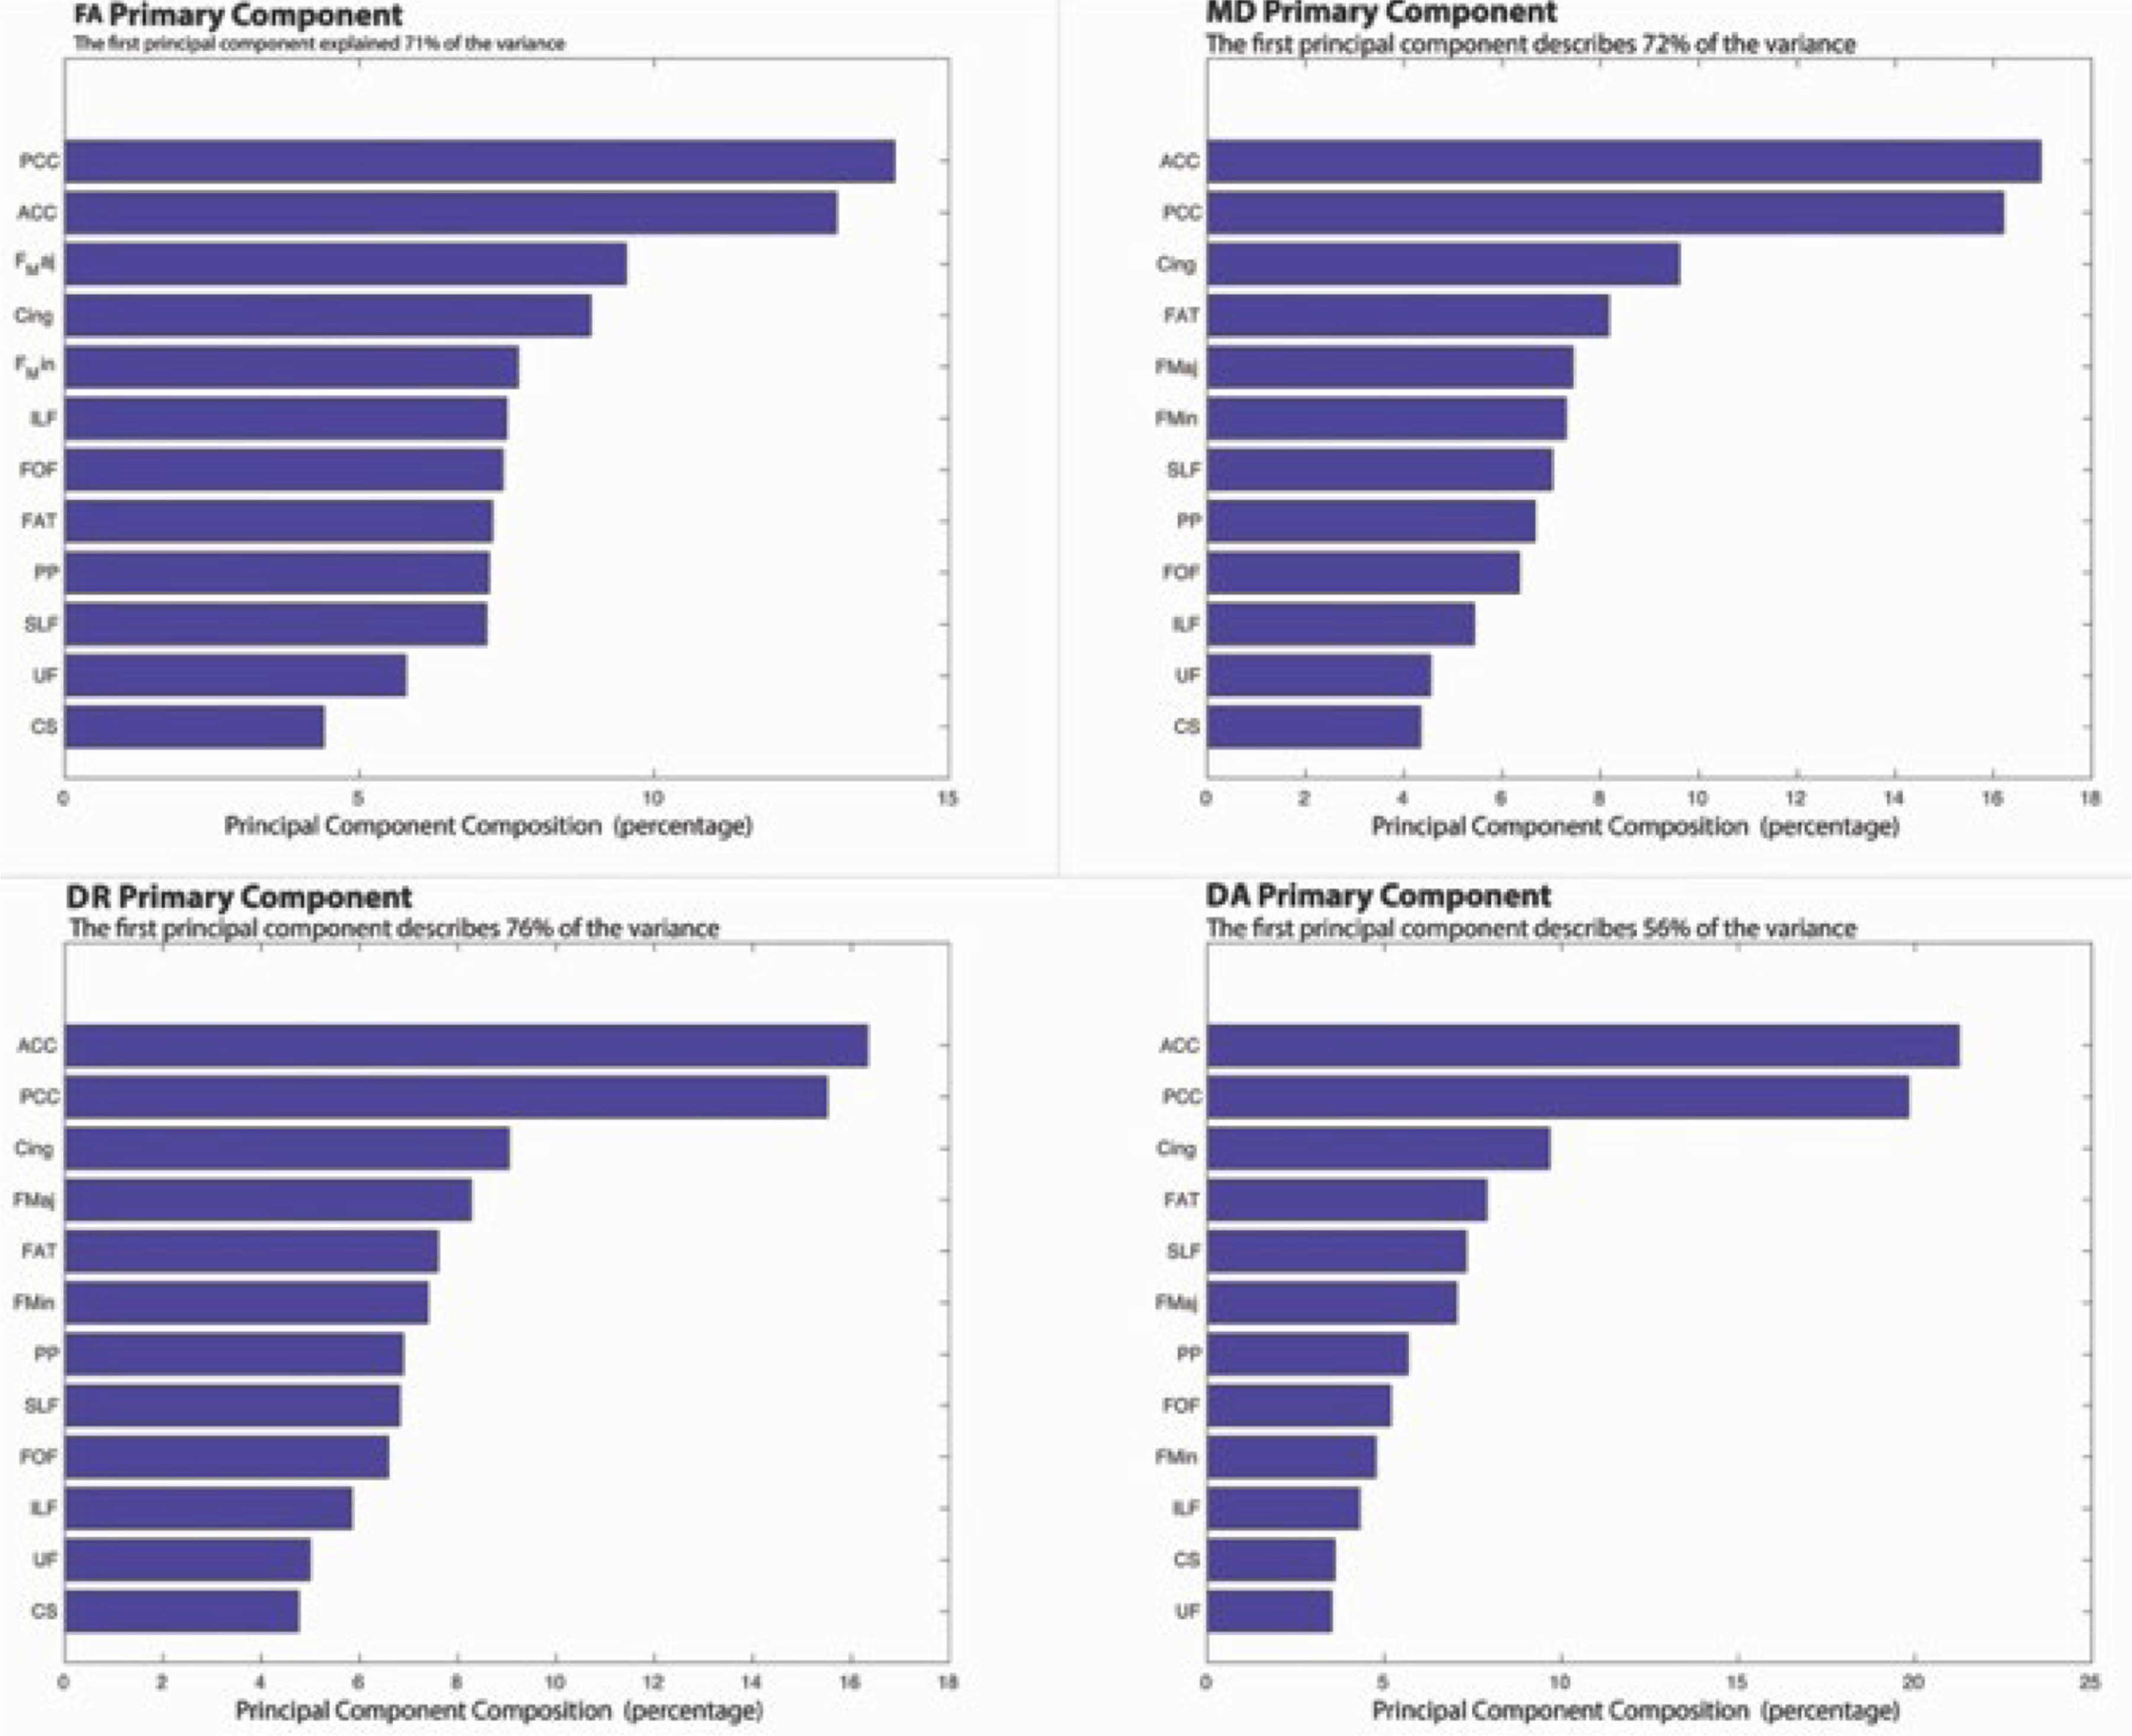
This shows the primary component derived from the principal component analysis (PCA) for each diffusion tensor imaging (DTI) metric. The amount of variance that is explained for the mutation carrier (MC) cohort with a similar pattern observed for each of the DTI metrics. For the fig. PCC = Posterior Corpus Callosum; ACC = Anterior Corpus Callosum; F Maj = Forceps Major; Cing = Cingulum; F Min = Forceps Minor; ILF = Inferior Longitudinal Fasciculus; FOF = Fronto occipital fasciculus; FAT = Frontal Aslant Tract; PP = Perforant Pathway; SLF = Superior Longitudinal Fasiculus; UF = Uncinate Fasciculus; CS = Corticospinal Tract.
3.3. WM composite and WM voxel-wise regression analysis
All individuals with CSF and DTI were used in the following analysis (38 NC and 72 MC). The FA WM composite derived from the MC cohort revealed a significant inverse relationship for CSF pT205 (p = 0.0021 FDR corrected) (Fig. 2) but not for other phosphorylation sites (Fig. 3). Similar results were observed when a voxel-wise regression was performed. Reductions in FA were associated with increases in CSF pT205 but not other Tau phosphorylation sites (Fig. 4). Furthermore, the spatial topography of the voxel-wise analysis revealed that FA integrity was diminished within the callosal and cingulate tracts (p < 0.05 corrected). Significant findings were only observed for the MC group with no significant findings seen for NC. These same tracts were key components of the WM composite (71% of variance) and may explain the similarity in results between these two methods.
Fig. 2.
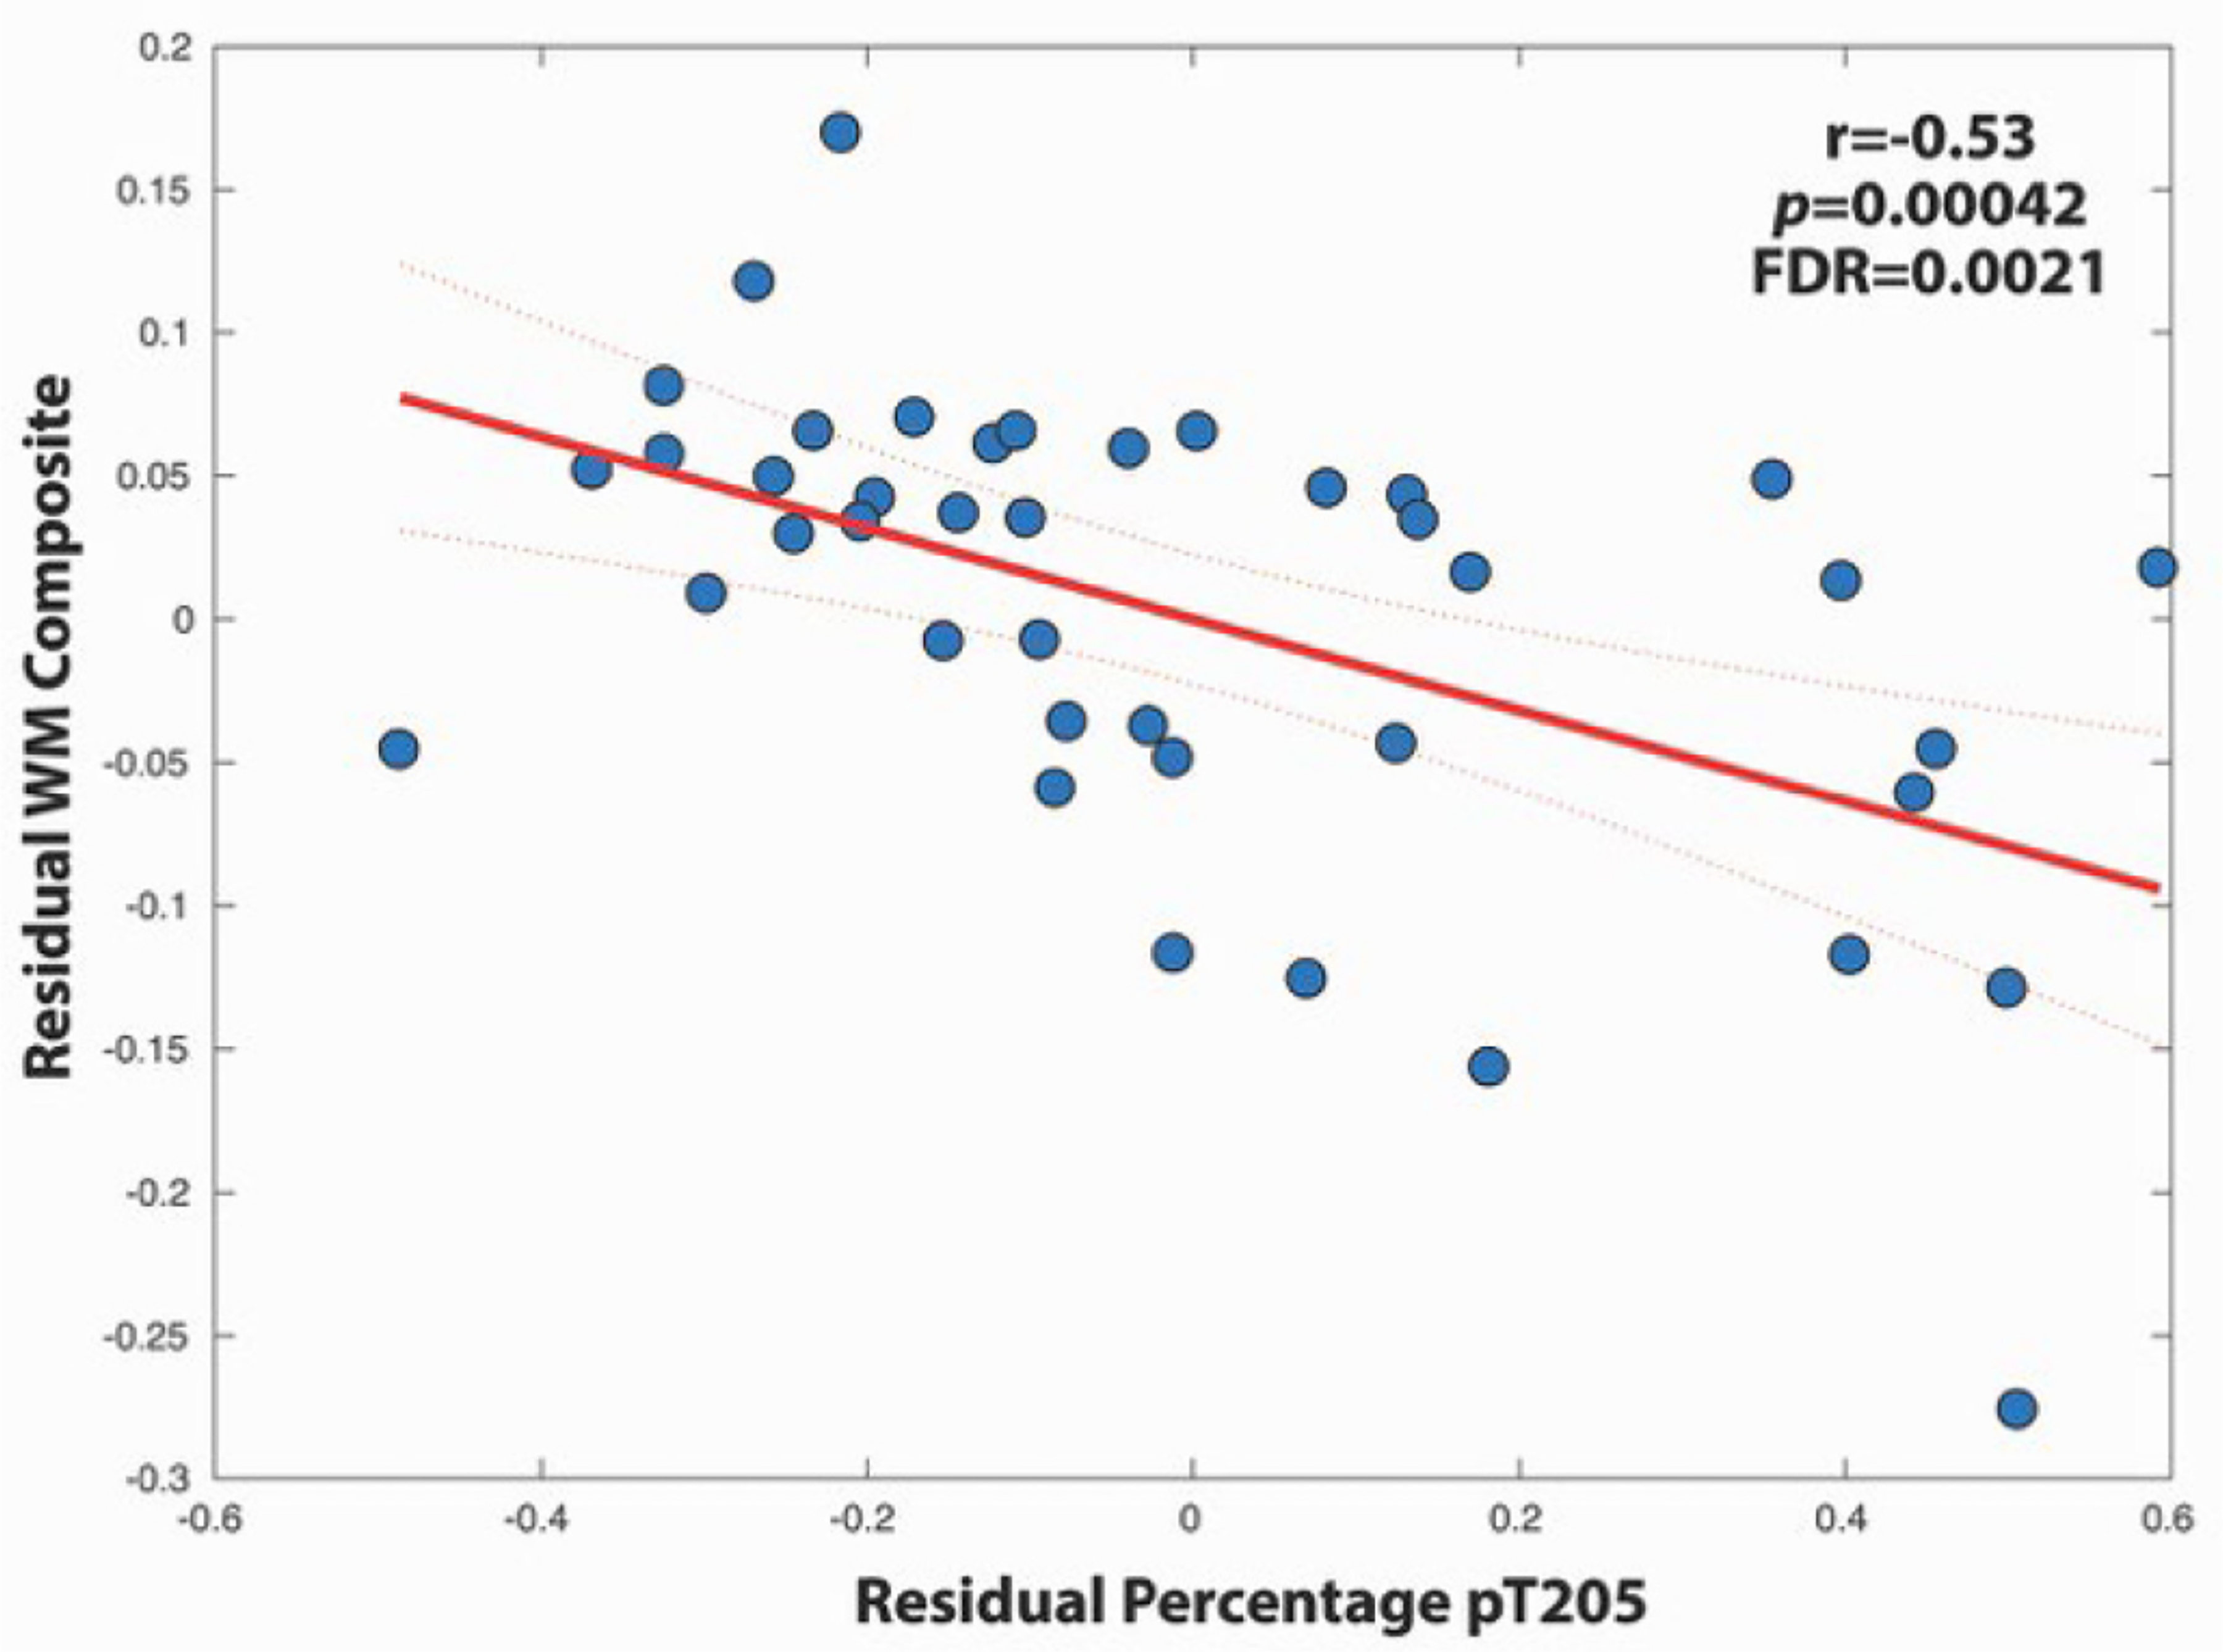
A negative relationship was observed between WM composite and the percentage of phosphorylation at site T205. Residual values were used after extracting the effects of age from the WM composite and tau site. Confidence intervals are set at 95%.
Fig. 3.
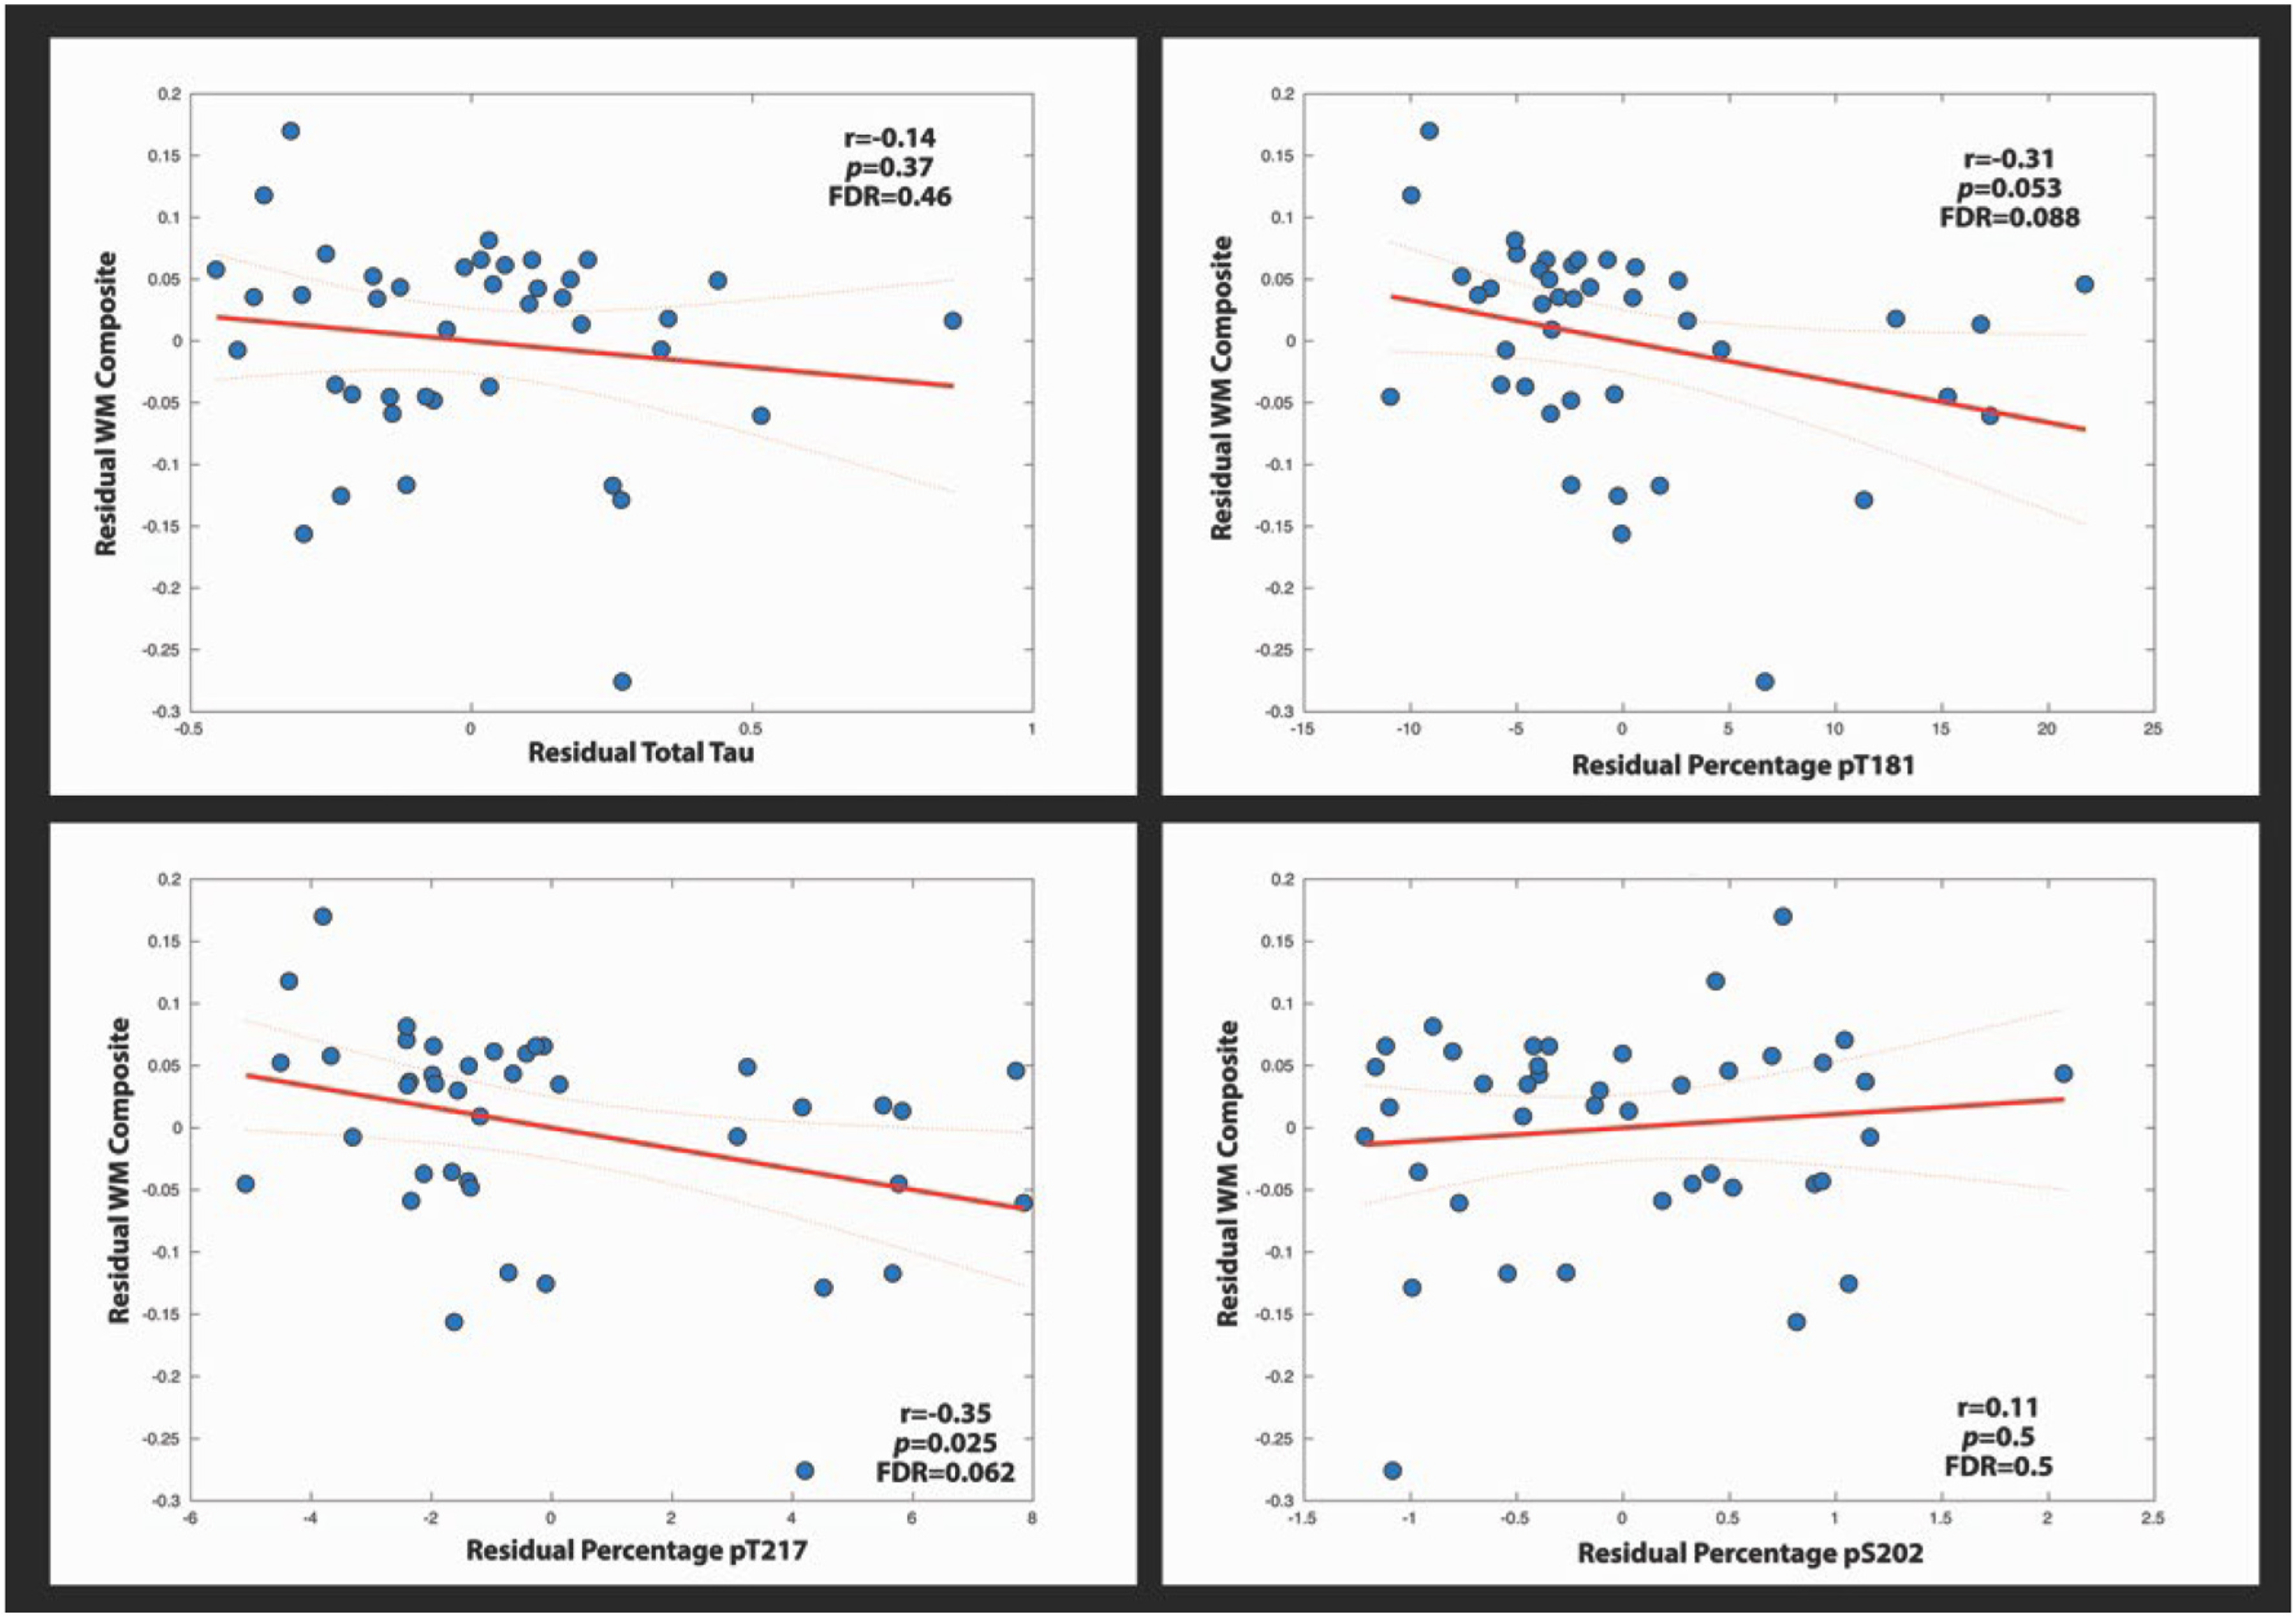
These linear plots show the relationship between the WM composite and the percentage of phosphorylation at various tau sites and total tau. Residual values were used after extracting the effects of age from the WM composite and tau site. Confidence intervals are set at 95%.
Fig. 4.
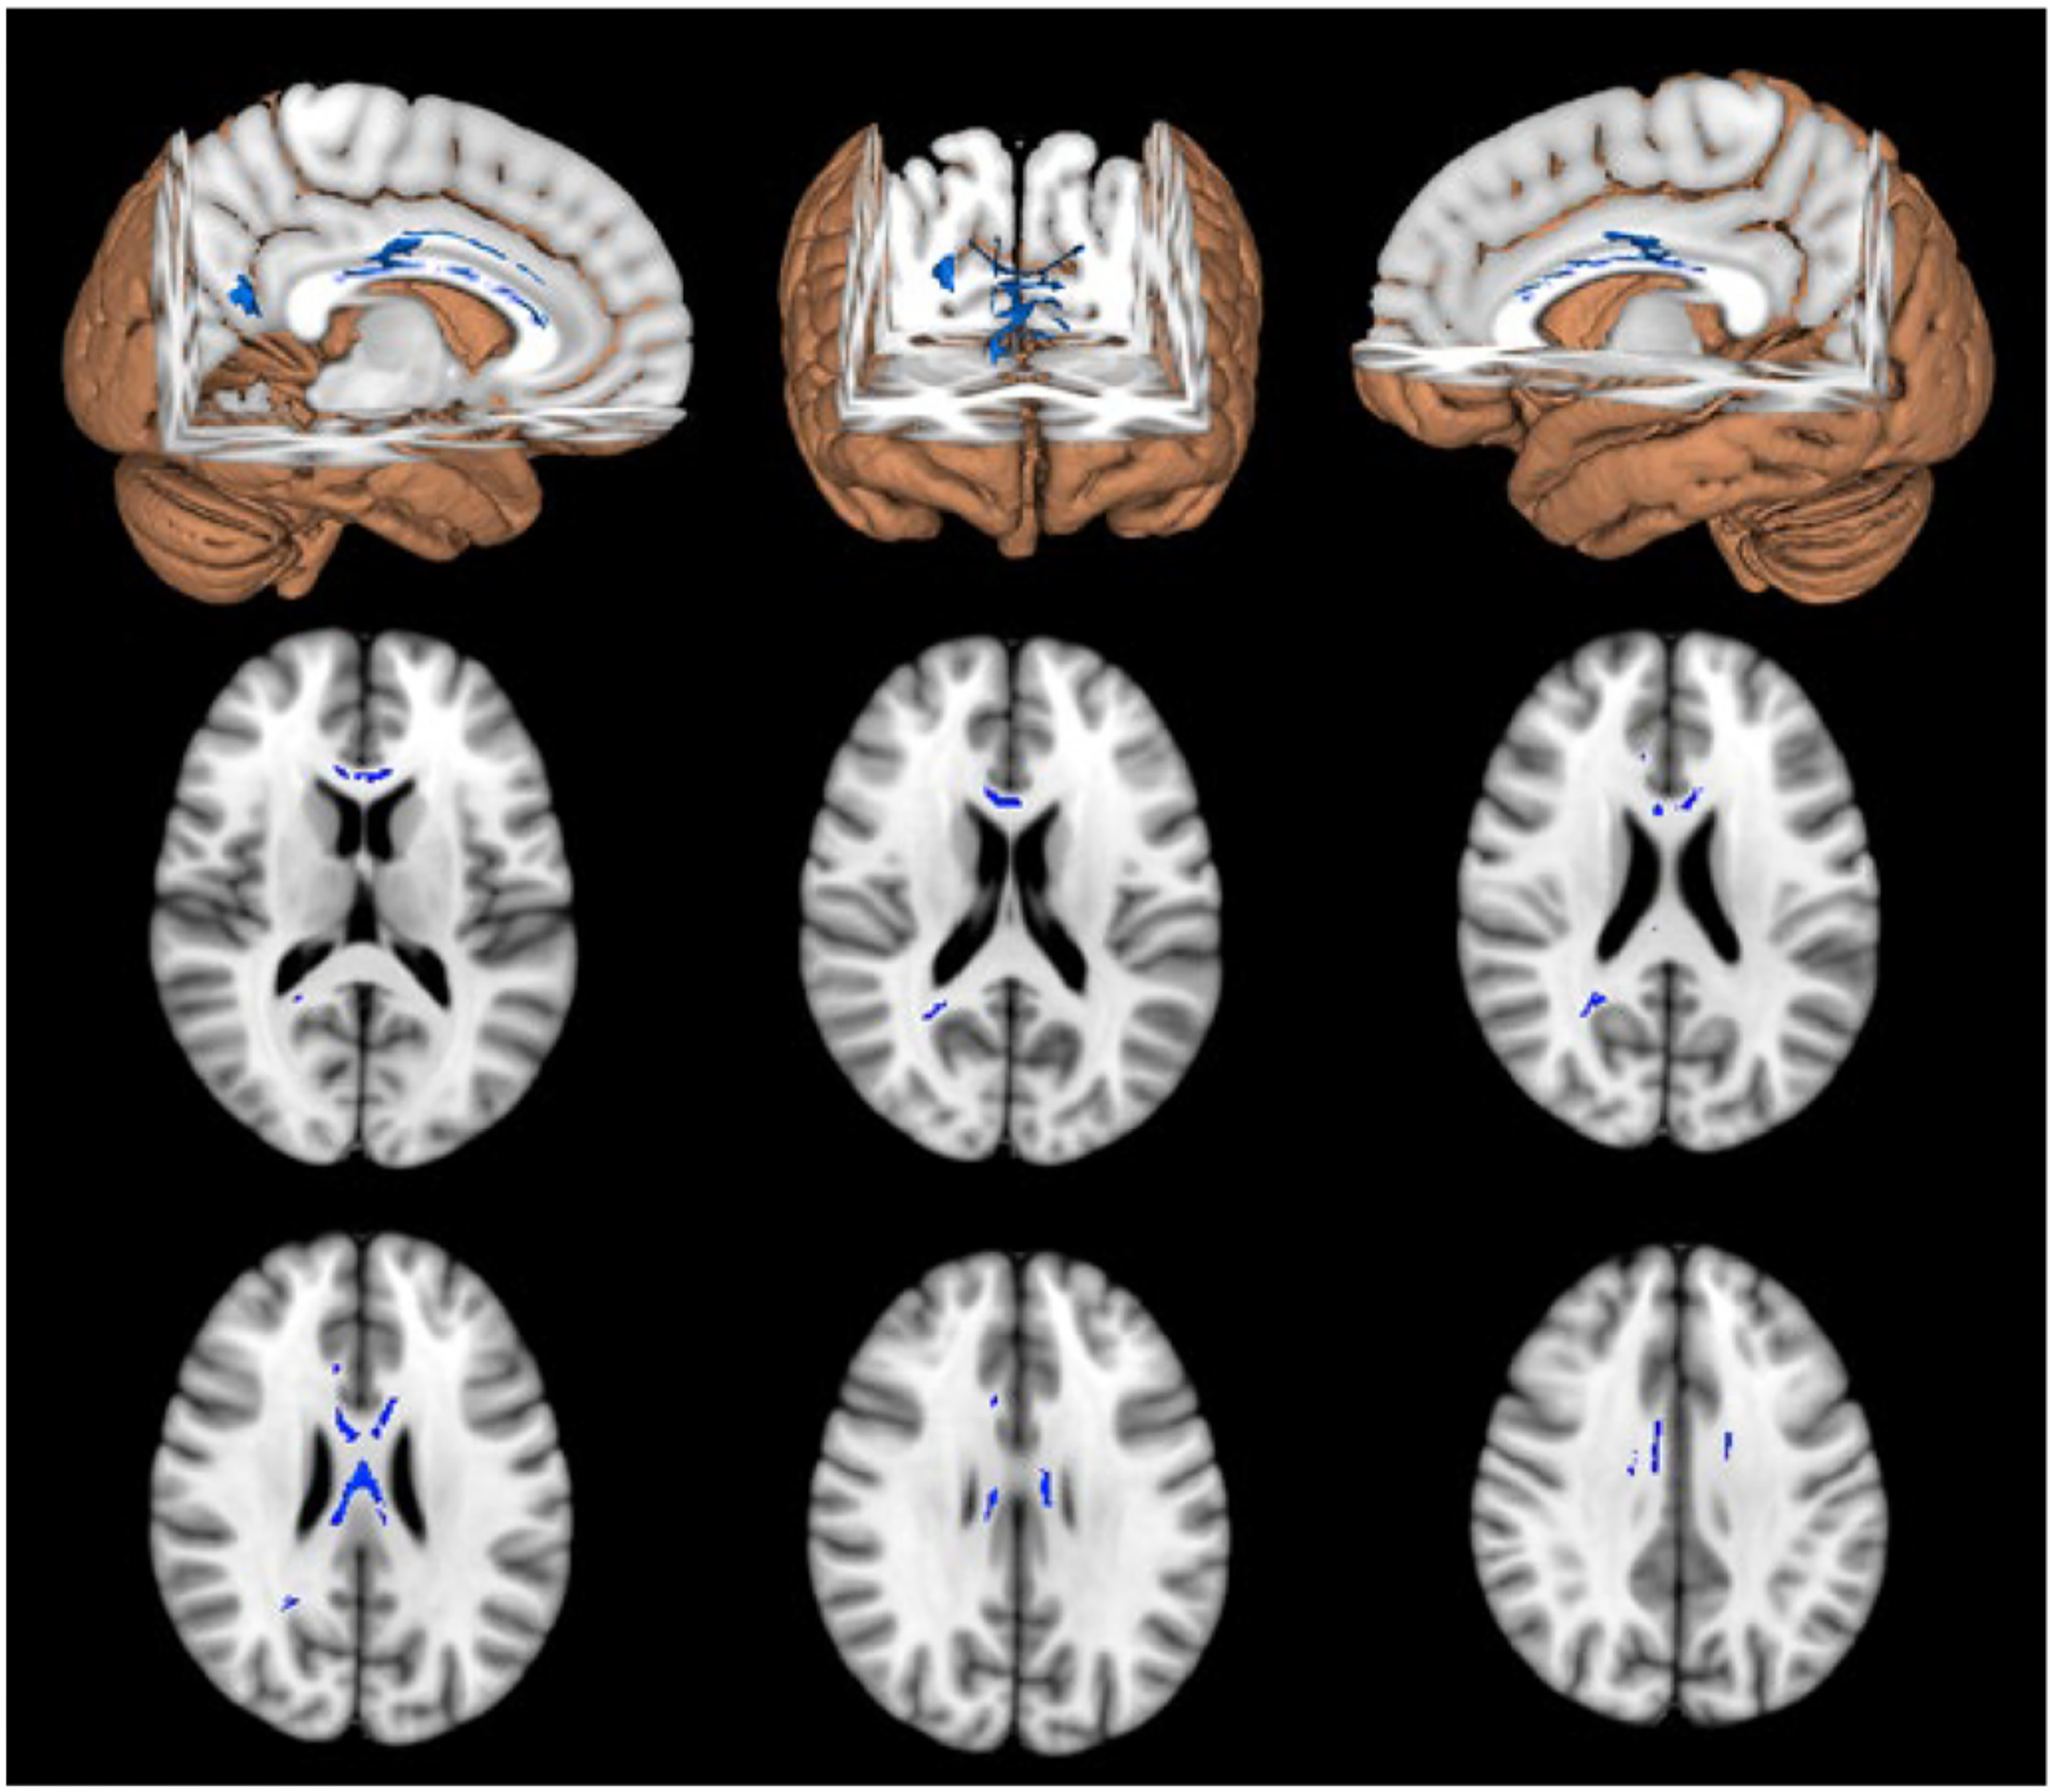
Results of the voxelwise correlation between PT205 and FA. Blue voxels represent significant voxels that survived the correction for MC. (For interpretation of the references to colour in this figure legend, the reader is referred to the web version of this article.)
3.4. WM composite correlation with EYO and cognitive performance
All individuals that had DTI and CSF were used in the following analysis (38 NC, and 72 MC). The WM composite was significantly associated with EYO for MC (F = 32.9, p < 0.001) but not NC (F = 1.32, p = 0.253) (Fig. 5, right panel). However, the association for the WM composite with EYO for the MC was not significantly different from the NC. Although no difference was observed for the regression for MC and NC only MC were significantly associated with increased disease severity (EYO). In contrast no significant decrease was observed in the NC.
Fig. 5.
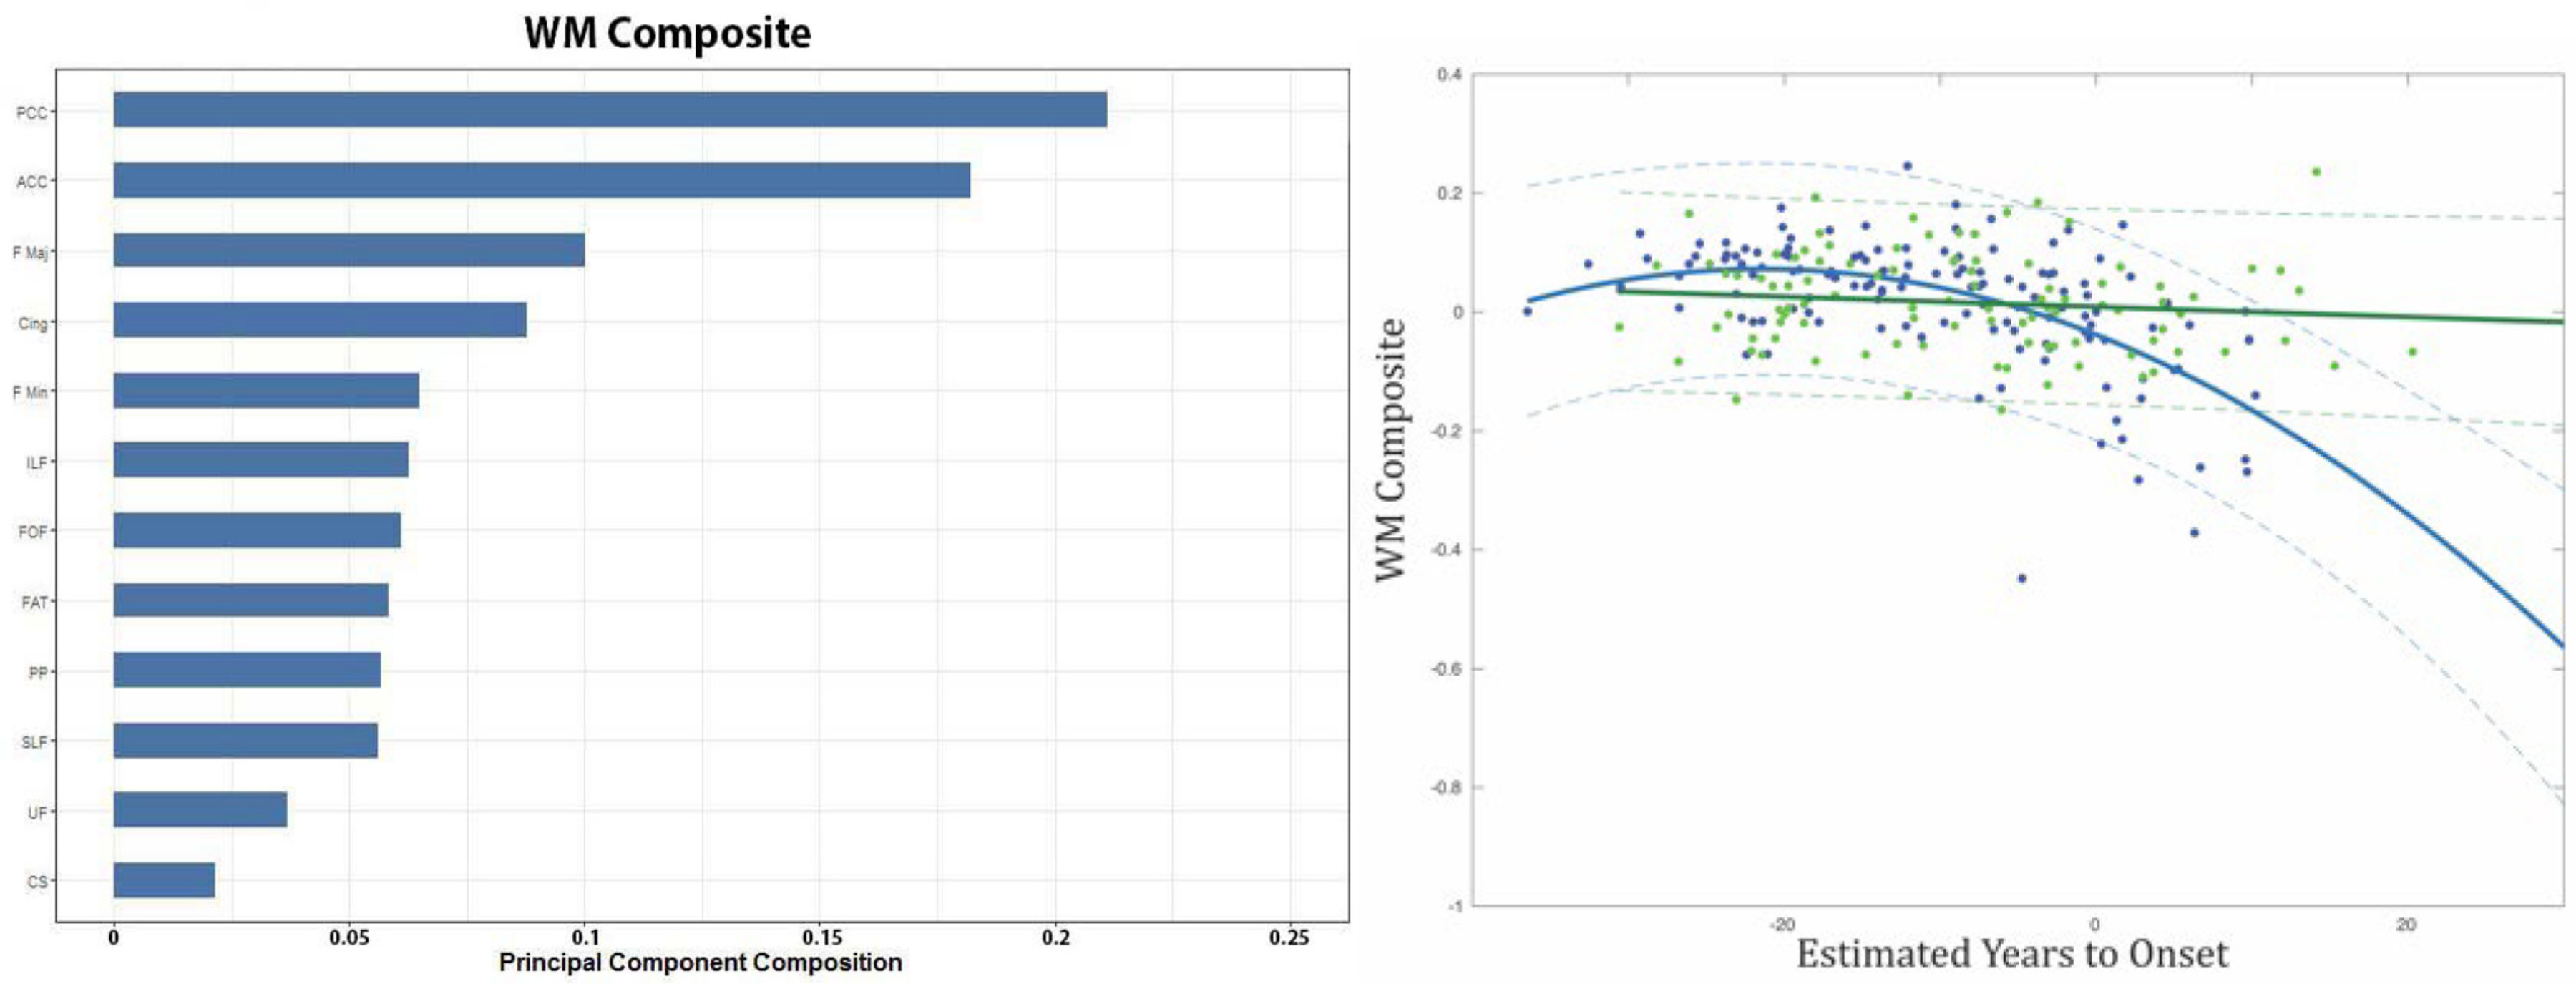
The left panel shows individual tracts involved in the white matter (WM) composite, with their corresponding weights in descending order for the PCA. The right panel shows the relationship between the WM Composite and estimate years to onset (EYO) for non-carriers (NC) (green) and MC (blue). 95% confidence were added for each group. For the fig. PCC = Posterior Corpus Callosum; ACC = Anterior Corpus Callosum; F Maj = Forceps Major; Cing = Cingulum; F Min = Forceps Minor; ILF = Inferior Longitudinal Fasciculus; FOF = Fronto occipital fasciculus; FAT = Frontal Aslant Tract; PP = Perforant Pathway; SLF = Superior Longitudinal Fasiculus; UF = Uncinate Fasciculus; CS = Corticospinal Tract. (For interpretation of the references to colour in this figure legend, the reader is referred to the web version of this article.)
Global cognitive performance was associated with the WM composite and each of the CSF Tau phosphorylation sites, but since the WM composite only correlated with phosphorylation at T205 we focused on this site for subsequent analyses. In MC, increases in the WM composite were associated with better cognitive performance (r = 0.64, p < 0.001) (Fig. 6: Left). Increases in CSF pT205 were also associated with worse cognition (r = 0.525, p < 0.001) (Fig. 6 Right). When assessing each of the separate cognitive domains significant associations were only seen for the memory (r = 0.26; p = 0.0039) and executive function (r = 0.29, p = 0.0011) domains. This relationship was only present for the entire MC cohort but does not survive after removal of CDR > 0 individuals. No relationship was observed for NC (not shown). A post hoc partial correlation between pT205 and cognition with DTI as a covariate remained significant although considerably weaker suggesting a partial mediation (r = −0.3, 0.047).
Fig. 6.
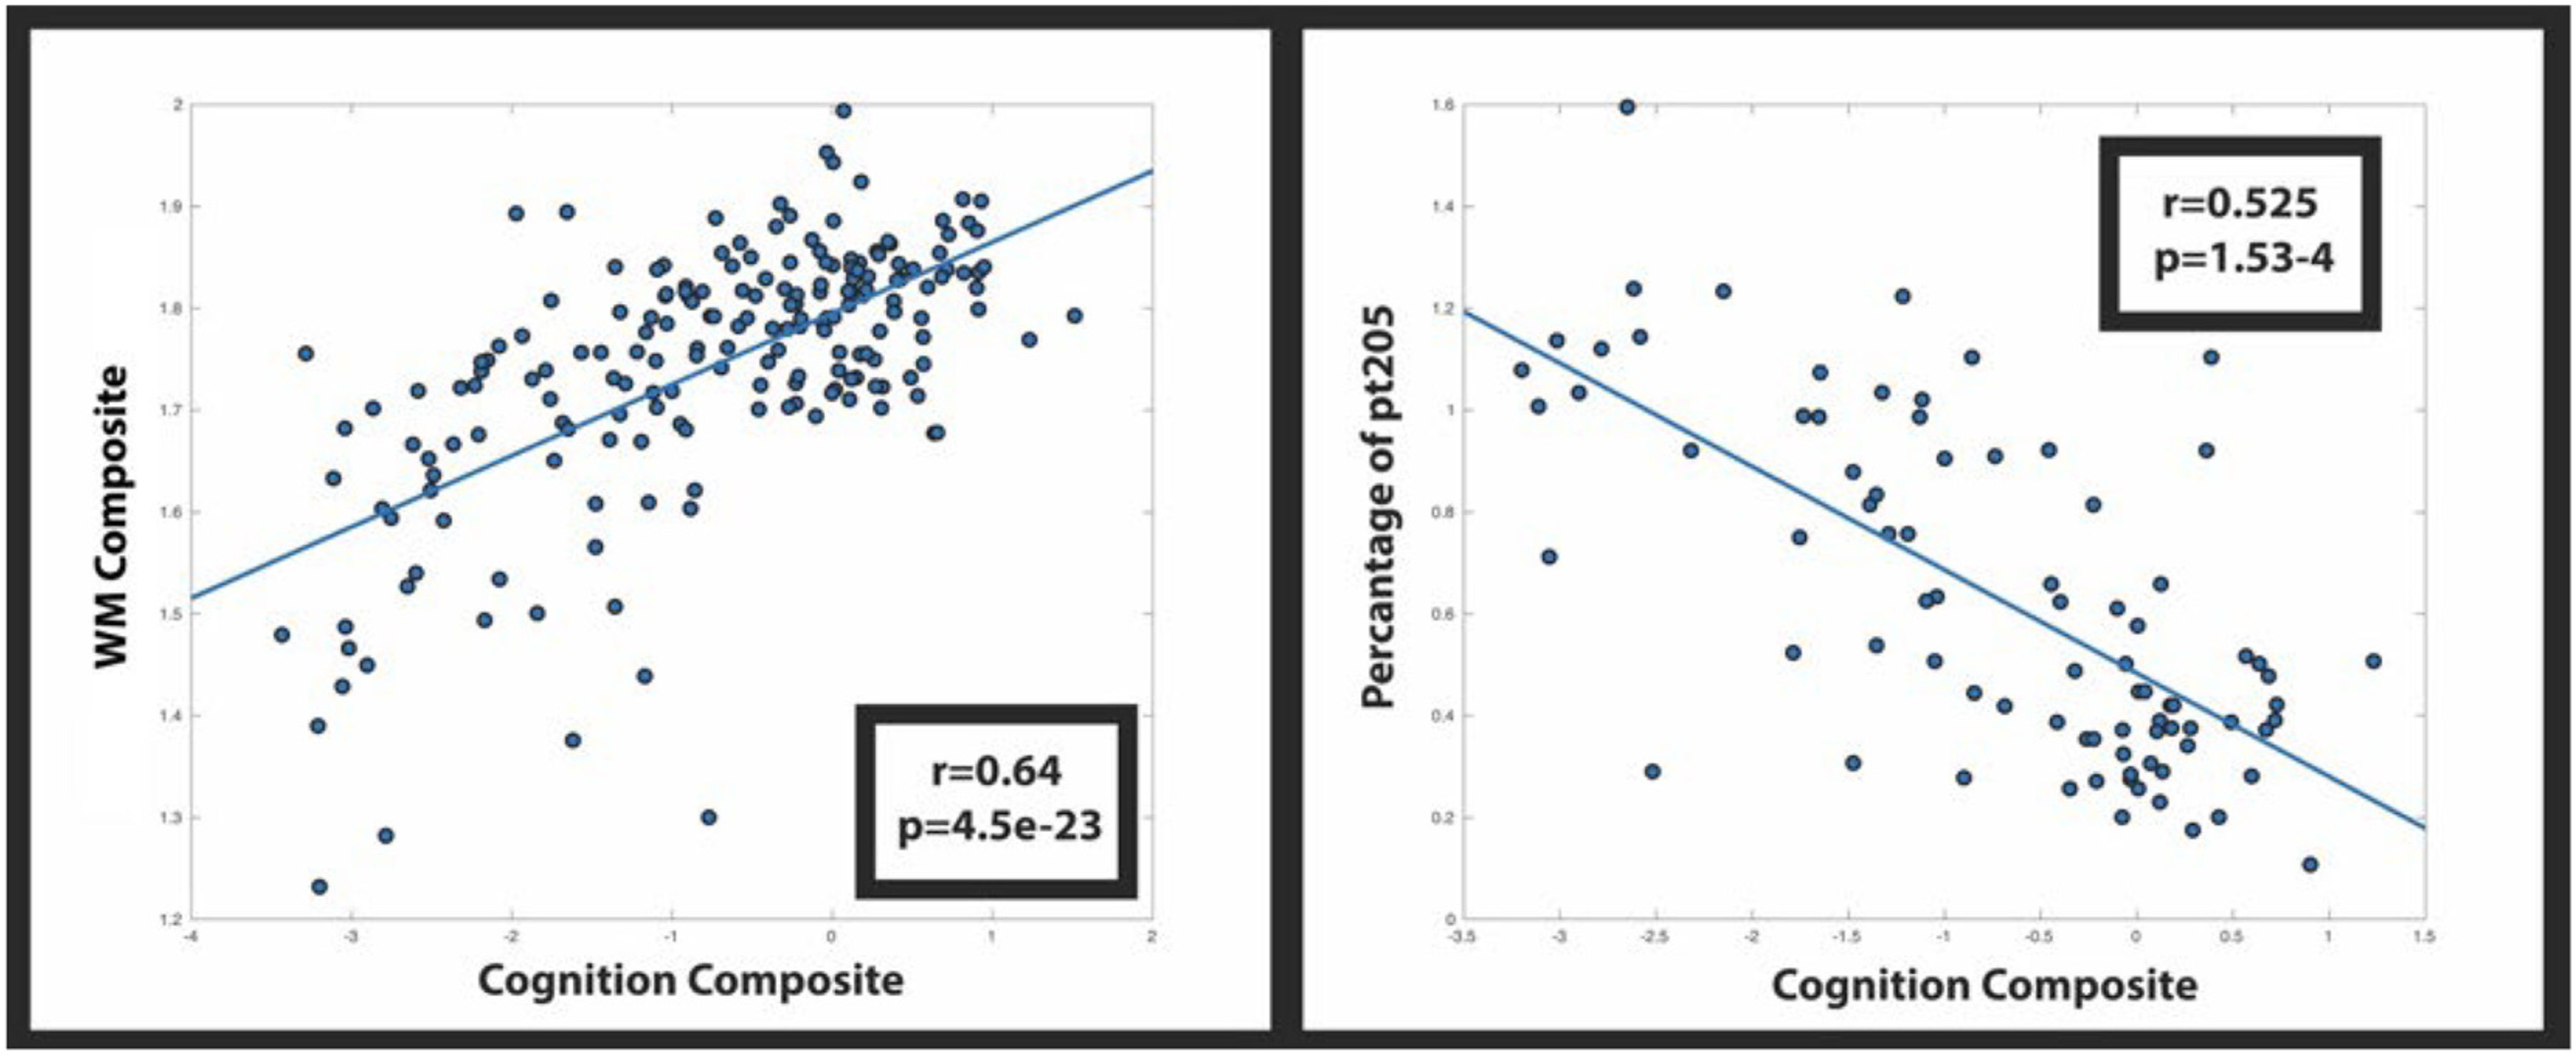
Correlation of cognition with the WM signature region (left) and phosphorylation occupancy at site T205 (Right).
3.5. Amyloid, GM, and CSF phosphorylation at T205 predict FA WM composite
All individuals that underwent multimodality imaging (amyloid, GM, WM, WMH) and had CSF were included into the following analysis (32 NC, 47 MC). Four linear regression models (each one included a different ptau site) were used to predict decline in the WM composite. In each model the overall linear regression model was significant (all p’s < 0.001) with large Cohen’s f effect sizes (all >0.9). CSF pT205 was the only site that contributed to predicting the WM composite (p = 0.021) in conjunction with amyloid (p = 0.026) and gray matter atrophy (p = 0.036) after correction for multiple comparisons (Table 2). In each of the linear models, regardless of CSF Tau phosphorylation site, amyloid and gray matter atrophy significantly predicted the WM composite. These data suggest the combination of amyloid, gray matter atrophy and specific Tau phosphorylation sites are associated with WM decline.
Table 2.
p-values for each variable and their contribution to the linear models for each of the CSF Tau phosphorylation sites. Each variable is attributed to a known cause of WM decline with amyloid as a metric of disease severity and cortical GM as a proxy for GM atrophy. Only CSF pT205 significantly contributed to the model with a trend level seen for CSF pT217.
| Age (p) | Amyloid (p) | WMH (p) | Cort (p) | Tau (p) | Model F(p) | Effect Size (f (Hu et al., 2016)) | |
|---|---|---|---|---|---|---|---|
|
| |||||||
| Total Tau | 0.35 | 0.023 | 0.2 | 0.008 | 0.67 | 7.64(3.8e-5) | 0.93 |
| PT181 | 0.35 | 0.023 | 0.21 | 0.011 | 0.23 | 8.14(2.1e-5) | 0.99 |
| PT205 | 0.39 | 0.026 | 0.2 | 0.036 | 0.021 | 9.8(3.3e-6) | 1.19 |
| PT217 | 0.38 | 0.017 | 0.19 | 0.019 | 0.2 | 8.23(1.9e-5) | 0.99 |
| PT202 | 0.079 | 0.045 | 0.2 | 0.012 | 0.85 | 5.4(8.8e-4) | 0.93 |
4. Discussion
WM changes were evaluated with regards to CSF Tau phosphorylation sites, EYO, and cognition in a cohort of MC and NC within the DIAN cohort. A WM composite was derived from a PCA to create a single scalar metric for each participant. Loss within this WM composite was associated with greater phosphorylation at only CSF pT205 and not other phosphorylation sites. In particular, WM loss was primarily seen within callosal and cingulate projections. Amyloid, gray matter and percentage of phosphorylation at site T205 significantly predicted FA WM composite independent of other sources of variance. Observed loss in the WM composite occurred near EYO and was correlated with cognitive performance both globally and within specific domains (memory and executive function). These results suggest that a lower WM composite is associated with increased phosphorylation at a specific tau site and occurs relatively late in AD progression.
The mechanism of phosphorylation specificity that may lead to a decrease in WM integrity loss remains unclear. Hyperphosphorylation can potentially lead to both a loss-of-function via the destabilization of microtubules (Feinstein and Wilson, 2005) structures or a toxic-gain-of function that can influence mitochondrial function (Wang and Mandelkow, 2016; Hoover et al., 2010; Lasagna-Reeves et al., 2011). Our data support the former given the strong association between hyperphosphorylation of T205 and WM decline. Although more work is necessary to understand the mechanism suggested here between pT205 and WM some distinctions can be made about this particular tau species. The ratio of phosphorylation at pT205 elevates around the time of clinical onset which is distinct from pT181 and pT217, which start to increase at the preclinical stage and can decline after onset (Horie et al., 2020b; Barthelemy et al., 2020b; Janelidze et al., 2020). Besides this temporal discrepancy, recent work from our colleagues has shown that different p-tau species can have different stoichiometry with regards to insoluble versus soluble state (Horie et al., 2020b). In that seminal paper, phosphorylated tau at pT181, pT217 and especially pS202 were more likely to be insoluble than soluble tau with an insoluble fraction of 30–60%. This implies that these p-tau species have higher propensity to be sequestered into insoluble tau. In contrast, pT205 had an insoluble fraction of approximately only 2% in the AD brain. Moreover, significant hyperphosphorylation of T205 found in AD soluble brain extract and CSF indicated only partial deposition of this species into tau aggregates even after AD onset, suggesting the continuous increase of pT205 in CSF along with the WM composite.
Tau phosphorylation alone did not predict WM decline as the presence of both amyloid and tau were significant predictors of WM burden (Mitew et al., 2010). In animal models of AD, increasing amyloid plaque load is associated with greater accumulation of phosphorylated T205 tau suggesting that amyloid plaques are a prerequisite for phosphorylation of tau at this site (Davila-Bouziguet et al., 2019). Furthermore, treatment interventions focused on removing amyloid plaque also reduce pT205 suggesting that amyloid may mediate Tau phosphorylation at this particular site (Barthelemy et al., 2020a). Prior work has also shown that pyroglutamate Aß, which is more associated with AD that other Aß variants (Prelli et al., 1988), is associated with memory decline (Sofola-Adesakin et al., 2016; Moro et al., 2018) and predicts pT205. In this study the presence of abnormalities in both amyloid and tau predicted WM loss, solidifying that pT205 is a strong candidate for the observed structural alterations seen in AD (Neddens et al., 2018).
Fractional anisotropy was the main DTI metric studied but disruption of this metric is driven by an imbalance of diffusion perpendicular to the axon (DR). An increase in DR can translate to a breakdown of hydrophobic properties of myelin. This predominantly reflects demyelination which suggest an underlying mechanism for observed WM decline. Although our data suggests that demyelination may be the underlying factor for observed changes in white matter, additional studies using advanced sequences that parcellate diffusion coefficient are needed. Understanding the relationship between WM loss and specific CSF Tau phosphorylation sites are important for deciphering the disease progression of AD and may facilitate the development of specific therapeutics.
Of the three post-translational mechanisms associated with AD, hyperphosphorylation of CSF tau is commonly linked to neurodegeneration and cognitive decline (Wang et al., 2013). In the current study only CSF pT205 was associated with WM composite loss. Recent work by our colleagues has shown that changes in CSF pT205 occur later in the disease process and coincide with the presence of NFTs (Mondragon-Rodriguez et al., 2014; Hoover et al., 2010; Lasagna-Reeves et al., 2011; Horie et al., 2020b; Barthelemy et al., 2020b; Janelidze et al., 2020; Mitew et al., 2010; Davila-Bouziguet et al., 2019; Prelli et al., 1988; Sofola-Adesakin et al., 2016; Moro et al., 2018; Neddens et al., 2018; Wang et al., 2013). When defined by the Braak stages pT205 is focally present in the hippocampus at Braak stage III/IV but disseminates to the temporal and cingulate cortices at later stages (V/VI) (Neddens et al., 2018). Our current findings are consistent with previous work as reductions in WM composite were seen near symptom onset and correlated with cognitive loss. The exact mechanism remains unknown but increases in pT205 could be initially protective due to the toxic environment (Devos and Hymen, 2017) but continued overexpression could cause axonal dysfunction (Kanaan et al., 2011). Additional longitudinal studies using WM composites are needed to support its application as a useful biomarker in later stages of AD. Furthermore, comparative studies in other disease models, including early-onset AD (EOAD), are needed to determine if a similar underlying mechanism is present in other younger affected populations.
The current results suggest that AD affects both gray matter (GM) and WM. Prior work by our colleagues have shown the changes in pT205 are associated with GM atrophy in AD individuals (Barthelemy et al., 2019). However, WM changes are also prominent in ADAD, who are younger and lack vascular comorbidities that are typically observed in LOAD cohorts. In a separate group of LOAD individuals we have shown that WM changes were associated with changes in regional tau PET (Strain et al., 2018). The current findings expand on this concept implicating that specific Tau phosphorylation sites may mediate WM changes. After including GM atrophy into our model CSF pT205 remained a significant predictor of WM composite loss suggesting WM loss not exclusively attributed to gray matter atrophy in ADAD. While our approach focused on generalized atrophy, similar results were seen when concentrating on local GM changes (e.g. precuneus). These findings suggest a WM specific mechanism occur in ADAD.
The spatial topography of the loss in the WM composite was specific for ADAD. Previous studies of LOAD have observed WM changes primarily within the temporal lobe and were associated with tau pathology (Strain et al., 2018). In ADAD, tau accumulation occurs earliest within posterior portions of the brain, especially the precuneus (Gordon et al., 2019). The primary WM pathways that contributed to WM composite loss included callosal tracts. This topography suggests that changes in posterior WM may be crucial for disease progression in ADAD. Further longitudinal studies of ADAD individuals are needed to identify additional areas that are subsequently susceptible to disease. The observed topography and lack of association with other CSF tau phosphorylated sites supports the concept that WM loss is not only spatially specific but site-specific for Tau phosphorylation.
There are several limitations to the current study. We focused on a subset of phosphorylation sites within a well characterized cohort of individuals with ADAD. As the technique for identifying the percentage of phosphorylation at specific sites improves, additional studies that focus on the combination of Tau phosphorylation sites that best associate with loss of WM integrity. This study was the first to incorporate DTI and other imaging modalities with CSF Tau phosphorylation sites but did not include other biofluid information (e.g. inflammation or metabolic factors). Future studies are needed to examine additional mechanisms that may be involved in WM decline associated with specific Tau phosphorylation sites. CSF analyses by its nature quantifies soluble tau species and is unlikely a direct measure of intracellular tau aggregation. Additional longitudinal studies of WM integrity are needed to more robustly evaluate the nature of neuronal dysfunction with disease progression. Finally, ADAD believe to be an excellent model for evaluating AD progression as EYO is known. However, differences exist between ADAD and LOAD. Future studies are needed to confirm if these results are applicable to LOAD.
In summary, this study evaluated the role of white matter integrity loss in association with specific CSF Tau phosphorylation sites in ADAD. We identified a WM composite that was significantly different in MC compared to NC. The spatial topography of WM loss included the callosum and cingulate. Observed WM composite loss occurred near symptom onset (EYO 0) and were associated with global and domain specific cognitive decline and appeared to be facilitated by the presence of both amyloid accumulation and hyperphosphorylation of tau at a specific site.
Acknowledgements
This work would not have been possible without the dedication and contribution from our participants. We additionally thank all of the research centers and affiliated partners that comprise the Dominantly Inherited Alzheimer Network. This research was funded by the National Institutes of Health (NIH: UFAG032438, UL1TR000448, P30NS098577, R01AG052550, R01EB009352, R01NR012907, R01NR012657, R01NR014449, P50AG05681, P01AG003991, P01AG026276, P30NS048056, UL1TR000448, R01AG04343404, and NSF grant DMS1300280), the German Center for Neurodegenerative Diseases (DZNE), the national institute for Health Research (NIHR) Queen Square Dementia Biomedical Research Centre, and the Medical Research Council Dementias Platform UK (MR/L023784/1 and MR/009076/1).
There are several inventions that have been filed by WashU for patents, including “Methods of diagnosing AD with phosphorylation changes”. This intellectual property owned by WashU can be or is licensed and some licensing income may be distributed to Drs. Barthelemy, Bateman, McDade and Sato and other inventors. This intellectual property being licensed by Washington University from C2N and currently being utilized in our research have been reviewed by the Washington University COI and ICOI committees. All co-inventors, including some lab members, Dr. Holtzman, the University, and Dr. Barthelemy, Bateman, McDade and Sato could receive part of the profits from any sales of these tests by C2N, which is in the process of licensing or has licensed some IP from the University. In addition, Dr. Holtzman and the University have a financial investment in C2N, such as stock or ownership interest. There is the potential for Dr. Holtzman and the University to gain or lose value of C2N ownership depending on the results of these studies. Dr. Holtzman also serves on the Scientific Advisory Board for C2N. These activities have been reviewed by Washington University’s (WU) Conflicts of Interest Review Committee in accordance with WU’s Research Conflicts of Interest Policy and WU’s Institutional Conflict of Interest Review Committee in accordance with WU’s Institutional Conflict of Interest Policy.
Data collection and sharing for this project was supported by the Dominantly Inherited Alzheimer’s Network (DIAN, UF1AG032438) funded by the National Institute on Aging (NIA), the German Center for Neurodegenerative Diseases (DZNE), Raul Carrea Institute for Neurological Research (FLENI), and partial support by the Research and Development Grants for Dementia from Japan Agency for Medical Research and Development, AMED, and the Korea Health Technology R&D Project through the Korea Health Industry Development Institute (KHIDI). The primary contact of DIAN is Dr. Randall J. Bateman. This manuscript has been reviewed by DIAN Study investigators for scientific content and consistency of data interpretation with previous DIAN Study publications. We acknowledge the altruism of the participants and their families and contributions of the DIAN research and support staff at each of the participating sites for their contributions to this study. We acknowledge the financial support of Fred Simmons and Olga Mohan, the Barnes-Jewish Hospital Foundation, the Charles F. and Joanne Knight Alzheimer’s Research Initiative, the Hope Center for Neurological Disorders, the Mallinckrodt Institute of Radiology, the Daniel Brennan MD Fund, and the Paula and Rodger O. Riney Fund. Data management and computations were made possible using the facilities of the Washington University Center for High-Performance Computing, and the Central Neuroimaging Data Archive (CNDA)/Neuroimaging Informatics and Analysis Center (NIAC) (1P30NS098577, R01 EB009352). J.F.S. is supported in part by BrightFocus Foundation grant A2018817F. N.J.M. is supported in part by the Alzheimer’s Association Research Fellowship (AARFD-20-681815).
Footnotes
Author credit statement
Jeremy F. Strain: Processed the DTI data, performed the analyses, interpreted the results and constructed the manuscript.
Nicolas Barthelemy: Processed the CSF data with Mass Spectrometry, assisted in the interpretation of the results and assisted in the manuscript.
Kanta Horie: Assisted in the processing of the CSF data with Mass Spectrometry, assisted in the interpretation of the results and assisted in the manuscript.
Brian A. Gordon: Assisted in the interpretation of the results and assisted in the manuscript.
Collin Kilgore: Assisted in the DTI processing, interpretation of the results and reviewed the manuscript.
Andrew Aschenbrenner: Assisted in the interpretation of the results and reviewed the manuscript.
Carlos Cruchaga: Assisted in the interpretation of the results and reviewed the manuscript.
Chengjie Xiong: Assisted in the interpretation of the results and reviewed the manuscript.
Nelly Joseph-Mathurin: Assisted in the interpretation of the results and reviewed the manuscript.
Jason Hassenstab: Assisted in the interpretation of the results and reviewed the manuscript.
Anne M. Fagan: Assisted in the interpretation of the results and reviewed the manuscript.
Yan Li: Assisted in the interpretation of the results and reviewed the manuscript.
Celeste M. Karch: Assisted in the interpretation of the results and reviewed the manuscript.
Richard Perrin: Assisted in the interpretation of the results and reviewed the manuscript.
Sarah B. Berman: Assisted in the interpretation of the results and reviewed the manuscript.
Jasmeer P. Chhatwal: Reviewed the Manuscript and is a constituent of the DIAN network.
Neill R. Graff-Radford: Reviewed the Manuscript and is a constituent of the DIAN network.
Hiroshi Mori: Reviewed the Manuscript and is a constituent of the DIAN network.
Johannes Levin: Reviewed the Manuscript and is a constituent of the DIAN network.
James Noble: Reviewed the Manuscript and is a constituent of the DIAN network.
Ricardo Allegri: Reviewed the Manuscript and is a constituent of the DIAN network.
Peter R. Schofield: Reviewed the Manuscript and is a constituent of the DIAN network.
Daniel S. Marcus: Reviewed the Manuscript and is a constituent of the DIAN network.
David M. Holtzman: Assisted in the interpretation of the results and reviewed the manuscript. John C. Morris: Assisted in the interpretation of the results and reviewed the manuscript.
Tammie L.S. Benzinger: Assisted in the interpretation of the results and reviewed the manuscript.
Eric M. McDade: Assisted in the processing of the CSF data with Mass Spectrometry, assisted in the interpretation of the results and assisted in the manuscript.
Randall J. Bateman: Oversees the acquisition and processing of the phosphorylation tau site data, assisted in the interpretation of the results and reviewed the manuscript.
Beau M. Ances: Managed the project, discussed the imaging methodology, assisted in the interpretation of the results and reviewed the manuscript.
References
- Barron M, Gartlon J, Dawson LA, Atkinson PJ, Pardon M, 2017. A state of delirium: deciphering the effect of inflammation on tau pathology in Alzheimer’s disease. Exp. Gerontol. 94, 103–107. [DOI] [PMC free article] [PubMed] [Google Scholar]
- Barthelemy NR, Mallipeddi N, Moiseyev P, Sato C, Bateman RJ, 2019. Tau phosphorylation rates measured by mass spectrometry diff in the intracellular brain vs extracellular cerebrospinal fluid compartments and are differentially affected by Alzheimer’s disease. Front. Aging Neurosci. 11, 121. [DOI] [PMC free article] [PubMed] [Google Scholar]
- Barthelemy NR, Li Y, Joseph-Mathurin N, et al. , 2020a. A soluble phosphorylated tau signature links tau, amyloid and the evolution of stages of dominantly inherited Alzheimer’s disease. Nat. Med. 26, 398–407. [DOI] [PMC free article] [PubMed] [Google Scholar]
- Barthelemy NR, Bateman RJ, Hirtz C, Marin P, Becher F, et al. , 2020b. Cerebrospinal fluid phospho-tau T217 outperforms T181 as a biomarker for the differential diagnosis of Alzheimer’s disease and PET amyloid-positive patient identification. Alzeimer’s Res. & Ther. 12, 26. [DOI] [PMC free article] [PubMed] [Google Scholar]
- Bateman RJ, Xiong C, Benzinger TLS, Fagan AM, Goate A, et al. , 2012. Clinical and biomarkers changes in dominantly inherited Alzheimer’s disease. N. Engl. J. Med. 9, 795–804. [DOI] [PMC free article] [PubMed] [Google Scholar]
- Bateman RJ, Benzinger TL, Berry S, et al. , 2017. The DIAN-TU next generation Alzheimer’s prevention trial: adaptive design and disease progression model. Alzheimers Dement. 13, 8–19. [DOI] [PMC free article] [PubMed] [Google Scholar]
- Bloom GS, 2014. Amyloid-B and Tau the trigger and bullet in Alzheimer Disease Pathogenesis. JAMA Neurol. 71, 505–508. [DOI] [PMC free article] [PubMed] [Google Scholar]
- Davila-Bouziguet E, Targa-Fabra G, Avila J, Soriano E, Pascual M, 2019. Differential accumulation of tau phosphorylated at residues Thr231, Ser262 and Thr205 in hippocampal interneurons and its modulation by tau mutations (VLW) and amyloid-ß peptide. Neurobiol. Dis. 125, 232–244. [DOI] [PubMed] [Google Scholar]
- Devos SL, Hymen BT, 2017. Tau at the crossroads between neurotoxicity and neuroprotection. Neuron 94, 703–704. [DOI] [PubMed] [Google Scholar]
- Donohue MC, Sperling RA, Salmon DP, et al. , 2014. The preclinical Alzheimer cognitive composite measuring amyloid-related decline. JAMA Neurol 71, 961–970. [DOI] [PMC free article] [PubMed] [Google Scholar]
- Feinstein SC, Wilson L, 2005. Inability of tau to properly regulate neuronal microtubule dynamics: a loss-of-function mechanism by which tau might mediate neuronal cell death. Biochim. Biophys. Acta 1739, 268–279. [DOI] [PubMed] [Google Scholar]
- Folstein MF, Folstein SE, Mchugh PR, 1975. “Mini-mental state”: a practical method for grading the cognitive state of patients for the clinician. J. Psychiatr. Res. 12, 189–198. [DOI] [PubMed] [Google Scholar]
- Gordon BA, Blazey TM, Christensen J, et al. , 2019. Tau PET in autosomal dominant Alzheimer’s disease: relationship with cognition, dementia and other biomarkers. Brain 142, 1063–1076. [DOI] [PMC free article] [PubMed] [Google Scholar]
- Hoover BR, Reed MN, Su J, Penrod RD, et al. , 2010. Tau Mislocalization to dendritic spines mediates synaptic dysfunction independently of neurodegeneration. Neuron 68, 1067–1081. [DOI] [PMC free article] [PubMed] [Google Scholar]
- Horie K, Barthélemy NR, Mallipeddi N, et al. , 2020a. Regional correlation of biochemical measures of amyloid and tau phosphorylation in the brain. Acta Neuropathol. Commun. 8, 149. [DOI] [PMC free article] [PubMed] [Google Scholar]
- Horie K, Barthélemy NR, Mallipeddi N, et al. , 2020b. Regional correlation of biochemical measures of amyloid and tau phosphorylation in the brain. Acta Neuropathol. Commun. 8, 149. [DOI] [PMC free article] [PubMed] [Google Scholar]
- Hu W, Zhang X, Tung YC, Xie S, Liu F, Iqbal K, 2016. Hyperphosphorylation determines both the spread and the morphology of tau pathology. Alzheimers Dement. 12, 1066–1077. [DOI] [PubMed] [Google Scholar]
- Jack CR, Bernstein MA, Borowski BJ, et al. , 2008. The Alzheimer’s disease neuroimaging initiative (ADNI): MRI methods. J. Magn. Reson. Imaging 27, 685–691. [DOI] [PMC free article] [PubMed] [Google Scholar]
- Janelidze S, Mattsson N, Palmqvist S, Smith R, Beach TG, et al. , 2020. Plasma P-tau181 in Alzheimer’s disease: relationship to other biomarkers, differential diagnosis, neuropathology and longitudinal progression to Alzheimer’s dementia. Nat. Med. 26, 379–386. [DOI] [PubMed] [Google Scholar]
- Kanaan NM, Morfini GA, La Pointe NE, Pigino GF, et al. , 2011. Pathogenic Formas of tau inhibit kinesin-dependent axonal transport through a mechanism involving activation of axonal phosphotransferases. JNeurosci 27, 9858–9868. [DOI] [PMC free article] [PubMed] [Google Scholar]
- Kimura T, Sharma G, Ishiguro K, Hisanaga S, 2018. Phospho-tau bar code: analysis of phosphoisotypes of tau and its application to taupathy. Front. Neurosci. 10.3389/fnins.2018.00044. [DOI] [PMC free article] [PubMed] [Google Scholar]
- Lasagna-Reeves CA, Castillo-Carranza DL, Sengupta U, Clos AL, Jackson GR, Kayed R, 2011. Tau oligomers impair memory and induce synaptic and mitochondrial dysfunction in wild-type mice. Mol. Neurodegener. 6, 39. [DOI] [PMC free article] [PubMed] [Google Scholar]
- Maillard P, Carmichael O, Harvey D, Fletcher E, Reed B, Mungas D, DeCarli C, 2013. FLAIR and diffusion MRI signals are independent predictors of white matter Hyperintensities. AJNR Am. J. Neuroradiol. 34, 54–61. [DOI] [PMC free article] [PubMed] [Google Scholar]
- McDade E, Wang G, Gordon BA, Hassenstab J, et al. , 2018. Longitudinal cognitive and biomarker changes in dominantly inherited Alzheimer disease. Neurology 91, e1295–e1306. [DOI] [PMC free article] [PubMed] [Google Scholar]
- Mitew S, Kirkcaldie TK, Halliday GH, Shepherd CE, Vickers JC, Dickson TC, 2010. Focal demyelination in Alzheimer’s disease and transgenic mouse models. Acta Neuropathol. 119, 567–577. [DOI] [PubMed] [Google Scholar]
- Molloy CJ, Nugent S, Bokde ALW, 2021. Alterations in diffusion measures of white matter integrity associated with healthy aging. J. Gerontol. 76, 945–954. [DOI] [PubMed] [Google Scholar]
- Mondragon-Rodriguez S, Perry G, Luna-Munoz J, Acevedo-Aquino MC, Williams S, 2014. Phosphorylation of tau protein at sites Ser396–404 is one of the earliest events in Alzheimer’s disease and down syndrome. Neuropathol. Appl. Neurobiol. 40, 121–135. [DOI] [PubMed] [Google Scholar]
- Moro ML, Phillips AS, Gaimster K, Paul C, Mudher A, Nicoll JAR, Boche D, 2018. Pyroglutamate and Isoaspartate modified amyloid-Beta in ageing and Alzheimer’s disease. Acta Neurpathol. Commun. 6, 3. [DOI] [PMC free article] [PubMed] [Google Scholar]
- Morris JC, 1993. The clinical dementia rating (CDR): current version and scoring rules. Neurology 43, 2412–2414. [DOI] [PubMed] [Google Scholar]
- Musi N, Valentine JM, Sickora KR, et al. , 2018. Tau protein aggregation is associated with cellular senescence in the brain. Aging Cell 17, e12840. [DOI] [PMC free article] [PubMed] [Google Scholar]
- Neddens J, Temmel M, Flunkert S, Kerschbaumer B, Hoeller C, et al. , 2018. Phosphorylation of different tau sites during progression of Alzheimer’s disease. Acta Neuropathologica Commun. 6, 52. 10.1186/s40478-018-0557-6. [DOI] [PMC free article] [PubMed] [Google Scholar]
- Pierpaoli C, Jezzard P, Basser PJ, Barnett Chiro DG, 1996. Diffusion tensor MR imaging of the human brain. Radiology 201, 637–648. [DOI] [PubMed] [Google Scholar]
- Prelli F, Castano E, Glenner GG, Frangione B, 1988. J.Neurochem 51, 648–651. [DOI] [PubMed] [Google Scholar]
- Shahpasand K, Uemura I, Saito T, Asano T, Hata K, et al. , 2012. Regulation of mitochondrial transport and inter-microtubule spacing by tau phosphorylation at the sites hyperphosphorylated in Alzheimer’s disease. J. Neurol. 32, 2430–2441. [DOI] [PMC free article] [PubMed] [Google Scholar]
- Sintini I, Schwarz CG, Martin PR, Graff-Radford J, et al. , 2018. Regional multimodal relationships between tau hypometabolism, atrophy, and fractional anisotropy in atypical Alzheimer’s disease. Hum. Brain Mapp. 40, 1618–1631. [DOI] [PMC free article] [PubMed] [Google Scholar]
- Smith SM, Jenkinson M, Johansen-Berg H, et al. , 2006. Tract-based spatial statistics: Voxelwise analysis of multi-subject diffusion data. NeuroImage 31, 1487–1505. [DOI] [PubMed] [Google Scholar]
- Sofola-Adesakin O, Khericha M, Snoeren I, Tsuda L, Partridge L, 2016. pGluAB increases accumulation of AB in vivo and exacerbates its toxicity. Acta Neuropathol. Commun. 4, 109. [DOI] [PMC free article] [PubMed] [Google Scholar]
- Storandt M, Balota DA, Aschenbrenner AJ, et al. , 2014. Clinical and psychological characteristics of the initial cohort of the Dominantly inherited Alzheimer Network (DIAN). Neuropsychology 28, 19–29. [DOI] [PMC free article] [PubMed] [Google Scholar]
- Strain JS, Didehbani N, Spence J, et al. , 2017. White matter changes and confrontation naming in retired aging National Football League Athletes. J. Neurotrauma 372–379. [DOI] [PMC free article] [PubMed] [Google Scholar]
- Strain JF, Smith RX, Beaumont H, et al. , 2018. Loss of white matter integrity reflects tau accumulation in Alzheimer disease defined regions. Neurology 91, e313–e318. [DOI] [PMC free article] [PubMed] [Google Scholar]
- Su Y, Blazey TM, Synder AZ, et al. , 2015. Partial volume correction in quantitative amyloid imaging. Neuroimage 107, 55–64. [DOI] [PMC free article] [PubMed] [Google Scholar]
- Wang Y, Mandelkow E, 2016. Tau in physiology and pathology. Nature 17, 22–35. [DOI] [PubMed] [Google Scholar]
- Wang J, Xia Y, Inge G, Iqbal K, 2013. Abnormal Hpyerphosphorylation of tau: sites, regulation, and molecular mechanism of neurofibrillary degeneration. JAD 33, S129–S139. [DOI] [PubMed] [Google Scholar]
- Wang SS, Zhang Z, Zhu T, et al. , 2018. Myelin injury in the central nervous system and Alzheimer’s disease. Brain Res. Bull. 140, 162–168. [DOI] [PubMed] [Google Scholar]
- Wechsler D, 1981. Wechsler Adult Intelligence Scale-Revised. The Psychological Corporation, San Antonion, TX. [Google Scholar]
- Wechsler D, 1987. The Wechsler Memory Scale-Revised. The Psychological Corporation, San Antonio, TX. [Google Scholar]
- Winkler AM, Ridgway GR, Webster MA, Smith SM, Nichols TE, 2014. Permutation inference for the general linear model. NeuroImage 92, 381–397. [DOI] [PMC free article] [PubMed] [Google Scholar]