

Abstract
Background
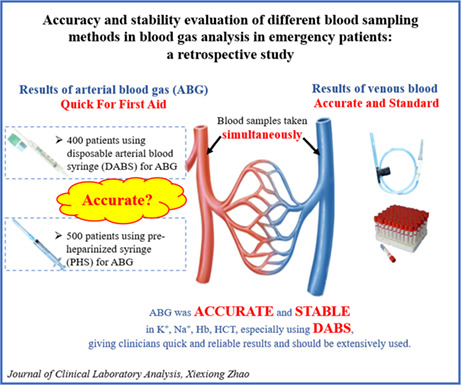
To evaluate the accuracy and stability of arterial blood gas (ABG) results by comparison with venous measurements from routine blood tests, and to compare the accuracy and performance of two sampling syringes, pre‐heparinized syringe (PHS) and disposable arterial blood syringe (DABS), in ABG analysis.
Methods
We retrospectively analyzed the practical use of PHS and DABS in collecting ABG samples, involving 500 and 400 patients, respectively. For each patient, in addition to the ABG sample, a venous blood sample was also collected using a venous blood collection tube (VBCT) and used for routine blood tests. Accordingly, patients were referred to as the PHS + VBCT group and DABS + VBCT group. The correlation between arterial and venous values of each blood parameter in each group was evaluated using the interclass correlation coefficient (ICC). Bland–Altman was performed to evaluate the agreement between arterial and venous values and compare the performance of PHS and DABS in ABG sample collection.
Results
In the PHS + VBCT group, arterial K+, Na+, hemoglobin (Hb), and hematocrit (HCT) were 0.32 mmol/L, 2.90 mmol/L, 2.21 g/L, and 1.27% significantly lower their corresponding venous values while arterial Cl− was 7.60 mmol/L significantly higher than venous Cl−. In the DABS + VBCT group, arterial K+ and Na+ were 0.20 mmol/L and 1.19 mmol/L significantly lower while Cl− and HCT in arterial blood were 5.34 mmol/L and 0.66% significantly higher than their corresponding venous values. In both groups, arterial K+, Na+, Hb, and HCT values were highly consistent with their corresponding venous values, with all ICCs greater than 0.70, especially Hb and HCT. Bland–Altman analysis demonstrated that arterial K+ and Na+ were more consistent with venous counterparts in the DABS + VBCT group, with a narrower 95% limits of agreement than the PHS + VBCT group (K+, −0.7‐0.3 mmol/L vs. −1.1 to 0.5 mmol/L; Na+, −5.8 to 3.4 mmol/L vs. −8.2 to 2.4 mmol/L).
Conclusion
Arterial blood gas analysis of K+, Na+, Hb, and HCT using PHS or DABS for blood sampling is accurate and stable, especially DABS, which can provide clinicians with fast and reliable blood gas results.
Keywords: accuracy, arterial blood gas analysis, disposable arterial blood syringe, pre‐heparinized syringe, retrospective study, stability
Accuracy and stability evaluation of different blood sampling methods in blood gas analysis in emergency patients: a retrospective study.
1. INTRODUCTION
As an important test in emergency and critically ill patients, arterial blood gas (ABG) is the gold standard for assessing oxygenation status and acid–base balance. This test quickly provides a patient’ electrolytes (i.e., potassium (K+), sodium (Na+), and chlorine (Cl−)), hemoglobin (Hb), hematocrit (HCT), and other blood parameters. 1 , 2 , 3 , 4 In the event of a sudden change in a patient's condition, ABG analysis can provide clinicians with immediate vital signs reports, rather than waiting for laboratory venous results to delay emergency care. Typically, ABG test results are available within 10 min, while venous blood test results using a venous blood collection tube (VBCT) for blood sampling have a turnaround time of at least 2 h.
In practice, however, many clinicians are skeptical of ABG test results including K+, Na+, Hb, and HCT levels, arguing that these measurements are too unreliable to help make correct management decisions, 5 while some hold an opposite opinion. 6 , 7 , 8 Venous blood gas (VBG) is another method of assessing blood gas variables that is less painful and easier to perform than ABG. ABG and VBG test results are not always interchangeable, such as PCO2 and PO2. While ABG test results such as oxygen saturation 9 , 10 and the relationship between ABG and peripheral VBG 11 , 12 measurements are receiving increasing attention, few studies have focused on the relationship between ABG and VBCT test results. Equally important, the accuracy and reliability of ABG quantities including K+, Na+, Hb, and HCT require further evaluation.
In the past, ABG specimens were often collected using pre‐heparinized syringes (PHS) containing 0.4% heparin sodium solution. In recent years, disposable arterial blood syringes (DABS) have widely been applied in clinical practice. Therefore, this study aimed to compare the accuracy and stability of ABG analysis of K+, Na+, Cl−, Hb, and HCT with venous blood test results using VBCT for blood sampling, and to compare the actual effect of PHS and DABS in ABG sample collection.
2. METHODS
This article was prepared in agreement with the STrengthening the Reporting of OBservational studies in Epidemiology (STROBE) statement. 13
2.1. Study subjects
Patients who visited the emergency department of the Third Xiangya Hospital of Central South University from August 1, 2018 to May 30, 2019 were included in this study.
2.1.1. Inclusion criteria
Patients with venous blood samples for serum electrolytes and routine blood tests and arterial blood samples for ABG testing. These data can be obtained from the medical information system.
Patients with venous blood and arterial blood samples drawn at intervals of no more than 10 min. 7 , 11 This information can be identified from medical orders and nursing records.
2.1.2. Exclusion criteria
Patients with unknown timing of venous blood and arterial blood sample collection.
Patients with unknown arterial blood collection method after reviewing the patient price list recorded in the medical information system.
2.2. Estimation of sample size
Before the study, 100 patients with PHS for ABG analysis (PHS group) and 100 patients with DABS for ABG analysis (DABS group) were pre‐investigated to estimate the sample size required for each parameter (K+, Na+, Cl−, Hb, and HCT) by using the Power Analysis & Sample Size (PASS, Version 11.0.7) with α = 0.05 and power = 90%. The target sample size was achieved by increasing the maximum sample size for all parameters by 20%. Finally, we calculated an estimated sample size of n = 500 for the PHS group and n = 400 for the DABS group. Since in these two groups of patients, peripheral venous blood was also collected with a VBCT for serum electrolytes and routine blood tests, these two groups are further referred to as PHS + VBCT group and DABS + VBCT group.
2.3. Sampling and data collection
We selected the first 50 and 40 eligible patients monthly (for 10 months from August 2018 to May 2019) in the PHS + VBCT and DABS + VBCT groups, respectively, 14 and extracted their demographic characteristics, including sex and age, admission time, VBCT (e.g., serum K+, Na+, Cl−, Hb, and HCT) values, ABG sample collection method, and ABG values. Data input was done independently by two investigators, and inconsistencies after data reconciliation were rechecked by a third person. The extreme values found during the data analysis were further confirmed by a fourth person.
ABG samples were collected using PHS or DABS (BD Preset™, 3 ml) and analyzed immediately after artery puncture on a blood gas analyzer (ABL 800 FLEX, Radiometer) next to the emergency room. The analyzer automatically calibrated every 1 h. Venous blood samples were collected with a common VBCT syringe and sent to the Central Laboratory of the Third Xiangya Hospital of Central South University. Routine blood tests were performed on an automated hematology analyzer (XE‐5000, Sysmex Europe GmbH), and electrolytes were analyzed on an automatic biochemical analyzer (Hitachi 7600, Hitachi Limited). In ABG analysis, the reference ranges for K+, Na+, Cl−, Hb, and HCT were 3.5–5.0 mmol/L, 135–145 mmol/L, 96–106 mmol/L, 11–16 g/dl, and 37%–55%, respectively, and the reference ranges in VBCT samples were 3.5–5.3 mmol/L, 137.0–147.0 mmol/L, 99.0–110.0 mmol/L, 130–175 g/L, and 40%–50%, respectively.
2.4. Statistical analyses
Data were tabulated in Microsoft Excel spreadsheets and exported to Statistical Package for the Social Sciences version 23.0 (SPSS Inc.) for statistical analysis. Continuous variables (e.g., K+, Na+, Cl−, Hb, and HCT) are presented as mean ± standard deviation (SD), and categorical variables (e.g., sex) are presented as numbers and percentages. Interclass correlation coefficient (ICC) and paired t test were used to compare arterial and venous test results in the same patient. Independent t test and Bland–Altman plot were used to compare measured values between the PHS + VBCT and DABS + VBCT groups. Chi‐square test (χ 2) was used to test for differences between enumerated data. Subgroups of sex and age were also analyzed. The difference between arterial and venous blood measurement values greater than three times SD was defined as the extreme value, 15 which was compared in the PHS + VBCT and DABS + VBCT groups. To more accurately evaluate the difference between arterial and venous blood test results and to understand the significance of the difference, we defined the relative difference (RD), where RD = (|ABG value‐VBCT value|/VBCT value) × 100%. A p‐value < 0.05 was considered significant.
3. RESULTS
3.1. Patient characteristics
Table 1 summarizes the demographic and clinical characteristics of the patient participants. According to the sample size requirements, 500 and 400 patients were retrospectively evaluated in the PHS + VBCT group and the DABS + VBCT group, respectively. There were no differences in male proportions (64.80% vs. 65.25%, p = 0.888) and age distributions (63.55 ± 16.82 vs. 62.86 ± 15.65, p = 0.532) between the PHS + VBCT and DABS + VBCT groups, indicating that the patient composition of the two groups is comparable.
TABLE 1.
Characteristics of study subjects.
| PHS + VBCT | DABS + VBCT | p | |
|---|---|---|---|
| Case (N) | 500 | 400 | ‐ |
| Male (N, %) | 324 (64.80) | 261 (65.25) | 0.888 |
| Age (years) | 63.55 ± 16.82 | 62.86 ± 15.65 | 0.532 |
Note: In the PHS + VBCT group, PHS was used to draw arterial blood for blood gas analysis (ABG) and a venous blood collection tube (VBCT) was used to draw venous blood for routine blood tests. In the DABS + VBCT group, DABS was used for ABG sampling and VBCT was used blood routine.
Abbreviations: DABS, disposable arterial blood syringe; PHS, pre‐heparinized syringe; VBCT, venous blood collection tube.
3.2. Blood results of different blood sources and blood sampling methods
Blood results are summarized in Table 2. In the PHS + VBCT group, arterial K+, Na+, Hb, and HCT were 0.32 mmol/L, 2.90 mmol/L, 2.21 g/L, and 1.27% significantly lower than their corresponding venous values while arterial Cl− was 7.60 mmol/L significantly higher than venous Cl−. Among the differences in the measured values of arterial and venous blood in the PHS + VBCT group, the RD of K+ was the highest (9.58), and the RD of Na+ was the lowest (2.38).
TABLE 2.
Differences between arterial and venous values in the PHS + VBCT and DABS + VBCT groups.
| PHS + VBCT (N = 500) | DABS + VBCT (N = 400) | p (For difference) | |||||||
|---|---|---|---|---|---|---|---|---|---|
| PHS | VBCT | Difference | RD | DABS | VBCT | Difference | RD | ||
| K+ (mmol/L) | 3.79 ± 0.75 | 4.11 ± 0.72 | −0.32 ± 0.40* | 9.58 ± 7.00 | 3.89 ± 0.70 | 4.09 ± 0.71 | −0.20 ± 0.28* | 6.27 ± 5.20 | <0.001 |
| Na+ (mmol/L) | 135.19 ± 5.02 | 138.09 ± 4.87 | −2.90 ± 2.71* | 2.38 ± 1.58 | 136.80 ± 5.69 | 137.98 ± 5.13 | −1.19 ± 2.35* | 1.49 ± 1.25 | <0.001 |
| Cl− (mmol/L) | 108.74 ± 7.42 | 101.15 ± 6.42 | 7.60 ± 5.06* | 7.75 ± 5.35 | 107.62 ± 8.38 | 102.28 ± 6.45 | 5.34 ± 6.12* | 6.35 ± 4.98 | <0.001 |
| Hb (g/L) | 113.93 ± 31.10 | 116.14 ± 31.04 | −2.21 ± 7.99* | 4.80 ± 6.77 | 119.62 ± 32.28 | 118.73 ± 30.82 | 0.90 ± 10.00 | 4.9 0 ± 7.90 | <0.001 |
| HCT (%) | 35.12 ± 9.36 | 36.39 ± 9.59 | −1.27 ± 2.86* | 6.41 ± 6.85 | 36.84 ± 9.72 | 36.18 ± 9.22 | 0.66 ± 3.23* | 5.72 ± 8.00 | <0.001 |
Note: RD = |ABG result ‐ VBCT result |/ VBCT result × 100%.
Abbreviations: ABG, arterial blood gas; DABS, disposable arterial blood syringe; PHS, pre‐heparinized syringe; RD, relative difference; VBCT, venous blood collection tube.
p < 0.05 between ABG and VBCT values in each group.
In the DABS + VBCT group, arterial K+ and Na+ were 0.20 mmol/L and 1.19 mmol/L significantly lower than their corresponding venous values while Cl− and HCT in arterial blood were 5.34 mmol/L and 0.66% significantly higher than their corresponding venous values. No arteriovenous Hb difference was observed. Among the differences in the measured values of arterial and venous blood in the DABS + VBCT group, the RDs of K+ and Cl− were the highest (6.27 and 6.35, respectively), and the RD of Na+ was still the lowest (1.49).
Compared with the PHS + VBCT group, the differences in the arterial and venous values of all test parameters in the DABS + VBCT group were significantly smaller (Table 2). Bland–Altman plot (Figure 1) showed that arterial K+ and Na+ were more consistent with venous counterparts in the DABS + VBCT group, with a narrower 95% limits of agreement (95% LoA) than the PHS + VBCT group (95% LoA of K+, −0.7 to 0.3 mmol/L for the DABS + VBCT group vs. −1.1 to 0.5 mmol/L for the PHS + VBCT group; 95% LoA of Na+, −5.8 to 3.4 mmol/L for the DABS + VBCT group vs. −8.2 to 2.4 mmol/L for the PHS + VBCT group). While Cl−, Hb, and HCT were more consistent in the PHS + VBCT group with a narrower 95% LoA (95% LoA of Cl−, −6.7 to 17.3 mmol/L for the DABS + VBCT group vs. −2.3 to 17.5 mmol/L for the PHS + VBCT group; 95% LoA of Hb, −18.7 to 20.5 g/L for the DABS + VBCT group vs. −17.9 to 13.5 g/L for the PHS + VBCT group; 95% LoA of HCT, −5.7 to 7.0 mmol/L for the DABS + VBCT group vs. ‐6.9 to 4.3 mmol/L for the PHS + VBCT group).
FIGURE 1.

Bland–Altman plot of ABG and VBCT results. The horizontal axis represents the average of ABG and VBCT results. The vertical axis represents the difference between ABG and VBCT results (ABG‐VBCT). DABS, disposable arterial blood syringe; PHS, pre‐heparinized syringe; VBCT, venous blood collection tube.
3.3. Correlation between ABG and VBCT values
In both PHS + VBCT and DABS + VBCT groups, ABG values for K+, Na+, Hb, and HCT were highly consistent with VBCT values for these parameters, with all ICCs greater than 0.70, especially Hb and HCT, which had ICCs greater than 0.90. Compared with the PHS + VBCT group, the ICCs of K+ and Na+ in the DABS + VBCT group were larger (K+, ICC = 0.887 for the DABS + VBCT group vs. 0.781 for the PHS + VBCT group; Na+, ICC = 0.885 for the DABS + VBCT group vs. 0.725 for the PHS + VBCT group) (Table 3), suggesting that DABS is more reliable for ABG analysis.
TABLE 3.
Interclass correlation coefficient between arterial and venous values.
| PHS + VBCT (N = 500) | DABS + VBCT (N = 400) | |
|---|---|---|
| K+ | 0.781 | 0.887 |
| Na+ | 0.725 | 0.885 |
| Cl− | 0.459 | 0.531 |
| Hb | 0.965 | 0.950 |
| HCT | 0.946 | 0.940 |
Abbreviations: ABG, arterial blood gas; DABS, disposable arterial blood syringe; PHS, pre‐heparinized syringe; VBCT, venous blood collection tube.
3.4. Subgroup analysis
We further assessed the performance of PHS and DABS in ABG analysis by conducting sex and age‐based subgroup analysis. For the sex subgroup analysis (Table S1), similar results were observed in both sex subgroups. For both sexes in the PHS + VBCT group, K+, Na+, Hb, and HCT in arterial blood were significantly lower than the corresponding venous parameters, while Cl− in arterial blood was significantly higher than venous Cl−. For both sexes in the DABS + VBCT group, arterial K+ and Na+ were significantly lower than venous K+ and Na+, while arterial Cl− was significantly higher than venous Cl−. For Hb and HCT in the DABS + VBCT group, only HCT showed significantly differences between arterial and venous blood in male patients. Overall, regardless of sex, DABS was more accurate than PHS due to smaller differences between arterial and venous values in the DABS + VBCT group. Moreover, similar results were observed in subgroup analysis by age (Table S2). These data confirm that our conclusions regarding ABG analysis and the performance of DABS over PHS are robust, independent of sex and age.
3.5. Extreme value analysis
Extreme values often have a huge impact on clinical decision‐making. For almost all parameters tested, more extreme values were found in the PHS + VBCT group than in the DABS + VBCT group (Table 4). The proportions of K+, Na+, Cl−, Hb, and HCT extreme values in the PHS + VBCT group were 1.40%, 0.80%, 1.80%, 1.80%, and 2.00%, respectively, while the proportions of extreme values of these parameter in the DABS + VBCT group were 1.25%, 0.75%, 1.25%, 1.75%, and 2.00%, respectively. Not only that, the extreme value deviations of all measured parameters were also more obvious in the PHS + VBCT group. The extreme value ranges of K+, Na+, Cl−, Hb, and HCT in the PHS + VBCT group were 0.87 to 3.90 mmol/L, −12.60 to 8.00 mmol/L, −23.20 to 34.40 mmol/L, −32.00 to 93.00 g/L, and −9.80% to 29.30%, respectively. Comparatively, the extreme value ranges of K+, Na+, Cl−, Hb, and HCT in the DABS + VBCT group were −1.42 to 0.64 mmol/L, 7.10–14.50 mmol/L, 23.00 to 43.00 mmol/L, −77.00 to 28.00 g/L, and −22.20% to 8.50%, respectively.
TABLE 4.
Extreme values analysis in the PHS + VBCT and DABS + VBCT groups.
| PHS + VBCT (N = 500) | DABS + VBCT (N = 400) | |||||
|---|---|---|---|---|---|---|
| N (%) | Maximum (RD) | Minimum (RD) | N (%) | Maximum (RD) | Minimum (RD) | |
| DK+ (mmol/L) | 7 (1.40) | 3.90 (82.98) | 0.87 (12.03) | 5 (1.25) | −1.42 (26.69) | 0.64 (9.33) |
| DNa+ (mmol/L) | 4 (0.80) | −12.60 (9.03) | 8.00 (5.80) | 3 (0.75) | 14.50 (11.84) | 7.10 (5.59) |
| DCl− (mmol/L) | 9 (1.80) | 34.40 (35.61) | −23.20 (22.05) | 5 (1.25) | 43.00 (61.43) | 23.00 (22.12) |
| DHb (g/L) | 9 (1.80) | 93.00 (68.89) | −32.00 (27.83) | 7 (1.75) | −77.00 (67.54) | 28.00 (40.58) |
| DHCT (%) | 10 (2.00) | 29.30 (72.89) | −9.80 (27.53) | 8 (2.00) | −22.20 (64.72) | 8.50 (21.96) |
Note: DK+, DNa+, DCl−, DHb, DHCT, difference of K+, Na+, Cl−, Hb, HCT between ABG and VBCT results.
Abbreviations: DABS, disposable arterial blood syringe; PHS, pre‐heparinized syringe; RD, relative difference; VBCT, venous blood collection tube.
4. DISCUSSION
Although ABG analysis is a very important test for acute and critically ill patients, the accuracy and stability of arterial electrolytes and Hb are controversial. 16 Therefore, we retrospectively evaluated the accuracy and stability of these ABG parameters by comparing different blood sources (arterial vs. venous) and arterial blood sampling methods (PHS vs. DABS). We found that ABG values for K+, Na+, Hb, and HCT were accurate and stable using either arterial blood sampling method, especially DABS. We support that ABG testing, especially by DABS, can provide clinicians with fast and reliable results and should be widely available.
K+ blood test has an extremely important role in acute and critically ill patients. Potassium disorder can lead to adverse consequences such as malignant arrhythmia and even sudden death. 17 Therefore, potassium disorder should be detected and treated at the first time. First, we examined K+ levels in arterial and venous specimens. We found that arterial K+ levels were consistently significantly lower than venous K+ levels, regardless of the type of syringes used for arterial blood collection. Although the absolute differences in K+ levels between arterial and venous values (0.32 mmol/L for the PHS + VBCT group and 0.20 mmol/L for the DABS + VBCT group) was small, K+ had a relatively large RD for all blood gas parameters tested in both groups. In practice, a difference of 0.20–0.32 mmol/L K+ is enough for clinicians to make different treatment decisions. However, the ICC of K+ was quite large, indicating its high accuracy. Therefore, when the ABG report returns, add 0.20–0.32 mmol/L to the K+ measured value to match the actual venous K+ value and make an immediate decision accordingly.
Hemoglobin and HCT blood tests are also important, especially for patients with active hemorrhage or hematological diseases and after chemotherapy, where blood transfusion decisions should be made within a short period of time. In this study, arterial Hb and HCT values in the PHS + VBCT group were significantly lower than those measured in venous blood specimens by 2.21 g/L and 1.27%, respectively. However, in the DABS + VBCT group, arterial HCT was significantly higher than venous HCT by 0.66%, and arterial Hb was higher than venous Hb by 0.90 g/L, but not significantly. Nevertheless, these differences may not affect clinician decision‐making for their large baseline values. Furthermore, among the parameters tested in the PHS + VBCT and DABS + VBCT groups, Hb and HCT were the two largest parameters in terms of ICC. Therefore, when the ABG Hb and HCT report arrives, a direct decision can be made accordingly.
Na+ test is part of an electrolyte panel. Extremely high or low Na+ should also be monitored closely, especially in unconscious patients. In our study, arterial Na+ levels were significantly lower than venous Na+ levels in the PHS + VBCT group and DABS + VBCT group by 2.90 and 1.19 mmol/L, respectively. Since Na+ had the smallest RD among all tested parameters, and its ICC was still large, clinicians can directly perform some clinical interventions based on the ABG Na+ results and patient conditions.
In routine ABG analysis, the electrolyte Cl− is relatively less important than K+ and Na+. Our results showed that arterial Cl− levels were significantly higher than venous Cl− levels in the PHS + VBCT group and DABS + VBCT group by 7.60 and 5.34 mmol/L, respectively. Moreover, the RD of Cl− was quite large and the ICC of this electrolyte was small. Therefore, clinicians may remain vigilant and wait for the return of VBCT test results.
Across the study results, the mean differences between arterial and venous for all five parameters were significantly smaller in the DABS + VBCT group than in the PHS + VBCT group. Compared with the PHS + VBCT group, the standard deviation and 95% LoA of K+ and Na+ in the DABS + VBCT group were also smaller, and the extreme values in the DABS + VBCT groups are also less, indicating that DABS is more accurate and stable in ABG sampling.
We observed differences in the measurements between ABG and VBCT blood samples. There may be some reasons for this. First, during ABG collection, arterial blood samples were diluted to varying degrees with heparin sodium saline. This may explain why ABG test values were generally lower than VBCT counterparts from the same PHS + VBCT group. At the same time, the volume of heparin saline that adhered to the syringe barrel each time was indeterminate, resulting in fluctuations in the measured values, which is consistent with our findings. DABS is made with spray technology, with Ca2+ balanced heparin lithium attached to prevent blood coagulation and provide high quality of tested blood. Therefore, using DABS to collect blood samples for ABG analysis can avoid such heparinized syringe errors and obtain more accurate and stable test results. Second, there may be quantitative and compositional differences in biochemical parameters of arterial and venous blood samples, 18 such as blood K+. After the capillary microcirculation, metabolites such as lactic acid enter the vein, making the pH of the venous blood more acidic, affecting the H+‐K+ exchange, and resulting in higher K+ in the venous blood than that in the arterial blood. Further evaluation is needed to compare arterial and venous blood samples in parallel on the same analyzer. Third, there may be systematic errors in the arterial and venous blood analyzers, which might be the reason why our findings are different from other reports, 6 , 7 where Na+ and K+ did not differ significantly between venous and arterial blood samples, although Hb did show significant difference. Fourth, hemolysis may occur during blood processing, 19 especially venous blood. When centrifuging serum, venous blood is more prone to hemolysis, resulting in higher K+. Fifth, K+ is released from platelets during coagulation. 20 Lastly, heparin sodium itself can bind positive ions. Heparin molecule contains sulfate groups and carboxyl groups, which are strongly acidic polyanions capable of reacting with cationic salts, such as Ca2+, Na+, and K+, 21 thus reducing the corresponding cationic concentration.
Some studies have pointed out that VBG can be used to replace ABG, 22 but not to assess oxygen and carbon dioxide parameters. Although those studies provide relevant formulas to estimate arterial values from venous values, 23 , 24 the calculations are relatively complicated, and the results are not intuitive. Therefore, the accuracy and stability between ABG and VBCT parameters remains a real clinical issue. Our results provide some evidence, but further confirmation from prospective multi‐center studies is needed.
The findings of this study have certain limitations. In this study, ABG samples were tested on a blood gas analyzer immediately, while venous blood samples (VBCT) were tested on a blood routine analyzer and an automatic biochemical analyzer after serum preparation. Therefore, technical bias existed between different testing instruments. However, this is a real‐world retrospective analysis in which ABG and VBCT values are common emergency parameters and are usually obtained under different conditions. It can be said that our findings are a reflection of the actual blood gas analysis. Due to clinical relevance, our findings may provide practical guidance for clinicians when obtaining ABG test results.
In conclusion, except for Cl−, ABG values matched well with VBCT values regardless of whether PHS or DABS was used as the ABG acquisition method. The observed differences between ABG and VBCT blood samples were acceptable, especially those drawn with a DABS in arterial blood sampling. We demonstrate that ABG analysis of K+, Na+, Hb, and HCT using PHS or DABS for blood sampling is accurate and stable and provides clinicians with quick and reliable results. Our findings support that DABS should be widely used in practice.
AUTHOR CONTRIBUTIONS
Xiexiong Zhao designed the study, acquired data, and performed statistical analyses. Tao Liu, Miao Huang and Ruixuan Li acquired and checked data. Jianwei Zeng and Yihui Li interpreted the data. Ru Fu prepared the first draft of manuscript. Xiaogang Li and Weihong Jiang designed the study and provided financial support. All authors critically reviewed and approved the final version of this manuscript and had final responsibility for the decision to submit for publication.
FUNDING INFORMATION
The study was supported by the Key Research and Development program of Hunan Province (NO.2022SK2029), the National Natural Science Foundation of China Projects (NO.81800271).
CONFLICT OF INTEREST
All the authors declare that they have no conflicts of interest.
Supporting information
Tables S1–S2
ACKNOWLEDGEMENT
We acknowledge manuscript‐preparation input from Joel Swai (ORCID: 0000‐0001‐5363‐3977) and language editing by CytoScript Editing, LLC.
Zhao X, Liu T, Huang M, et al. Accuracy and stability evaluation of different blood sampling methods in blood gas analysis in emergency patients: A retrospective study. J Clin Lab Anal. 2022;36:e24736. doi: 10.1002/jcla.24736
Contributor Information
Xiaogang Li, Email: hnxylxg@csu.edu.cn.
Weihong Jiang, Email: jiangweihongdoc@163.com.
DATA AVAILABILITY STATEMENT
The datasets used and analyzed during the current study are available from the corresponding author on reasonable request.
REFERENCES
- 1. Castro D, Patil SM, Keenaghan M. Arterial Blood Gas. StatPearls; 2022. [PubMed] [Google Scholar]
- 2. Pande RK. Arterial blood gas: bowling wide and poor wicketkeeping. Indian J Crit Care Med. 2021;25(2):119‐120. [DOI] [PMC free article] [PubMed] [Google Scholar]
- 3. Chandran J, D'Silva C, Sriram S, Krishna B. Clinical utility of arterial blood gas test in an intensive care unit: an observational study. Indian J Crit Care Med. 2021;25(2):172‐175. [DOI] [PMC free article] [PubMed] [Google Scholar]
- 4. Zwisler ST, Zincuk Y, Bering CB, Zincuk A, Nybo M, Mikkelsen S. Diagnostic value of prehospital arterial blood gas measurements–A randomised controlled trial. Scand J Trauma Resusc Emerg Med. 2019;27(1):32. [DOI] [PMC free article] [PubMed] [Google Scholar]
- 5. Ustundag Y, Huysal K, Ozgunay SE, Turkoglu AR. Interchangeability of sodium and potassium result values of arterial blood gas with laboratory analyzer: narrative review. Indian J Crit Care Med. 2019;23(1):35‐42. [DOI] [PMC free article] [PubMed] [Google Scholar]
- 6. Quinn LM, Hamnett N, Wilkin R, Sheikh A. Arterial blood gas analysers: accuracy in determining haemoglobin, glucose and electrolyte concentrations in critically ill adult patients. Br J Biomed Sci. 2013;70(3):97‐100. [DOI] [PubMed] [Google Scholar]
- 7. Johnston H, Murphy R. Agreement between an arterial blood gas analyser and a venous blood analyser in the measurement of potassium in patients in cardiac arrest. Emerg Med J. 2005;22(4):269‐271. [DOI] [PMC free article] [PubMed] [Google Scholar]
- 8. Zhang JB, Lin J, Zhao XD. Analysis of bias in measurements of potassium, sodium and hemoglobin by an emergency department‐based blood gas analyzer relative to hospital laboratory autoanalyzer results. PLoS One. 2015;10(4):e0122383. [DOI] [PMC free article] [PubMed] [Google Scholar]
- 9. Pilcher J, Ploen L, McKinstry S, et al. A multicentre prospective observational study comparing arterial blood gas values to those obtained by pulse oximeters used in adult patients attending Australian and New Zealand hospitals. BMC Pulm Med. 2020;20(1):7. [DOI] [PMC free article] [PubMed] [Google Scholar]
- 10. Rauniyar N, Pujari S, Shrestha P. Study of oxygen saturation by pulse oximetry and arterial blood gas in ICU patients: a descriptive cross‐sectional study. JNMA J Nepal Med Assoc. 2020;58(230):789‐793. [DOI] [PMC free article] [PubMed] [Google Scholar]
- 11. Rudkin SE, Anderson CL, Grogan TR, Elashoff DA, Treger RM. Assessing acid‐base status in circulatory failure: relationship between arterial and peripheral venous blood gas measurements in hypovolemic shock. J Intensive Care Med. 2020;35(5):511‐518. [DOI] [PubMed] [Google Scholar]
- 12. Schutz N, Roth D, Schwameis M, Roggla M, Domanovits H. Can venous blood gas be used as an alternative to arterial blood gas in intubated patients at admission to the emergency department? A retrospective study. Open Access Emerg Med. 2019;11:305‐312. [DOI] [PMC free article] [PubMed] [Google Scholar]
- 13. Cuschieri S. The STROBE guidelines. Saudi J Anaesth. 2019;13(Suppl 1):S31‐S34. [DOI] [PMC free article] [PubMed] [Google Scholar]
- 14. Hao Y, Liu J, Smith SC, et al. Rationale and design of the improving Care for Cardiovascular Disease in China (CCC) project: a national registry to improve management of atrial fibrillation. BMJ Open. 2018;8(7):e020968. [DOI] [PMC free article] [PubMed] [Google Scholar]
- 15. Zhang W. SPSS Basic Course of Statistical Analysis. 3rd ed. Higher Education Press; 2017. [Google Scholar]
- 16. Budak YU, Huysal K, Polat M. Use of a blood gas analyzer and a laboratory autoanalyzer in routine practice to measure electrolytes in intensive care unit patients. BMC Anesthesiol. 2012;12:17. [DOI] [PMC free article] [PubMed] [Google Scholar]
- 17. Panchal AR, Berg KM, Hirsch KG, et al. 2019 American Heart Association Focused Update on Advanced Cardiovascular Life Support: use of advanced airways, vasopressors, and extracorporeal cardiopulmonary resuscitation during cardiac arrest: an update to the American Heart Association Guidelines for cardiopulmonary resuscitation and emergency cardiovascular care. Circulation. 2019;140(24):e881‐e894. [DOI] [PubMed] [Google Scholar]
- 18. Awasthi S, Rani R, Malviya D. Peripheral venous blood gas analysis: an alternative to arterial blood gas analysis for initial assessment and resuscitation in emergency and intensive care unit patients. Anesth Essays Res. 2013;7(3):355‐358. [DOI] [PMC free article] [PubMed] [Google Scholar]
- 19. Mrazek C, Simundic AM, Wiedemann H, et al. The relationship between vacuum and hemolysis during catheter blood collection: a retrospective analysis of six large cohorts. Clin Chem Lab Med. 2017;55(8):1129‐1134. [DOI] [PubMed] [Google Scholar]
- 20. Hartmann RC, Auditore JV, Jackson DP. Studies on thrombocytosis. I. Hyperkalemia due to release of potassium from platelets during coagulation. J Clin Investig. 1958;37(5):699‐707. [DOI] [PMC free article] [PubMed] [Google Scholar]
- 21. Chemical Book . Heparin sodium. https://www.chemicalbook.com/ChemicalProductProperty_EN_CB0439583.htm
- 22. Shirani F, Salehi R, Naini AE, Azizkhani R, Gholamrezaei A. The effects of hypotension on differences between the results of simultaneous venous and arterial blood gas analysis. J Res Med Sci. 2011;16(2):188‐194. [PMC free article] [PubMed] [Google Scholar]
- 23. Kim BR, Park SJ, Shin HS, Jung YS, Rim H. Correlation between peripheral venous and arterial blood gas measurements in patients admitted to the intensive care unit: a single‐center study. Kidney Res Clin Pract. 2013;32(1):32‐38. [DOI] [PMC free article] [PubMed] [Google Scholar]
- 24. Treger R, Pirouz S, Kamangar N, Corry D. Agreement between central venous and arterial blood gas measurements in the intensive care unit. Clin J Am Soc Nephrol. 2010;5(3):390‐394. [DOI] [PMC free article] [PubMed] [Google Scholar]
Associated Data
This section collects any data citations, data availability statements, or supplementary materials included in this article.
Supplementary Materials
Tables S1–S2
Data Availability Statement
The datasets used and analyzed during the current study are available from the corresponding author on reasonable request.