

Abstract
Background
Plasma renin activity (PRA) is one of the recommended screening indicators for primary aldosteronism (PA) diagnosis and had become increasingly important in hypertension identification, medication guidance, and endocrine disorder confirmation.
Methods
To provide an overview of the PRA measurement progress and clinical value, this review summarizes the main contributing factors related to PRA measurement and necessary precautions during the entire analysis process. We also outline the characteristics of PRA in different endocrine diseases and their clinical utility.
Results
Significant inconsistency was observed in PRA measurement methods, including immunoassay and isotope dilution liquid chromatography–tandem mass spectrometry (ID‐LC/MS/MS), which could be attributed to preanalytical, analytical, and postanalytical variations. Meanwhile, consensus about environmental and procedural factors during the entire analytical process, including storage temperature, incubation condition, blank subtraction, and standardized operational procedures across different self‐developed assay laboratories, could be important to minimize analytical variations. Furthermore, commutable uniform calibrators should be prepared to improve consistency, ultimately achieving accurate and reliable measurement of PRA.
Conclusion
This review summarizes the clinical utilization of PRA as a biomarker in multiple diseases, elaborating on routine detection methods and the key factors in the analytical process. We also provide feasible strategies for improving standardization and facilitating PRA assessment for larger‐scale clinical applications.
Keywords: isotope dilution liquid chromatography–tandem mass spectrometry, mineralocorticoid receptor, plasma renin activity, primary aldosteronism, standardization
Plasma renin activity (PRA) is one of the recommended screening indicators for primary aldosteronism (PA) diagnosis. This review summarizes the clinical utilization of PRA as a biomarker in multiple diseases, elaborating on routine detection methods and the key factors in the analytical process. We also provide feasible strategies for improving standardization and facilitating PRA assessment for larger‐scale clinical application.

1. INTRODUCTION
Hypertension is a highly prevalent cardiovascular disease, which is associated with various morbidities and even mortality. 1 , 2 , 3 , 4 Although medications and treatment strategies are widely available, over 50% of hypertensive patients are unable to control and normal blood pressure could be hard to maintain. 5 Consequently, hypertensive adverse complications might greatly influence the quality of life and survival benefits. Nearly 90% of hypertensive patients are primary hypertension, whereas secondary hypertension makes up an increasing position and is highly correlated with cardiovascular‐related events, including renal parenchymal lesions, renovascular disease, Cushing's syndrome, pheochromocytoma, and primary aldosteronism (PA).
PA is a common cause of secondary hypertension, which is characterized by significantly elevated blood pressure, autonomy, or diuretic‐induced hypokalemia due to excessive mineralocorticoid receptor (MR) activation and intravascular volume expansion, with a prevalence of 5%–12% of all hypertensive patients and 17%–23% in resistant hypertension. 6 , 7 , 8 Several confirmatory and subtype tests for PA have been proposed by the American Endocrine Society, 9 while interventional operations, discrepancies in decision criteria, susceptibility to subjective judgments, and risk–benefit ratios limit their clinical application. Therefore, plasma renin activity (PRA) has been recommended to be a more convenient and reliable biomarker for disease screening and is used to evaluate the necessity of further interventional confirmatory testing.
Moreover, previous studies indicated that PRA is associated with the efficacy evaluation of medications, as well as diseases other than PA, such as type 2 diabetes mellitus, Cushing's syndrome, and atrial fibrillation. 10 , 11 , 12 , 13 Despite its clinical value, the analytical process of PRA can be influenced by various factors, which leads to discrepant results that are difficult to assess or interpret.
In this review, we briefly clarified the relevance of PRA to PA and other common endocrine‐related diseases, and we also assessed the utility of PRA as a clinical biomarker in the diagnosis and prognosis of these diseases. Meanwhile, common PRA measurement methods and factors affecting analytical accuracy were summarized, and we highlighted possible solutions for improving the standardization and consistency status of PRA measurement. This review aims to help clinicians and laboratory staff understand PRA assays comprehensively and enhance the clinical utility of PRA.
2. OVERVIEW OF PRA
PRA and direct renin concentration (DRC) play essential roles in the evaluation of circulating renin levels. DRC represents the renin concentration in plasma, while PRA reflects the renin enzyme‐like activity that is required to cleave the endogenous substrate angiotensinogen (AGT) and generate angiotensin 1 (Ang1); this allows us to calculate the amount of Ang1 produced in a unit of time as PRA (unit, ng/ml/h). PRA and DRC assays provide different but complementary information about renin, so clinicians should fully understand the meaning of both assays to make correct interpretations and clinical decisions. On the other hand, some evidence indicates that there is a highly significant correlation between PRA and DRC results. 14 , 15
Renin is the upstream component of the renin‐angiotensin‐aldosterone system (RAAS), which contains 340 amino acid residues (37 kDa) and is released from renal juxtaglomerular cells. 16 Renin acts as an aspartate proteolytic enzyme to specifically hydrolyze AGT, which is synthesized by the liver. 17 , 18 The product, decapeptide Ang1, has very minimal biological activity and is easily degraded by nonspecific proteases into angiotensin peptide products (Figure 1). Under the action of angiotensin‐converting enzyme (ACE), Ang1 is cleaved into active angiotensin 2 (Ang2). 19 , 20 Ang2 can directly affect blood pressure by stimulating the adrenal cortex to secrete aldosterone, 21 thus promoting the retention of water and sodium. Ang2 can also bind G protein‐associated receptors in vascular smooth muscle cells (type 1 receptors; predominantly AT1R), 22 leading to vasoconstriction and eventually increasing the circulating blood volume and evaluating blood pressure. Circulating Ang2 levels can be as low as 90–110 pg/ml in healthy individuals 23 , 24 and can be readily cleaved into many other small peptides in plasma. 25 Accurate measurement of Ang2 is challenging for present measurement assays. Interestingly, studies have reported that there is a linear correlation between PRA and Ang2, 26 , 27 and it is reasonable to measure Ang1 and PRA to reflect the condition of Ang2 and RAAS in a more practical manner 24 ; thus, accurate measurement of PRA plays a significant role in clinical diagnosis.
FIGURE 1.
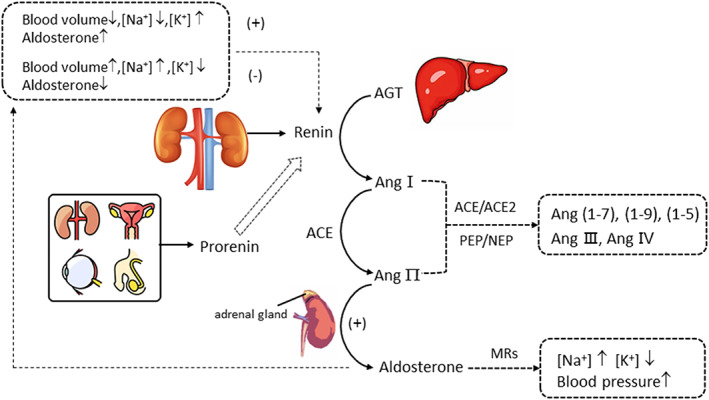
Overview of the main components and interactions of the RAAS system.
Prorenin is the precursor of renin. The normal concentration of prorenin is 10 times higher than that of renin. 18 , 20 Inactive prorenin has an extra 43 amino acid pro‐segment at the N‐terminal when compared to renin 28 ; this creates a closed conformation and cannot bind to AGT. Under physiological conditions, prorenin can only be hydrolyzed to active renin in the kidney. However, in vitro environments such as cooling (−5°C to 4°C) or low pH (<4) can stimulate spontaneous unfolding of the pro‐segment followed by cleavage by nonspecific plasma proteases, resulting in an open conformation and renin activation, 29 known as cryoactivation, which may affect accurate measurements of PRA.
Aldosterone is a downstream effector of Ang2 in the RAAS, which belongs to the mineralocorticoid steroid hormone secreted by the adrenal cortex. It rapidly binds to MRs on target tissues with a high affinity and mediates sodium reabsorption, potassium excretion, and blood pressure elevation. MRs are found in many tissues, such as the kidney, brain, heart, vasculature, and adipose tissue, 30 and binds mineralocorticoids and glucocorticoids with equal affinity. 31 Despite being within the reference range, elevated aldosterone levels are associated with hypertension, renal, and metabolic disease. 32 Aldosterone and PRA are usually simultaneously determined and are equally important for clinicians. Accurate measurement procedures (Joint Committee for Traceability of Laboratory Measurements, JCTLM, available at: https://www.bipm.org/jctlm/) and certified reference material (available at: https://www.cerilliant.com/) have been established and validated for aldosterone, 33 , 34 , 35 which laid the foundation for building reference system and achieving metrologically traceable to the Système International units (SI units). As the standardization status of aldosterone gradually improved, we should also pay more attention to enhancing the reliability and clinical utility of PRA determination.
3. CLINICAL UTILITY OF PRA AS A SPECIFIC BIOMARKER
PRA is a classical hypertensive biomarker and has undergone careful clinical validation. In this section, we present potential associations between PRA and multiple diseases and provide important insights into its clinical application.
3.1. PA screening and diagnosis
PA is a common form of secondary hypertension, and previous studies reported that the risk of PA increased with more severe hypertension. 36 PA patients suffer more cardiovascular incidences than essential hypertension patients with the same level of blood pressure. 10 , 37 Therefore, early diagnosis and etiological treatment are vitally important. As recommended by clinical practice guidelines, 9 the most sensitive assay for initial screening of PA is the plasma aldosterone to renin ratio (ARR). This ratio is calculated by plasma aldosterone and PRA, with the recommended cut‐off value of 30 (ng/dl)/(ng/ml/h). Typical PA patients show increased aldosterone and suppressed PRA. ARR determination exhibits high patient acceptability and low cost that prompt considerable clinical practice and application, which has significantly raised the detection rate of PA in hypertension patients. 6 Once confirmed, adrenal computed tomography and adrenal venous sampling (AVS) are used as subtype testing to distinguish between unilateral adrenal hyperplasia (UAH) and bilateral adrenal hyperplasia (BAH).
To normalize aldosterone secretion, unilateral laparoscopic adrenalectomy and MR antagonists are recommended to cure unilateral PA (i.e., aldosterone‐producing adenoma or UAH) and bilateral adrenal disease (i.e., BAH), respectively. Surgical treatment 10 might bring favorable clinical outcomes to PA patients; however, the suitable general condition and transient postoperative adrenal insufficiency 38 could hamper the utility of surgical treatment; thus, medicinal therapy has shown to be a conservative and reliable alternative. MR antagonists such as spironolactone or eplerenone have been recommended as the first‐line medicine in PA and resistant hypertension 39 because of their notable survival benefit. PA patients treated with MR antagonists whose PRA remained suppressed had a nearly three times (95% CI: 2.11–3.80) higher risk for incident composite cardiovascular events and renal vascular risk, 40 while unsuppressed PRA patients showed no significant difference 10 compared with essential hypertensive patients. Recent study 10 suggested that a more aggressive and efficient prescription of MR antagonists might be helpful in blood pressure control and cardiovascular protection. Therefore, PRA has proven to be an indispensable predictive and prognostic biomarker in early diagnosis and medicine guidance for PA.
3.2. Evaluation of therapy of MR antagonists
MR antagonists can bind to MRs and block the interaction with aldosterone, and they have been one of the most widely used antihypertensive agents to mitigate the incidence of cardiovascular damage and target‐organ deterioration. 41 Patients treated with MR antagonists and whose PRA rose to unsuppressed tend to have a lower risk of cardiovascular events such as atrial fibrillation, diabetes, and stroke. 10 Hundemer et al. 12 conducted a large retrospective cohort study and found that MR antagonists‐treated PA patients who maintained a suppressed PRA level showed a 2.5‐fold higher risk for atrial fibrillation incidence than essential hypertensive patients. PRA could act as a coordinated biomarker to evaluate the sufficient suppression of MRs.
Moreover, studies 42 indicated that spironolactone used as an add‐on agent exerted beneficial effects on type 2 diabetes mellitus patients, specifically for insulin resistance. MRs and aldosterone also exert mediated functions on depression and anxiety in medically treated PA patients. 43 , 44 , 45 With the prevalence of MR antagonists, PRA might be a useful biomarker for the efficacy monitoring of MR antagonists.
Notably, scholars 10 mentioned that the definition of PRA suppression was binarily categorized with 1 ng/ml/h as the cut‐off value, rather than a continuous numerical, which is because the sensitivity of the assay limits the detection for low PRA samples (<0.60 ng/ml/h). Thus, a sensitive and accurate quantitative measurement procedure for PRA is urgently needed in clinical decision‐making.
3.3. Association with other endocrine‐related diseases
Cushing's syndrome, caused by excess adrenocorticotropic hormone (ACTH) or cortisol secretion, also accounts for endocrine hypertension. 11 , 46 Cushing's syndrome patients are usually treated with surgical intervention or targeted medical therapy. Medicine treatment mainly uses glucocorticoid receptor (GR) antagonists, such as mifepristone, to act as competitive inhibitors of cortisol. Under pathological conditions, normal levels of glucocorticoids can activate MRs and exert detrimental impacts on cardiometabolic and kidney damage. Interestingly, researchers 38 observed increased mineralocorticoid release in Cushing's syndrome patients, which implied that moderate MR antagonists as an add‐on agent could be an aggressive strategy.
Obesity is also significantly related to excessive aldosterone secretion. Researchers 47 , 48 , 49 found that adipocytes could secrete aldosterone‐releasing factors and increase aldosterone, implying that obese patients with elevated aldosterone should consider the therapy of MR antagonists. Moreover, PRA levels are increased in primary adrenal hypofunction (Addison's disease), secondary hyperaldosteronism such as Bartter syndrome, 50 renin‐secreting tumors, acute renal failure, and acute myocardial infarction 51 but are reduced in the 11β‐hydroxylase deficiency type of congenital adrenal hyperplasia, 52 , 53 Liddle syndrome (pseudoaldosteronism), 54 and 21‐hydroxylase deficiency. 55
In summary, many studies have shown that PRA is an essential biomarker for multiple endocrine and metabolic disease screening, hypertension classification, prescription guidance, 56 and efficacy assessment. 57 However, PRA assays can be susceptible to preanalytical factors, and the results of different assays are difficult to compare; therefore, an accurate and comparable measurement procedure for PRA is urgently needed.
4. ADVANTAGES AND LIMITATIONS OF VARIOUS PRA DETECTION TECHNIQUES
4.1. Immunoassay
Currently, in China, the mainstream immunoassays for PRA are radioimmunoassay (RIA) and chemiluminescence immunoassay (CLIA) according to information obtained from the national External Quality Assessment (EQA) programs organized by the National Center for Clinical Laboratory (NCCL, China) (data not shown).
RIA assays use a competitive principle to capture Ang1 in vitro to reflect the enzymatic activity of renin. Plasma was adjusted to pH 6.0 by adding a generation buffer containing angiotensinase inhibitors and was then incubated at 37°C and 4°C (blanks) for at least 90 min. After incubation, the plasma was added to a 96‐well plate coated with insufficient anti‐Ang1 antibody; this endogenously produced Ang1 competes with fixed‐dose 125I‐labelled Ang1 overnight (16–24 h), followed by a wash step, and the immobilized labeled antigen–antibody complex was sent to a gamma counter to detect the radioactivity signal. The PRA result was calculated by equation 1: PRA=, as the concentration unit expressed as ng/ml/h. The RIA method is time‐consuming and is associated with the potential for radioactive contamination. Due to the limited dynamic range of RIA assays, it may be necessary to dilute samples or prolong the incubation period to generate measurable Ang1 for low PRA samples, while questions have been raised about the reliability of prolonged incubation where the degradation of Ang1 may occur. 58
The CLIA assay is based on a chemiluminescent immunoassay. The assay adopts a sandwich structure where a 96‐well plate was coated with Ang1‐specific polyclonal antibodies. Ang1 in the samples competes with the added Ang1‐HRP (horseradish peroxidase) reagent to bind the polyclonal antibodies, and nonspecific binding was prevented by washing. Luminescent substrate luminol was added and catalyzed by HRP, and the mixture was transferred to an immunoassay analyzer to detect the relative light unit value. This assay reduces the plasma incubation time to one hour and lowers the risk of cryoactivation; it is more automatic and has less radioactive hazard. Due to the advantages of economic and labor costs, CLIA diagnostic kits occupied an important position in PRA testing in the Chinese market.
The wide‐recognized drawback of immunoassays was cross‐reactivity. Ang1 is a decapeptide molecule, and there are many other angiotensin‐like peptides in plasma, such as angiotensinogen, Ang2, angiotensin (1–7), etc. In the preparation of polyclonal antibodies, the interested standard material is used as the antigen to immunize animals to obtain antiserum, which is then purified by affinity chromatography to get specific antibodies. During this process, nonspecific antigen–antibody reactions may occur, such as some factors 59 that inhibit antigen–antibody binding in the plasma, or other vascular peptides provided with similar target epitope compete for binding, thus affecting the accurate quantification of the Ang1 result. Although cross‐reactivity has been assessed during the development of the immunoassay kit, however, due to the inherited reaction mechanism of immunoassays, it is difficult to completely avoid cross‐reaction, especially for the low‐activity samples, the immunoassays have been challenged and more sensitive measurement methods were needed.
4.2. The ID‐LC/MS/MS method
Despite the convenience and popularity of routine immunoassays, they suffer from several major drawbacks, including antibody storage stability, cross‐reactivity, and low sensitivity (0.2 ng/ml/h) 60 , 61 ; therefore, the highly sensitive and specific ID‐LC/MS/MS method using stable isotope‐labeled internal standards for PRA measurement has been developed and recognized as an appropriate alternative. There are similarities in sample preparation procedures between present ID‐LC/MS/MS methods, generally including plasma incubation, sample extraction, and injection for LC–MS/MS analysis, and the main discrepancies existing in each step involve the components and concentration of protease inhibitors, sample extraction modes, parameter optimization, and equalization between different types of apparatuses.
In previous studies, Fredline et al. 17 added phenylmethylsulfonyl fluoride (PMSF) and neomycin as protease inhibitors in plasma incubation and used a C18 solid‐phase extraction (SPE) column for sample extraction. The absolute recovery of Ang1 was 67.9%, and the limit of detection (LOD) was 0.14 ng/mL/h with a total coefficient of variation (CV) of 7%–15%. In 2012, Carter et al. 62 used four protease inhibitors for plasma incubation: neomycin, ethylene diamine tetra‐acetic acid (EDTA), PMSF, and soybean trypsin inhibitor (SBTI); these were combined with high‐performance liquid chromatography‐online SPE, with relative recoveries of 87%–106%. The lower limit of quantification (LLOQ) was 0.39 ng/ml/h (following a 6.5 h incubation) with intra‐ and inter‐assay CVs of 1.6%–7% and 6.6%–13.9%, respectively. In 2014, Owen et al. 63 proposed a new off‐line SPE alternative improved on the basis of Carter S et al. and validated that the measurement procedure was not restricted by a designed high‐performance liquid chromatography‐online SPE system and showed equal or better performances (total CV of 6.0%–7.5%); the LLOQ was as low as 0.065 ng/ml/h. In another study, Van Der Gugten et al. 50 used a reverse 96‐well plate for sample purification and extraction, achieving a total CV of 5.0%–5.8% and a LOQ of 0.02 ng/ml/h (signal‐to‐noise ratio 50:1). Chappell DL and Camenzind et al. 16 , 60 used anti‐Ang1 antibodies in the incubation to capture Ang1 and prevent further degradation or processing by ACE or other angiotensinases, with an absolute recovery of 60%, spiking recoveries of 93%–105%, the LOQ was 0.005 ng/ml/h, and the intra and inter‐assay imprecision ranged from 1.6%–8.3% and 7.2%–9.4%, respectively. The chromatographic separation of Ang1, Ang2, Ang III, and Ang IV indicated that related metabolites will not interfere with the detection and quantitation of Ang1 in this assay. These findings showed that the ID‐LC/MS/MS method greatly improves the sensitivity and specificity of PRA measurement. Details of the sample preparation, LC–MS/MS conditions, and performance characteristics of these methods are summarized in Table 1.
TABLE 1.
Summary of PRA measurement by ID‐LC/MS/MS methods
| Sample preparation | Mass spectrometry equipment b | Chromatography conditions | Coefficient of variation (%) | Limit of Detection (ng/ml/h) | Recovery (%) | Method comparison (Compared with RIA) | Year (reference) | ||
|---|---|---|---|---|---|---|---|---|---|
| Additives for Ang1 generation a | Terminate incubation | Ang1 extraction | |||||||
| Maleic acid, neomycin, PMSF, SBTI, Acetate, 3 h/18 h | Frozen (−20°C) | SPE (C18) | PE‐SCIEX API III | Waters Nova‐Pak C18(2 × 150 mm, 4 μm), 5 min |
Within‐day:4.2–9.4 Total:7–15 |
0.14 | c 92(68–113) | R2 = 0.92, minus bias:1.07 ng/ml/h | 1999 17 |
| Neomycin, EDTA, PMSF, SBTI, Acetate, 6.5 h/24 h | 2% ammonium hydroxide | SPE (MAX) | Waters Xevo™ TQ | Waters Xbridge C18(3.5 μm), 5.5 min |
Intra‐assay:1.6–7.0 Interassay:6.6–13.9 |
0.104 | d 87‐106 | R2 = 0.98, minus bias:1.56 ng/ml/h | 2012 62 |
| AntiAng1 rabbit polyclonal antibody, 3 h | Frozen (−80°C) | PP, Millipore spin filter | AB SCIEX API 5000 | Waters Atlantis dC18 (2.1 × 50 mm, 1.7 μm), 9.5 min |
Intra‐assay:1.6–8.3 Interassay:7.2–9.4 |
LOQ: 0.005 |
e 93‐105 c 60 |
R2 = 0.97 e | 2012 60 |
| EDTA, PMSF, Tris, 3 h | 10% formic acid | Strata‐X 33 μ polymeric reversed‐phase 96‐well plate | AB SCIEX API 5000 | Phenomenex Jupiter 4 μ Proteo 90 Å (50 × 2 mm), 6 min | Interday:7.7–9.0 | – | – | R2 = 0.9296 | 2013 16 |
| EDTA, PMSF, Tris, 3 h | 10% formic acid | Strata‐X 33 μ Polymeric reversed‐phase 96‐well plate | AB SCIEX API‐5000/5500 QTRAP | Phenomenex 4u Proteo 90 Å(50 × 2.0 mm), 6 min | Total:5.0–5.8 | LOQ: 0.02 | – | – | 2016 50 |
| PMSF, SBIT, EDTA, Tris, 3 h | 7:10:200, formic acid/IS/deionized water |
Waters OASIS HLB μElution plate for SPE |
Triple Quad 6500 + LC–MS/MS system (AB Sciex, CA, USA) | Phenomenex Kinetex C18 (100 × 2.1 mm, 2.6 μm), 5 min |
Intra‐assay:4.8–8.6 Interassay:4.0–9.0 |
LOQ: 0.1 | e 103‐107 | f Spearman n's correlation coefficient: R = 0.996 | 2021 64 |
Abbreviations: ESI, Electrospray ionization; IS, Internal standard; LOQ, Limit of quantification; MAX, Strong anion exchange extraction; PP, Protein precipitation; SPE, Solid‐phase extraction.
Plasma incubation was performed at 37°C and pH = 5.5–6.0.
Samples were ionized via ESI source in the positive mode.
Absolute recovery.
Spiking recovery.
Competitive enzymatic EIA.
Compared with laboratory developed test by themselves.
The previous studies 17 , 62 have shown a good correlation between the ID‐LC/MS/MS and RIA methods, although the RIA methods exhibited a certain mean bias compared with the ID‐LC/MS/MS; this discrepancy could be attributed to the cross‐reactivity of the antibody in the RIA assays. However, few studies have investigated the consistency among different ID‐LC/MS/MS methods for PRA measurement. Chen F et al. 64 compared the simultaneous quantification of aldosterone, PRA, and Ang2 with another ID‐LC/MS/MS assay, which detects the three analytes separately. The 95% CI of biases for PRA ranged from −38.0% to 8.4%. According to 2019 national EQA programs organized in China, statistics showed that the CVs among different ID‐LC/MS/MS assays (n = 8) ranged from 30%–72% for five EQA materials with a PRA concentration range of 1.1–21.1 ng/ml/h. This inconsistency may be due to (1) the lack of reference measurement procedures (RMPs) and certified reference materials that could be traceable to the SI units; (2) the lack of uniform commutable calibrators for in vitro diagnostic reagent manufacturers; and (3) the differences in sample preparation procedures, instrument parameters and reagent variations for the end‐users. Therefore, it is evident that the standardization and harmonization of PRA measurement are urgently needed for accurate measurement and proper diagnosis.
5. FACTORS AFFECTING THE PRA MEASUREMENT PROCESS
Similar to clinical enzymology measurements that are prone to be influenced by alterations in experimental conditions, 65 , 66 such as operation personnel, facilities, or regents, PRA assays could be affected by various conditions. To date, research has not been specifically designed to evaluate or summarize possible influencing factors related to PRA measurement. Table 2 presents an overview of the main contributing factors mentioned in the published literature, followed by potential outcomes and necessary precautions during the entire analysis process. These are divided into preanalytical, analytical, and postanalytical considerations that specialists and laboratory technicians should take into account to achieve accurate and reliable determination.
TABLE 2.
Factors that contribute to PRA measurement
| Year (Reference) | Analytical process | Effect factors | Condition | Findings and explanations |
|---|---|---|---|---|
| 1. 2012 (62) | Pre analysis | Anticoagulant type (whole blood) | EDTA potassium vs lithium heparin | 1. No significant difference in PRA after 24 h incubation at room temperature (n = 14) |
| 1. 2004 (15) | EDTA, heparin, and citrate | 1. No significant difference in DRC was observed in variance anticoagulated plasma (n = 15) | ||
|
1. 2011 (41) 2017 (30) |
Diet | Low salt intake | 1. Decrease aldosterone and increase PRA | |
| 1. 2016 (9) | Collection time of day | ‐ | 1. PRA peaks in the morning and drops in the afternoon | |
| 1. 2012 (89) | Posture | Standing or lying position | 1. The level of renin in the standing position is higher than that in the lying position, and the ARR in the standing position is more sensitive to the diagnosis of PA, thus reducing the false‐negative rate | |
| 1. 2010 (90) | Gender | – | 1. Women are susceptible to the influence of the menstrual cycle. During the luteal phase, the increase of estrogen inhibits the secretion of renin but only shows an increase in DRC | |
|
1. 2009 (21) 1979 (91) 2. 2012 (62) |
Pregnancy | ‐ |
1. Estrogen stimulates the liver to increase the synthesis of AGT; progesterones could compete with aldosterone at the MRs leading to an increase in PRA as a compensatory mechanism 2. Elevated prorenin may remarkably increase PRA through cryoactivation at 4°C |
|
| 1. 2016 (9) | Age | ‐ | 1. PRA decreases with age (>65 years) | |
| 1. 2016 (9) | Pathological state | Kidney impairment | 1. Decreased renin level/increased PRA levels | |
| 1. 2005 (28) | Heart failure and liver disease | 1. Diminished AGT levels lead to lower PRA | ||
|
1. 2004 (15) 2005 (52) 2. 2005 (52) 3. 2009 (81) |
Storage temperature | Room temperature |
1. At room temperature, whole blood samples for PRA analysis are more stable up to 72 h than in plasma after centrifugation 2. Renin remains stable in plasma and whole blood for up to 24 h at room temperature; thus, centrifugation should be performed under room temperature; rapid freezing and thawing will not cause cryoactivation of prorenin 3. PRA and DRC significantly decreased when whole blood was kept at room temperature for 2 h compared with samples kept at 0–5°C for 2 h before processing |
|
|
1. 2012 (62) 2015 (92) |
4°C | 1. Most samples for PRA assays showed little effect after short‐term 4°C storage (within 30 mins). Low PRA samples with higher concentrations of circulating prorenin or higher prorenin‐to‐renin ratio (such as pregnancy) are more easily affected and strikingly increased in PRA by cryoactivation for 6 h | ||
| 1. 2009 (81) | −20°C | 1. PRA decreased 15.2% after 5 weeks (p < 0.02) and 31.9% after 7 weeks (p < 0.01) when stored at −20°C | ||
|
1. 2016 (9) 2. 2011 (73) |
Medication | Hormone replacement therapy |
1. Estrogen medications (ethinylestradiol and drospirenone) lower DRC but increase PRA for 3 weeks 2. Subdermal etonogestrel treatment (lack of estrogen) has an inference with both DRC and PRA for 6 weeks |
|
| 1. 2016 (9) | MR antagonists (spironolactone, eplerenone) | 1. Lowers PRA levels; stop using for at least 4 weeks before PRA assays | ||
| 1. 2016 (9) | β‐adrenergic receptor blockers | 1. Inhibits the secretion of renin and lowers PRA and aldosterone levels; stop using for at least 2 weeks. | ||
| 1. 2009 (93) | Nonsteroidal anti‐inflammatory drugs (aspirin) | 1. A 24‐hour reduction of PRA; stop using for at least 2 weeks | ||
| 1. 2016 (9) | Renin inhibitors (aliskiren) | 1. Lowers PRA levels; stop using for at least 2 weeks | ||
| 1. 2016 (9) | Angiotensin2 type 1 receptor blockers; ACE inhibitors; Dihydropyridine calcium channel blockers | 1. Increases PRA and lowers aldosterone levels; stop using for at least 2 weeks | ||
| 1. 2017 (30) | Anesthetics (pentobarbital) | 1. Induces renin release | ||
| 1. 2020 (76) | Rifampin | 1. Rifampin elevated PRA and blood pressure in healthy volunteers without other medicines, one possible mechanism could be pregnane X receptor activation through the liver X receptor agonism by elevated 4β‐hydroxycholesterol regulation pathways | ||
| 1. 1999 (17) | Sample dilution | ‐ | 1. Reduces the concentration of enzyme and substrate (Angiotensinogen) and causes the nonlinear production of Ang1, and different amounts of the substrate may cause different impacts on Ang1 generation | |
|
1. 1999 (21) 2. 2012 (62) |
In the analysis | Protease inhibitors | EDTA PMSF neomycin |
1. A mixture of EDTA, PMSF, and neomycin could stabilize Ang1 in plasma for up to 24 h 2. A mixture of EDTA and PMSF (pH = 5.45–5.50) inhibits proteases for 3 h |
| 1. 2012 (62) | Incubation details | Time | 1. For low PRA samples (Ang1 < 2.46 ng/ml) this showed an excellent correlation between the results obtained after 6.5 h‐ and 24 h‐incubation, suggesting that Ang1 production remains linear for 24 h and that protease inhibitors were still functional. For high‐activity samples, long incubation times could underestimate PRA due to substrate exhaustion | |
|
1. 2015 (83) 1991 (20) 2. 1975 (86) |
pH |
1. pH 5.5–6 is suitable for renin activity; this is approximately twofold more enzymatically active than at physiological pH, and the pH is also most stable for protease inhibitor PMSF 2. pH 5.7 is the optimum value for renin activity |
||
|
1. 1997 (94) 2. 2013 (18) |
Temperature |
1. 45°C can achieve the maximum renin catalytic activity and is not affected by changes in pH and protease degradation. A higher incubation temperature and shorter incubation period could reduce the chance of prorenin activation and Ang1 degradation 2. Renin will be degraded above 37°C |
||
|
1. 2016 (50) 2. 2012 (62) 3. 2010 (14) |
Postanalysis | Blank subtraction | Necessary or not |
1. For high PRA samples, a sufficient incubation time can reduce the fraction of blank, making blanks quantitatively irrelevant 2. The majority of samples had unmeasurable blank levels below the LLOQ (2.5 ng/ml) 3. Blank subtraction led to an increase in interlaboratory CV and affected the accuracy of PRA measurement, especially for low renin plasma, thus leading to unsatisfactory reproducibility |
|
1. 2012 (62) 2. 2005 (52) |
Evaluation criterion | Reference range or cut‐off value |
1. A reference range of 0.15–2.27 ng/ml/h (n = 100) was calculated on 100 healthy individuals 2. PRA <0.65 ng/ml/h was regarded as a low PRA status |
Note: The 1, 2, 3 numbering of references of the left‐most column entries correspond to the same numbering in the right‐most column.
Abbreviations: ACE, angiotensin‐converting enzyme; AGT, angiotensinogen; Ang1, angiotensin 1; ARR, aldosterone to renin ratio; CV, coefficient of variation; DRC, direct renin concentration; EDTA, ethylenediaminetetraacetic acid; LLOQ, lower limit of quantification; MRs, mineralocorticoid receptors; PA, primary aldosteronism; PMSF, phenylmethylsulfonyl fluoride; PRA, plasma renin activity; SBTI, soybean trypsin inhibitor.
5.1. Preanalytical considerations
First, the PA guidelines recommended that before sample collection, patients should ensure a normal intake of sodium and potassium, have been out of bed for at least 2 h, and have been seated and rested for at least 5–15 min. 9 Whole blood should be collected in EDTA potassium anticoagulant tubes to avoid stasis and hemolysis. Samples should be delivered and centrifuged at room temperature for no longer than 30mins, and plasma should be removed and rapidly frozen at −80°C until analysis. For whole blood samples that cannot be transported to the laboratory within 2 h, it is mandatory to be kept at 0–5°C to avoid Ang1 production at room temperature over time.
The application of anti‐hypertensive drugs can cause significant and long‐lasting effects on the RAAS and interfere with the measurement of renin and aldosterone. ACE inhibitors, Ang2 receptor blockers, and dihydropyridine calcium channel blockers can lower aldosterone but give a rise in renin by the compensatory mechanism. Diuretics can rarely raise renin in PA patients 67 but cause higher aldosterone in hypertensive patients. 68 β‐adrenergic receptor blockers would inhibit the secretion of renin and lower PRA and aldosterone levels. 9 MR antagonists can raise renin and aldosterone in PA patients. 68 Renin inhibitors (aliskiren) could block the enzymatic activity of renin and hamper the conversion of AGT to Ang1, and they were applied for hypertension control in 2007. 69 A meta‐analysis of 13,627 patients, with a follow‐up time ranging from 4 weeks to 36 months, was implemented by Wang et al., 70 who noted that compared with first‐line antihypertensives (e.g., ACE inhibitors), renin inhibitors did not seem to have greater long‐term risk reduction in blood pressure reduction or adverse events. 70 , 71 When renin inhibitors were used before the PRA assays, they were replaced by protease inhibitors that were added to the incubation buffer and unbound from plasma protein, thereby overestimating the effect of the inhibitors 14 and showing false lower PRA levels. Moreover, when renin inhibitors were bound to prorenin, this could expose the immune recognition site of prorenin, thus leading to a false increase in DRC. 72 Cannone et al. 68 reported that in 477 hypertensive patients selected randomly, elevated aldosterone levels were observed as the increased number of anti‐hypertensive drugs taken.
Several hormone medicines can also affect the interpretation of PRA. Ahmed et al. 73 investigated the different influences of the contraceptives or the route of administration (oral or subdermal) on PRA (n = 32). The results indicated that estrogen‐containing medications (ethinylestradiol and drospirenone) may lower DRC but increase PRA (p < 0.05). The difference can be explained as estrogen stimulating AGT production, 73 and further elevated Ang2 may inhibit renin and lower DRC. However, drospirenone could compete with aldosterone at the MRs 74 ; thus, PRA and aldosterone may increase through a compensatory mechanism. However, subdermal etonogestrel treatment has little inference with both DRC and PRA (p > 0.05) after 6 weeks of implantation and is suitable for patients who need contraceptive medication. 73 This finding may be explained by the fact that etonogestrel exerts no effect on the components of the RAAS, and the absence of estrogen will not impact the DRC. Moreover, subdermal implantation tends to have less of an effect on the liver involving the first‐pass effect 75 than oral administration. New research 76 demonstrated that rifampin, an antibiotic used for tuberculosis treatment that acts as a pregnane X receptor agonist, could stimulate PRA and elevate blood pressure in healthy volunteers without interfering with diseases or medicines. One possible mechanism is the liver X receptor and 4β‐hydroxycholesterol regulation pathways, and attention should be given to blood pressure control.
Additionally, to date, it is still controversial whether antihypertensive medicines should be withdrawn before PRA measurement. Taking PA patients treated with spironolactone as an example, some scholars 77 insisted that this medicine should be withdrawn for at least 4–6 weeks before the PRA assay as guideline‐recommended, and relatively noninterfering substitute medications (such as α‐adrenergic blockers hydralazine or slow‐release verapamil 67 ) might be applied for severe PA patients to reduce blood pressure. More recently, Ching et al. 78 offered opposite opinions, they investigated those patients who could not tolerate the withdrawal of these medications for 4–6 weeks and may reasonably undergo a 2‐week withdrawal, with monitoring of appropriate renin suppression (PRA <0.5 ng/ml/h); the clinical diagnosis remained unchanged. Furthermore, studies 79 , 80 found that despite AVS performed under concurrent therapy of MR antagonists, no significant difference was observed in clinical and biochemical diagnosis compared with those who had already withdrawn MR antagonists before AVS, especially for severe PA patients at high risk of complications. Overall, these results indicate that the exposure to MR antagonists might not always be contradictory to clinical efficacy evaluation, especially for severe PA patients, and PRA assays (e.g., renin suppression) may offer support for the reliability of AVS diagnosis.
The real situation of RAAS for patients taking these agents may be obscured. Therefore, to make sound clinical judgments, clinicians and laboratory technicians need to get sufficient information on the previous medication regime. If necessary, sample collection and testing should be repeated after taking at least 2 weeks of substitute medicines with little interference with the RAAS.
The sample storage temperature exerts a significant influence on the PRA results, but there is still a lack of recognized stability protocols. Locsei et al. 81 found that PRA and DRC significantly decreased when whole blood was kept at room temperature for 2 h compared with samples kept at 0–5°C for 2 h before processing. Other studies 15 , 52 proposed that plasma or whole blood samples are stable up to 24–72 h at room temperature. The PRA sample results remained unaffected after short‐term storage at 4°C (within 30 min). Cryoactivation may occur only when 4°C storage is up to 6–24h. 82 Low PRA samples with higher concentrations of circulating prorenin or a higher prorenin‐to‐renin ratio (such as pregnancy) are more easily affected by cooling stimuli. PRA decreased 15.2% after 5 weeks (p < 0.02) and 31.9% after 7 weeks (p < 0.01) when stored at −20°C. 81 It seems advisable to keep samples below −70°C for long‐term stability.
Substrate AGT levels also significantly affect renin enzymatic activity and PRA. For pregnant women or patients treated with hormone replacement therapy, physiological AGT levels are elevated and further increase PRA. In addition, when plasma is kept at room temperature for a long time, renin may hydrolyze AGT and lead to overconsumption of the substrate in advance. A comprehensive assessment of PRA plasma stability would be of great help in the reproducible and accurate determination. Notably, sample dilution should be avoided, 83 which could alter the reaction rate irregularly due to a decreased concentration of enzyme and substrate.
5.2. Analytical considerations
Ang1 can easily be degraded by nonspecific proteases; there are many complex degradation pathways and similar products that might bring unexpected bias. 84 During the plasma incubation, Ang1 should be protected by serine protease inhibitors (PMSF or SBTI) and angiotensin‐converting enzyme inhibitors (EDTA), or captured by anti‐Ang1 antibodies in immunoassays. The selection and combination of inhibitors were based on previous research. In the early RIA established for PRA measurement, 85 , 86 proteinase inhibitors including EDTA, neomycin, 8‐hydroxyquinoline, and PMSF have been widely recognized and used in routine assays, which could achieve an 18 h‐inhibition during plasma incubation. Until the newly LC–MS/MS assays were continuously developed for PRA determination, they followed the main inhibitor regimen of RIA, in which EDTA, PMSF, SBTI, and neomycin were retained for the protection of Ang1. 17 Recently, the incubation time was cut to 3 h, and neomycin (for inhibition of bacterial peptidase during longer incubation 85 ) was less used in routine laboratories. 64 Therefore, the combination of EDTA, PMSF, and SBTI was chosen as the recommended inhibitors for LC–MS/MS analysis. However, despite the use of these inhibitors, approximately 2% of patient samples exhibit complete degradation of Ang1. 58 Laboratory technicians need to recognize the degradation and reasonably interpret how these rare or extremely low PRA results occurred.
However, the reliability of PA diagnosis when PRA is under the decisive range (<1 ng/ml/h) has been questioned. 9 For low PRA samples (<0.5 or 0.65 ng/ml/h), some laboratories used a prolonged incubation time (e.g., 18 h) to improve the sensitivity of RIA assays. 52 , 62 However, a longer incubation time not only prolongs the run time but also may cause nonlinear production of Ang1 or significant negative bias due to substrate exhaustion or Ang1 degradation 60 , 83 ; similar to high PRA samples (>4 ng/ml/h), the incubation period should be limited to 3 h to avoid substrate exhaustion. 21 , 58 For incubation temperature, 37°C is recommended as the most suitable temperature for renin activity because it is the physiological temperature of humans and could reproduce ‘real‐life’ conditions. Different types and concentrations of generation buffers (i.e., acetate, tris, and proteinase inhibitors) were adopted as protease inhibitors in different laboratories 16 , 17 , 50 , 62 , 64 (Table 1), which have different characteristics and capabilities of protection and exhibit variable renin activity in these assays. Therefore, careful evaluation and superior choice of sample incubation procedure need to be clarified further, hoping to achieve accurate and comparable quantification among different laboratories.
5.3. Postanalytical considerations
Blank Ang1 levels are the variable amounts of Ang1 that exist before incubation. Theoretically, the blank should be subtracted from the equation. However, this proposal has been challenged by some researchers who claim that it is unnecessary to measure blanks. Several reasons may support this viewpoint. First, for high PRA samples, sufficient incubation could reduce the proportion of blanks and make the blanks negligible. Second, some studies demonstrated that the blanks are usually below the LLOQ, and blank measurement causes sample consumption and labor costs because larger sample volumes are required for two analyses. 50 , 52 , 62 , 64 Samples with endogenous Ang1 above the LLOQ accounted for only 5.6%–8.5% of the generated Ang1. 60 , 64 Moreover, Morganti A et al. 14 found that blank subtraction led to poor reproducibility in RIA assays, especially for low renin samples. 14 However, we should avoid concluding whether need to perform blank subtraction only through think about the aspects of practical convenience or smaller proportion to the final results because there lack thorough assessment or persuasive evidence to manifest that abolishing blank subtraction would not interfere with the disease diagnosis or clinical decisions. More pertinent and comprehensive studies on blank subtraction are required to validate the influence of blank proportion. The bias caused from the blank measurement may contribute to poor consistency among assays. Therefore, a recognized protocol about the blank subtraction should be reached to facilitate the standardization of PRA determination, including whether blank subtraction needs to be performed and how blanks are measured properly.
Additionally, according to the survey on the LC–MS/MS assays for PRA carried by NCCL (data not shown), different calibrator sources, material purity characteristics, and the self‐prepared or commercial quality control samples highly contributed to the inconsistency among different laboratories. Conclusively, it should be highlighted that a preliminary consensus about incubation guidelines and commutable calibrators should be achieved through the joint endeavor between the EQA program provider and clinical laboratories. During the improvement of consistency, some detailed information, such as incubation inhibitor types, the kind of buffer, blank subtraction, and calibrator sources, should be offered by laboratories to facilitate the comparison or evaluation of results obtained from different assays.
Until now, there has been insufficient research to provide intra‐ and interindividual biological variation data or unified analytical performance specification for PRA, and a significant discrepancy in evaluation criteria was observed in the reporting and interpretation of results, such as different renin suppression thresholds (0.5 or 1 ng/ml/h) adopted in different studies. Therefore, it is necessary to establish PRA‐specific biological variation, cut‐off values, or reference intervals based on the LC–MS/MS method for healthy and hypertensive groups. 64
To summarize, multiple factors in the entire analysis workflow could affect the consistency and comparability of PRA measurement. We can learn from the experience of enzymatic assays (e.g., ALT or AST), such as fixed reaction conditions and requirements in manual operation, which would reduce the influence of external environmental factors on the results. Therefore, there is an urgent need to ensure the optimal conditions for plasma preparation and then harmonize other factors such as sample collection, storage, and incubation procedure, hoping to reduce variation and achieve reproducible PRA determination results. Furthermore, considerations for quality assurance, such as performance specification and clinical validation, are needed in further research.
6. STANDARDIZATION STATUS AND IMMEDIATE NEEDS FOR PRA ANALYSIS
Currently, the consistency of PRA assays remains unsatisfactory. In 2010, Morganti et al. 14 conducted a multicenter comparative study involving 12 European medical laboratories regarding PRA measurement, and six plasma samples with a PRA range of 0.14 to 18.9 ng/ml/h were analyzed with the same RIA commercial kit, reagent, and unified operation instructions. The inter‐ and intra‐laboratory CVs ranged from 15.5%–59.4% and 1.4%–16.5%, respectively. The interlaboratory variability markedly increased as the PRA level decreased. According to the statistics from the 2021 national EQA program in China (available at: https://www.nccl.org.cn/mainCn), five EQA materials with a PRA concentration range of 1.88 to 13.63 ng/ml/h were provided for participating laboratories. Intra‐assay CVs ranged from 23% to 66% (n = 12) for LC–MS/MS assays and 34% to 111% (n = 47) for CLIA assays. The mean biases between CLIA assays and LC–MS/MS methods ranged from −12.1% to 76.5%. Remarkable inconsistency existed among different assays and laboratories for PRA determination.
As previously mentioned, the unified protocol for incubation can reduce the environment‐induced variations in PRA assays. On the other hand, the issue of harmonization could be addressed by the reference measurement procedures (RMPs) and reference materials, that is, the standardization activities. The most significant steps for standardization are to establish a reference measurement system and achieve metrological traceability to the higher international standards. 87 A reference measurement system consists of RMPs and higher‐order reference materials with well‐characterized traceability. ISO 17511 document defines the metrological traceability and hierarchy of an RMP, as well as detailed guidelines for measurands with different traceability. 88 ID‐LC/MS/MS technology with desirable sensitivity and specificity has been widely applied for establishing RMPs, and many ID‐LC/MS/MS assays were also developed for PRA measurement. To date, there is still a lack of RMPs or reference materials developed for Ang1 or PRA in the JCTLM database. In 2016, the National Institute of Standards and Technology (NIST) provided a standard reference material (SRM 998) of Ang1, with a certified percentage of 99.9% and uncertainty of ±0.1% verified by high‐performance liquid chromatography and nuclear magnetic resonance technologies. This reference material laid the foundation for metrological traceability to SI units. Reliable RMP and commutable calibrators with values assigned with the RMP are the prerequisites for the quantity values transferred from the reference system to routine analysis. The uniform commutable calibrators may effectively improve the comparability across different routine measuring systems and methods, 65 which were considered more valuable and ranked higher in the traceability chain than commercial calibrators provided by manufacturers. 88
A uniform consensus about the sample preparation procedure should be established. Plasma samples that could not be analyzed immediately should be kept at −70°C until analysis. Rapid freeze–thaw is necessary to prevent substrate consumption and cryoactivation. Plasma samples supplemented with incubation buffer containing protease inhibitors (PMSF, SBTI, EDTA) were recommended to be incubated under 37°C for 3 h. It is still controversial whether the blanks could be ignored, more thorough evaluation and unified consultation were indispensable in the future. Notably, for immunoassays, commercial diagnostic kits provide operation protocol and uniform calibrators that are traceable to manufacturer‐claimed working calibrators, it is inconvenient for end‐users to arbitrarily change the specific incubation procedure. However, most LC–MS/MS assays established in Laboratory Developed Test (LDT) laboratories have a more flexible manner to adjust the incubation procedure. It would be more feasible to prioritize the unified incubation protocol for LDT laboratories. After achieving the unification of incubation among these LC–MS/MS methods, it is time to appeal for immunoassays to coordinate with this harmonized standard (e.g., modifying their kits) and eventually improves the consistency among various laboratories and assays.
Assuming that when more clinical laboratories participate in national EQA programs to monitor analytical performance, professional institutions prepare reference materials and uniform commutable calibrators, laboratories recognize and adopt uniform incubation guidelines, and appropriate bias or imprecision criteria are established for PRA, we believe that the standardization and consistency for PRA measurement are accessible in the foreseeable future.
7. CONCLUSION
PRA is an essential biomarker for PA and other endocrine disorders which provides important information in hypertension classification, medical guidance, and prognosis assessment. However, poor consistency was observed between laboratories and assays. To improve the harmonization and standardization for PRA measurement, first, considering that PRA is easily susceptible to external conditions in the analysis workflow, a consensus about a standardized protocol for PRA sample incubation and preparation should be reached. Second, we appeal for establishing RMPs based on ID‐LC/MS/MS for quantifying Ang1. Third, the adoption of commutable calibrators with values assigned by the RMP and participation in national EQA programs should be paid attention to, which help improve comparability and achieve traceability for routine measurement. Moreover, as retrospective studies and clinical validation accumulate, we believe that PRA may be widely used as a robust indicator and provide important utility for clinical application.
AUTHOR CONTRIBUTIONS
All authors have accepted responsibility for the entire content of this study and approved its submission.
CONFLICT OF INTEREST
The authors declare that they have no competing interests.
FUNDING INFORMATION
This study was supported by grants from the Beijing Natural Science Foundation (Grant Number: 7212087).
ETHICS STATEMENT
Not applicable.
Supporting information
List of abbreviations
ACKNOWLEDGMENTS
The authors would like to express their gratitude to EditSprings (https://www.editsprings.com/) for the expert linguistic services provided.
Liu Z, Jin L, Zhou W, Zhang C. The spectrum of plasma renin activity and hypertension diseases: Utility, outlook, and suggestions. J Clin Lab Anal. 2022;36:e24738. doi: 10.1002/jcla.24738
Contributor Information
Weiyan Zhou, Email: wyzhou@nccl.org.cn.
Chuanbao Zhang, Email: cbzhang@nccl.org.cn.
DATA AVAILABILITY STATEMENT
Data sharing is not applicable to this article as no new data were created or analyzed in this study.
REFERENCES
- 1. Song P, Zhang Y, Yu J, et al. Global prevalence of hypertension in children: a systematic review and meta‐analysis. JAMA Pediatr. 2019;173(12):1154‐1163. [DOI] [PMC free article] [PubMed] [Google Scholar]
- 2. Umesawa M, Kobashi G. Epidemiology of hypertensive disorders in pregnancy: prevalence, risk factors, predictors and prognosis. Hypertens Res. 2017;40(3):213‐220. [DOI] [PubMed] [Google Scholar]
- 3. Qi SF, Zhang B, Wang HJ, et al. Prevalence of hypertension subtypes in 2011 and the trends from 1991 to 2011 among Chinese adults. J Epidemiol Community Health. 2016;70(5):444‐451. [DOI] [PMC free article] [PubMed] [Google Scholar]
- 4. Whelton PK, He J, Muntner P. Prevalence, awareness, treatment and control of hypertension in North America, North Africa and Asia. J Hum Hypertens. 2004;18(8):545‐551. [DOI] [PubMed] [Google Scholar]
- 5. Ferdinand KC, Balavoine F, Besse B, et al. Efficacy and safety of firibastat, a first‐in‐class brain aminopeptidase a inhibitor, in hypertensive overweight patients of multiple ethnic origins. Circulation. 2019;140(2):138‐146. [DOI] [PubMed] [Google Scholar]
- 6. Mulatero P, Stowasser M, Loh KC, et al. Increased diagnosis of primary aldosteronism, including surgically correctable forms, in centers from five continents. J Clin Endocrinol Metab. 2004;89(3):1045‐1050. [DOI] [PubMed] [Google Scholar]
- 7. Calhoun DA. Hyperaldosteronism as a common cause of resistant hypertension. Annu Rev Med. 2013;64:233‐247. [DOI] [PubMed] [Google Scholar]
- 8. Funder JW. Primary aldosteronism: present and future. Vitam Horm. 2019;109:285‐302. [DOI] [PubMed] [Google Scholar]
- 9. Funder JW, Carey RM, Mantero F, Murad MH, et al. The Management of Primary Aldosteronism: case detection, diagnosis, and treatment: an Endocrine Society clinical practice guideline. J Clin Endocrinol Metab. 2016;101(5):1889‐1916. [DOI] [PubMed] [Google Scholar]
- 10. Hundemer GL, Curhan GC, Yozamp N, Wang M, Vaidya A. Cardiometabolic outcomes and mortality in medically treated primary aldosteronism: a retrospective cohort study. Lancet Diabetes Endocrinol. 2018;6(1):51‐59. [DOI] [PMC free article] [PubMed] [Google Scholar]
- 11. Nieman LK. Hypertension and cardiovascular mortality in patients with Cushing syndrome. Endocrinol Metab Clin North Am. 2019;48(4):717‐725. [DOI] [PubMed] [Google Scholar]
- 12. Hundemer GL, Curhan GC, Yozamp N, Wang M, Vaidya A. Incidence of atrial fibrillation and mineralocorticoid receptor activity in patients with medically and surgically treated primary aldosteronism. JAMA Cardiol. 2018;3(8):768‐774. [DOI] [PMC free article] [PubMed] [Google Scholar]
- 13. Hanslik G, Wallaschofski H, Dietz A, et al. Increased prevalence of diabetes mellitus and the metabolic syndrome in patients with primary aldosteronism of the German Conn's registry. Eur J Endocrinol. 2015;173(5):665‐675. [DOI] [PubMed] [Google Scholar]
- 14. Morganti A. A comparative study on inter and intralaboratory reproducibility of renin measurement with a conventional enzymatic method and a new chemiluminescent assay of immunoreactive renin. J Hypertens. 2010;28(6):1307‐1312. [DOI] [PubMed] [Google Scholar]
- 15. de Bruin RA, Bouhuizen A, Diederich S, Perschel FH, Boomsma F, Deinum J. Validation of a new automated renin assay. Clin Chem. 2004;50(11):2111‐2116. [DOI] [PubMed] [Google Scholar]
- 16. Camenzind AG, van der Gugten JG, Popp R, Holmes DT, Borchers CH. Development and evaluation of an immuno‐MALDI (iMALDI) assay for angiotensin I and the diagnosis of secondary hypertension. Clin Proteomics. 2013;10(1):20. [DOI] [PMC free article] [PubMed] [Google Scholar]
- 17. Fredline VF, Kovacs EM, Taylor PJ, Johnson AG. Measurement of plasma renin activity with use of HPLC‐electrospray‐tandem mass spectrometry. Clin Chem. 1999;45(5):659‐664. [PubMed] [Google Scholar]
- 18. Barnes SC. Measurement of plasma renin activity. Methods Mol Biol. 2013;1065:235‐244. [DOI] [PubMed] [Google Scholar]
- 19. Viola A, Monticone S, Burrello J, et al. Renin and aldosterone measurements in the management of arterial hypertension. Horm Metab Res. 2015;47(6):418‐426. [DOI] [PubMed] [Google Scholar]
- 20. Sealey JE. Plasma renin activity and plasma prorenin assays. Clin Chem. 1991;37(10 Pt 2):1811‐1819. [PubMed] [Google Scholar]
- 21. Campbell DJ, Nussberger J, Stowasser M, Danser AH, et al. Activity assays and immunoassays for plasma renin and prorenin: information provided and precautions necessary for accurate measurement. Clin Chem. 2009;55(5):867‐877. [DOI] [PubMed] [Google Scholar]
- 22. Ranjit A, Khajehpour S, Aghazadeh‐Habashi A. Novel treatment option for rheumatoid arthritis through bone‐targeted delivery of Novokinin. FASEB J. 2022;36(Suppl 1). doi: 10.1096/fasebj.2022.36.S1.R5316 [DOI] [PMC free article] [PubMed] [Google Scholar]
- 23. Bernstone L, Adaway JE, Keevil BG. An LC‐MS/MS assay for analysis of equilibrium angiotensin II in human serum. Ann Clin Biochem. 2021;58(5):422‐433. [DOI] [PubMed] [Google Scholar]
- 24. Stowasser M, Ahmed A, Guo Z, Wolley M, et al. Can screening and confirmatory testing in the Management of Patients with primary aldosteronism be improved? Horm Metab Res. 2017;49(12):915‐921. [DOI] [PubMed] [Google Scholar]
- 25. Nussberger J, Brunner DB, Waeber B, Brunner HR. True versus immunoreactive angiotensin II in human plasma. Hypertension. 1985;7(3 Pt 2):I1‐I7. [DOI] [PubMed] [Google Scholar]
- 26. Christen Y, Waeber B, Nussberger J, et al. Oral administration of DuP 753, a specific angiotensin II receptor antagonist, to normal male volunteers. Inhibition of pressor response to exogenous angiotensin I and II. Circulation. 1991;83(4):1333‐1342. [DOI] [PubMed] [Google Scholar]
- 27. Bragat AC, Blumenfeld J, Sealey JE. Effect of high‐performance liquid chromatography on plasma angiotensin II measurements in treated and untreated normotensive and hypertensive patients. J Hypertens. 1997;15(5):459‐465. [PubMed] [Google Scholar]
- 28. Danser AH, Deinum J. Renin, prorenin and the putative (pro)renin receptor. Hypertension. 2005;46(5):1069‐1076. [DOI] [PubMed] [Google Scholar]
- 29. Vilela LAP, Almeida MQ. Diagnosis and management of primary aldosteronism. Arch Endocrinol Metab. 2017;61(3):305‐312. [DOI] [PMC free article] [PubMed] [Google Scholar]
- 30. Thatcher SE. A brief introduction into the renin‐angiotensin‐aldosterone system: new and old techniques. Methods Mol Biol. 2017;1614:1‐19. [DOI] [PubMed] [Google Scholar]
- 31. Funder JW. Aldosterone and mineralocorticoid receptors‐physiology and pathophysiology. Int J Mol Sci. 2017;18(5):1032. doi: 10.3390/ijms18051032 [DOI] [PMC free article] [PubMed] [Google Scholar]
- 32. Buglioni A, Cannone V, Cataliotti A, et al. Circulating aldosterone and natriuretic peptides in the general community: relationship to cardiorenal and metabolic disease. Hypertension. 2015;65(1):45‐53. [DOI] [PMC free article] [PubMed] [Google Scholar]
- 33. Taylor PJ, Cooper DP, Gordon RD, Stowasser M. Measurement of aldosterone in human plasma by semiautomated HPLC‐tandem mass spectrometry. Clin Chem. 2009;55(6):1155‐1162. [DOI] [PubMed] [Google Scholar]
- 34. Zhang Q, Han L, Zheng S, et al. An isotope dilution liquid chromatography‐tandem mass spectrometry candidate reference measurement procedure for aldosterone measurement in human plasma. Anal Bioanal Chem. 2021;413(17):4471‐4481. [DOI] [PubMed] [Google Scholar]
- 35. Hinchliffe E, Carter S, Owen LJ, Keevil BG. Quantitation of aldosterone in human plasma by ultra high performance liquid chromatography tandem mass spectrometry. J Chromatogr B Analyt Technol Biomed Life Sci. 2013;913‐914:19‐23. [DOI] [PubMed] [Google Scholar]
- 36. Mosso L, Carvajal C, González A, Barraza A, et al. Primary aldosteronism and hypertensive disease. Hypertension. 2003;42(2):161‐165. [DOI] [PubMed] [Google Scholar]
- 37. Milliez P, Girerd X, Plouin PF, Blacher J, Safar ME, Mourad JJ. Evidence for an increased rate of cardiovascular events in patients with primary aldosteronism. J Am Coll Cardiol. 2005;45(8):1243‐1248. [DOI] [PubMed] [Google Scholar]
- 38. Arlt W, Lang K, Sitch AJ, Dietz AS, et al. Steroid metabolome analysis reveals prevalent glucocorticoid excess in primary aldosteronism. JCI Insight. 2017;2(8):e93136. doi: 10.1172/jci.insight.93136 [DOI] [PMC free article] [PubMed] [Google Scholar]
- 39. Aronow WS. Approaches for the management of resistant hypertension in 2020. Curr Hypertens Rep. 2020;22(1):3. [DOI] [PubMed] [Google Scholar]
- 40. Hundemer GL, Baudrand R, Brown JM, Curhan G, Williams GH, Vaidya A. Renin phenotypes characterize vascular disease, autonomous aldosteronism, and mineralocorticoid receptor activity. J Clin Endocrinol Metab. 2017;102(6):1835‐1843. [DOI] [PMC free article] [PubMed] [Google Scholar]
- 41. Pimenta E, Gordon RD, Ahmed AH, et al. Cardiac dimensions are largely determined by dietary salt in patients with primary aldosteronism: results of a case‐control study. J Clin Endocrinol Metab. 2011;96(9):2813‐2820. [DOI] [PMC free article] [PubMed] [Google Scholar]
- 42. van den Meiracker AH, Baggen RG, Pauli S, Lindemans A, et al. Spironolactone in type 2 diabetic nephropathy: effects on proteinuria, blood pressure and renal function. J Hypertens. 2006;24(11):2285‐2292. [DOI] [PubMed] [Google Scholar]
- 43. Muth A, Ragnarsson O, Johannsson G, Wängberg B. Systematic review of surgery and outcomes in patients with primary aldosteronism. Br J Surg. 2015;102(4):307‐317. [DOI] [PubMed] [Google Scholar]
- 44. Sato A, Hayashi K, Naruse M, Saruta T. Effectiveness of aldosterone blockade in patients with diabetic nephropathy. Hypertension. 2003;41(1):64‐68. [DOI] [PubMed] [Google Scholar]
- 45. Mavrakanas TA, Gariani K, Martin PY. Mineralocorticoid receptor blockade in addition to angiotensin converting enzyme inhibitor or angiotensin II receptor blocker treatment: an emerging paradigm in diabetic nephropathy: a systematic review. Eur J Intern Med. 2014;25(2):173‐176. [DOI] [PubMed] [Google Scholar]
- 46. Raff H, Carroll T. Cushing's syndrome: from physiological principles to diagnosis and clinical care. J Physiol. 2015;593(3):493‐506. [DOI] [PMC free article] [PubMed] [Google Scholar]
- 47. Huby AC, Antonova G, Groenendyk J, et al. Adipocyte‐derived hormone leptin is a direct regulator of aldosterone secretion, which promotes endothelial dysfunction and cardiac fibrosis. Circulation. 2015;132(22):2134‐2145. [DOI] [PubMed] [Google Scholar]
- 48. Ehrhart‐Bornstein M, Lamounier‐Zepter V, Schraven A, et al. Human adipocytes secrete mineralocorticoid‐releasing factors. Proc Natl Acad Sci U S A. 2003;100(24):14211‐14216. [DOI] [PMC free article] [PubMed] [Google Scholar]
- 49. Dinh Cat AN, Friederich‐Persson M, White A, Touyz RM. Adipocytes, aldosterone and obesity‐related hypertension. J Mol Endocrinol. 2016;57(1):F7‐f21. [DOI] [PubMed] [Google Scholar]
- 50. Van Der Gugten JG, Holmes DT. Quantitation of plasma renin activity in plasma using liquid chromatography‐tandem mass spectrometry (LC‐MS/MS). Methods Mol Biol. 2016;1378:243‐253. [DOI] [PubMed] [Google Scholar]
- 51. Kamon D, Okura H, Okamura A, et al. Plasma renin activity is an independent prognosticator in patients with myocardial infarction. Circ J. 2019;83(6):1324‐1329. [DOI] [PubMed] [Google Scholar]
- 52. Sealey JE, Gordon RD, Mantero F. Plasma renin and aldosterone measurements in low renin hypertensive states. Trends Endocrinol Metab. 2005;16(3):86‐91. [DOI] [PubMed] [Google Scholar]
- 53. Enslow BT, Stockand JD, Berman JM. Liddle's syndrome mechanisms, diagnosis and management. Integr Blood Press Control. 2019;12:13‐22. [DOI] [PMC free article] [PubMed] [Google Scholar]
- 54. Germano CM, de Castro M, Crescencio JC, Gallo L Jr, et al. The interaction of plasma renin activity and plasma atrial natriuretic peptide in 21‐hydroxylase deficiency patients. J Endocrinol Invest. 2005;28(4):300‐304. [DOI] [PubMed] [Google Scholar]
- 55. Schilbach K, Junnila RK, Bidlingmaier M. Aldosterone to renin ratio as screening tool in primary aldosteronism. Exp Clin Endocrinol Diabetes. 2019;127(2–03):84‐92. [DOI] [PubMed] [Google Scholar]
- 56. Olson N, DeJongh B, Hough A, Parra D. Plasma renin activity‐guided strategy for the management of hypertension. Pharmacotherapy. 2012;32(5):446‐455. [DOI] [PubMed] [Google Scholar]
- 57. Catena C, Colussi G, Nadalini E, et al. Relationships of plasma renin levels with renal function in patients with primary aldosteronism. Clin J Am Soc Nephrol. 2007;2(4):722‐731. [DOI] [PubMed] [Google Scholar]
- 58. Bystrom CE, Salameh W, Reitz R, Clarke NJ. Plasma renin activity by LC‐MS/MS: development of a prototypical clinical assay reveals a subpopulation of human plasma samples with substantial peptidase activity. Clin Chem. 2010;56(10):1561‐1569. [DOI] [PubMed] [Google Scholar]
- 59. Nagata S, Fukuda A, Kikuchi M, et al. Development of a novel AlphaLISA ImmunoAssay for big angiotensin‐25. Nephrology (Carlton). 2021;26(5):479‐484. [DOI] [PubMed] [Google Scholar]
- 60. Chappell DL, McAvoy T, Weiss B, Weiner R, Laterza OF. Development and validation of an ultra‐sensitive method for the measurement of plasma renin activity in human plasma via LC‐MS/MS. Bioanalysis. 2012;4(23):2843‐2850. [DOI] [PubMed] [Google Scholar]
- 61. Tamura N, Watanabe E, Shirakawa R, et al. Comparisons of plasma aldosterone and renin data between an automated chemiluminescent immunoanalyzer and conventional radioimmunoassays in the screening and diagnosis of primary aldosteronism. PLoS One. 2021;16(7):e0253807. [DOI] [PMC free article] [PubMed] [Google Scholar]
- 62. Carter S, Owen LJ, Kerstens MN, Dullaart RP, Keevil BG. A liquid chromatography tandem mass spectrometry assay for plasma renin activity using online solid‐phase extraction. Ann Clin Biochem. 2012;49(Pt 6):570‐579. [DOI] [PubMed] [Google Scholar]
- 63. Owen LJ, Adaway J, Morris K, Lockhart S, Keevil BG. A widely applicable plasma renin activity assay by LC‐MS/MS with offline solid phase extraction. Ann Clin Biochem. 2014;51(Pt 3):409‐411. [DOI] [PubMed] [Google Scholar]
- 64. Chen F, Cheng Z, Peng Y, et al. A liquid chromatography‐tandem mass spectrometry (LC‐MS/MS)‐based assay for simultaneous quantification of aldosterone, renin activity, and angiotensin II in human plasma. J Chromatogr B Analyt Technol Biomed Life Sci. 2021;1179:122740. [DOI] [PubMed] [Google Scholar]
- 65. Panteghini M. The never‐ending search of an acceptable compromise for pancreatic lipase standardisation. Clin Chem Lab Med. 2012;50(3):419‐421. [DOI] [PubMed] [Google Scholar]
- 66. Tong Q, Chen B, Zhang R, Zuo C. Standardization of clinical enzyme analysis using frozen human serum pools with values assigned by the International Federation of Clinical Chemistry and Laboratory Medicine reference measurement procedures. Scand J Clin Lab Invest. 2018;78(1–2):74‐80. [DOI] [PubMed] [Google Scholar]
- 67. Byrd JB, Turcu AF, Auchus RJ. Primary aldosteronism: practical approach to diagnosis and management. Circulation. 2018;138(8):823‐835. [DOI] [PMC free article] [PubMed] [Google Scholar]
- 68. Cannone V, Buglioni A, Sangaralingham SJ, et al. Aldosterone, hypertension, and antihypertensive therapy: insights from a general population. Mayo Clin Proc. 2018;93(8):980‐990. [DOI] [PMC free article] [PubMed] [Google Scholar]
- 69. Gradman AH, Kad R. Renin inhibition in hypertension. J Am Coll Cardiol. 2008;51(5):519‐528. [DOI] [PubMed] [Google Scholar]
- 70. Wang GM, Li LJ, Tang WL, Wright JM. Renin inhibitors versus angiotensin converting enzyme (ACE) inhibitors for primary hypertension. Cochrane Database Syst Rev. 2020;10(10):Cd012569. [DOI] [PMC free article] [PubMed] [Google Scholar]
- 71. Musini VM, Fortin PM, Bassett K, Wright JM. Blood pressure lowering efficacy of renin inhibitors for primary hypertension. Cochrane Database Syst Rev. 2008;(4):Cd007066. doi: 10.1002/14651858.CD007066.pub2 [DOI] [PubMed] [Google Scholar]
- 72. Azizi M, Webb R, Nussberger J, Hollenberg NK. Renin inhibition with aliskiren: where are we now, and where are we going? J Hypertens. 2006;24(2):243‐256. [DOI] [PubMed] [Google Scholar]
- 73. Ahmed AH, Gordon RD, Taylor PJ, Ward G, Pimenta E, Stowasser M. Effect of contraceptives on aldosterone/renin ratio may vary according to the components of contraceptive, renin assay method, and possibly route of administration. J Clin Endocrinol Metab. 2011;96(6):1797‐1804. [DOI] [PubMed] [Google Scholar]
- 74. Sitruk‐Ware R. Pharmacology of different progestogens: the special case of drospirenone. Climacteric. 2005;8(Suppl 3):4‐12. [DOI] [PubMed] [Google Scholar]
- 75. Biswas A, Biswas S, Viegas OA. Effect of etonogestrel subdermal contraceptive implant (Implanon®) on liver function tests — a randomized comparative study with Norplant® implants. Contraception. 2004;70(5):379‐382. [DOI] [PubMed] [Google Scholar]
- 76. Hassani‐Nezhad‐Gashti F, Salonurmi T, Hautajärvi H, Rysä J, Hakkola J, Hukkanen J. Pregnane X receptor activator rifampin increases blood pressure and stimulates plasma renin activity. Clin Pharmacol Ther. 2020;108(4):856‐865. [DOI] [PubMed] [Google Scholar]
- 77. Haase M, Riester A, Kröpil P, et al. Outcome of adrenal vein sampling performed during concurrent mineralocorticoid receptor antagonist therapy. J Clin Endocrinol Metab. 2014;99(12):4397‐4402. [DOI] [PubMed] [Google Scholar]
- 78. Ching KC, Cohen DL, Fraker DL, Trerotola SO. Adrenal vein sampling for primary aldosteronism: a 2‐week protocol for withdrawal of renin‐stimulating antihypertensives. Cardiovasc Intervent Radiol. 2017;40(9):1367‐1371. [DOI] [PubMed] [Google Scholar]
- 79. Nanba AT, Wannachalee T, Shields JJ, et al. Adrenal vein sampling lateralization despite mineralocorticoid receptor antagonists exposure in primary aldosteronism. J Clin Endocrinol Metab. 2019;104(2):487‐492. [DOI] [PMC free article] [PubMed] [Google Scholar]
- 80. Ganesh M, Abadin SS, Fogelfeld L. Adrenal vein sampling without discontinuation of mineralocorticoid receptor antagonist therapy. Endocr Pract. 2020;26(9):953‐959. [DOI] [PubMed] [Google Scholar]
- 81. Locsei Z, Racz K, Patocs A, Kovacs GL, Toldy E. Influence of sampling and storage conditions on plasma renin activity and plasma renin concentration. Clin Chim Acta. 2009;402(1–2):203‐205. [DOI] [PubMed] [Google Scholar]
- 82. Chakera AJ, McDonald TJ, Knight BA, Vaidya B, Jones AG. Current laboratory requirements for adrenocorticotropic hormone and renin/aldosterone sample handling are unnecessarily restrictive. Clin Med (Lond). 2017;17(1):18‐21. [DOI] [PMC free article] [PubMed] [Google Scholar]
- 83. Rehan M, Raizman JE, Cavalier E, Don‐Wauchope AC, Holmes DT. Laboratory challenges in primary aldosteronism screening and diagnosis. Clin Biochem. 2015;48(6):377‐387. [DOI] [PubMed] [Google Scholar]
- 84. Hildebrand D, Merkel P, Eggers LF, Schlüter H. Proteolytic processing of angiotensin‐I in human blood plasma. PLoS One. 2013;8(5):e64027. [DOI] [PMC free article] [PubMed] [Google Scholar]
- 85. Haber E, Koerner T, Page LB, Kliman B, Purnode A. Application of a radioimmunoassay for angiotensin I to the physiologic measurements of plasma renin activity in normal human subjects. J Clin Endocrinol Metab. 1969;29(10):1349‐1355. [DOI] [PubMed] [Google Scholar]
- 86. Sealey JE, Laragh JH. Radioimmunoassay of plasma renin activity. Semin Nucl Med. 1975;5(2):189‐202. [DOI] [PubMed] [Google Scholar]
- 87. Thienpont LM, Van Uytfanghe K, De Leenheer AP. Reference measurement systems in clinical chemistry. Clin Chim Acta. 2002;323(1–2):73‐87. [DOI] [PubMed] [Google Scholar]
- 88. In vitro diagnostic medical devices—Requirements for establishing metrological traceability of values assigned to calibrators, trueness control materials and human samples (2019).
- 89. Stowasser M, Ahmed AH, Pimenta E, Taylor PJ, Gordon RD. Factors affecting the aldosterone/renin ratio. Horm Metab Res. 2012;44(3):170‐176. [DOI] [PubMed] [Google Scholar]
- 90. Hannemann A, Friedrich N, Lüdemann J, et al. Reference intervals for aldosterone, renin, and the aldosterone‐to‐renin ratio in the population‐based study of health in Pomerania (SHIP‐1). Horm Metab Res. 2010;42(6):392‐399. [DOI] [PubMed] [Google Scholar]
- 91. Rowe J, Gallery ED, Györy AZ. Cryoactivation of renin in plasma from pregnant and nonpregnant subjects, and its control. Clin Chem. 1979;25(11):1972‐1974. [PubMed] [Google Scholar]
- 92. Glinicki P, Jeske W, Gietka‐Czernel M, et al. The effect of blood collection procedure on plasma renin activity (PRA) and concentrations of direct renin (DRC) and aldosterone. J Renin Angiotensin Aldosterone Syst. 2015;16(2):339‐343. [DOI] [PubMed] [Google Scholar]
- 93. Snoep JD, Hovens MM, Pasha SM, Frölich M, et al. Time‐dependent effects of low‐dose aspirin on plasma renin activity, aldosterone, cortisol, and catecholamines. Hypertension. 2009;54(5):1136‐1142. [DOI] [PubMed] [Google Scholar]
- 94. Roding JH, Weterings T, van der Heiden C. Plasma renin activity: temperature optimum at approximately 45 degrees C. Clin Chem. 1997;43(7):1243‐1244. [PubMed] [Google Scholar]
Associated Data
This section collects any data citations, data availability statements, or supplementary materials included in this article.
Supplementary Materials
List of abbreviations
Data Availability Statement
Data sharing is not applicable to this article as no new data were created or analyzed in this study.