

Abstract
Background
To identify a novel marker for gastric cancer, we examined the usefulness of phosphoglycerate mutase 1 (PGAM1) as a potential diagnostic marker using isobaric tags for relative and absolute quantitation (iTRAQ)‐based quantitative proteomics and evaluated its clinical significance.
Methods
Proteins from a discovery group of four paired gastric cancer tissues and adjacent gastric tissues were labeled with iTRAQ reagents and then identified and quantified using LC–MS/MS. The expression of PGAM1 was further validated in 139 gastric cancer patients using immunohistochemistry. Furthermore, the correlation of PGAM1 expression with clinical parameters was analyzed. Gene set enrichment analysis (GSEA) was performed to identify gene sets that were activated in PGAM1‐overexpressing patients with gastric cancer.
Results
PGAM1 was significantly overexpressed in most cancers but particularly so in gastric cancer, with a sensitivity of 82.01% (95% confidence interval [CI]: 75.5%–88.5%) and specificity of 79.13% (95% CI: 72.3%–86%). Its expression was significantly associated with histological grade II and III tumors (p = 0.033), lymph node metastasis (p = 0.031), and TNM III‐IV staging (p = 0.025). The area under the receiver operating characteristic (ROC) curve for the detection of PGAM1 overexpression in gastric cancer was 0.718 (p < 0.01). Furthermore, GSEA revealed that several important pathways such as glycolysis pathway and immune pathways were significantly enriched in patients with gastric cancer with PGAM1 overexpression.
Conclusions
This study provided a sensitive method for detecting PGAM1, which may serve as a novel indicator for poor prognosis of gastric cancer, as well as a potent drug target for gastric cancer.
Keywords: biomarker, Gastric cancer, gene set enrichment analysis, iTRAQ, phosphoglycerate mutase 1
The signaling pathways were significantly enriched in PGAM1‐high‐expression patients with gastric cancer by GSEA analysis. The graph showed the TOP pathways enriched in PGAM1‐high‐expression gastric cancer patients.

1. INTRODUCTION
Gastric cancer (GC) is one of the most common gastrointestinal malignancies and a leading cause of cancer‐related death worldwide. Although the incidence of gastric cancer has decreased over the past decades, the 5‐year overall survival rate remains as low as 30%–40% for advanced‐stage disease. 1 , 2 Early‐stage gastric cancer is a lesion that is limited to the mucosa or submucosa. Owing to the occult onset and poor prognosis, patients with gastric cancer always present at an advanced stage and often have distant metastases. The prognosis of patients with early gastric cancer is favorable, and the 5‐year survival rate can be over 90% after radical gastrectomy. 3 , 4
Therefore, the early diagnosis of gastric cancer is critical for the initiation of appropriate treatment. The detection of plasma markers in patients with gastric cancer is more convenient compared to other methods of detection; therefore, plasma markers are widely used in the diagnosis of early gastric cancer. 5 Although carcinoembryonic antigen (CEA) and carbohydrate antigen (CA) 19–9 have been used as serum marker for gastric cancer diagnosis and for monitoring patients' responses to chemotherapy, their applications are severely limited because of their poor sensitivity and specificity in early detection. 6 , 7 , 8 It is essential to identify more sensitive biomarkers to improve the early diagnosis and treatment of gastric cancer.
The purpose of this study was to investigate early diagnostic biomarkers for gastric cancer using the highly sensitive iTRAQ labeling quantitative proteomics, validate its expression using immunohistochemistry, and explore the pathways that promote the progression of gastric cancer.
2. MATERIALS AND METHODS
2.1. Patients and specimens
We collected 139 gastric cancer tissues and paired adjacent gastric tissues (>5 cm from the edges of the primary tumors) from the Affiliated Hospital of North Sichuan Medical College. The present study was approved by the institutional ethics committee of North Sichuan Medical College. All specimens were obtained from patients with gastric cancer who had not received chemotherapy or radiotherapy prior to surgery. We also collected samples from 25 patients with benign gastritis. All patients with gastric cancer were classified according to the 8th edition of the Union for International Cancer Control and the American Joint Committee on Cancer gastric cancer TNM staging system.
2.2. Proteins extraction and iTRAQ labeling
The gastric cancer tissues were dissolved in PBS buffer followed by protein extraction using RIPA buffer, treated with ultrasound for 15 s four times, and centrifuged at 12,000 rpm, 4°C for 20 min. The supernatant was transferred to a clean tube. The protein concentrations were determined using a Bradford protein assay (Bio‐Rad Laboratories, Inc., Hercules), and the protein samples were stored at −80°C until use. After the proteins were digested with trypsin overnight at 37°C, iTRAQ reagents were used to label the digested peptides. For iTRAQ labeling, the tryptic peptides were reconstituted in iTRAQ reagent buffer, and the four groups of gastric cancer tissue extracts were labeled separately with four different iTRAQ labeling reagents 113/114, 115/116, 117/118, and 119/121, respectively.
2.3. Strong cation exchange chromatography
Using a Shimadzu LC‐20AB HPLC pump system, the pooled samples were diluted 10‐fold with a loading buffer. The peptide mixtures were reconstituted in 4 ml of buffer A (25 mM NaH2PO4 in 25% ACN, pH 2.7) and loaded onto a 5‐μm particle size, 4.6 × 250 mm Ultremex SCX column (Phenomenex). The column was eluted with a gradient of buffer A (25 mM NaH2PO4 in 25% ACN, pH 2.7) for 10 min, 5%–35% buffer B (25 mM NaH2PO4, 1 M KCl, 25% ACN, pH 2.7) for 11 min, and 35%–80% buffer B for 1 min. The eluted peptides were pooled into 20 fractions, and the peptides were desalted and then evaporated using a SpeedVac.
2.4. LC‐ESI‐MS/MS Analysis
Each fraction was re‐suspended in buffer A (2% ACN, 0.1% FA). The final concentration of peptides was approximately 0.25 μg/μl. The HPLC setup was equipped with the LTQ Orbitrap Velos (Thermo) system. Intact peptides could be detected at a resolution of 50,000. A data‐dependent acquisition protocol was applied to the mass spectrometry (MS) scan for the 8 most abundant precursor ions. For MS scans, the m/z scan range was 350–2000 Da.
2.5. Bioinformatics analysis
The International Protein Index (IPI) human database was used to explain the MS/MS data. A decoy database was also searched, and a 1% false discovery rate (FDR) was set. We allowed a tolerance of 10 ppm and 0.05 Da on the fragment ions. A protein was considered to be significantly altered if it expressed a 1.2‐fold change in gastric cancer tissues relative to that of tissues in the control group.
2.6. Immunohistochemistry (IHC) analysis
Formalin‐fixed and paraffin‐embedded gastric cancer tissues and paired paracancerous tissues were used for immunohistochemical studies. Deparaffinized and rehydrated slides were placed in the antigen retrieval buffer (10 mM sodium citrate, pH 6.0) at 95°C for 20 min. After being blocked with endogenous peroxidases for 10 min, the slides were washed in 0.01 M PBS. The slides were incubated with an antibody against phosphoglycerate mutase 1 (Abcam) at dilution of 1:100 at 4°C overnight. After being washed with 0.01 M PBS, 3,3′‐diaminobenzidine (DAKO, Carpinteria) was used to visualize the expression of PGAM1. The slides were then counterstained with hematoxylin and dehydrated. 9
2.7. Gene set enrichment analysis
Gene set enrichment analysis (GSEA) was used to elucidate pathways that were activated in gastric cancer. The RNA‐Seq data of gastric cancer from the Gene Expression Omnibus database (GSE84437) was analyzed using GSEA software (V2.0, Broad Institute, Cambridge, MA, USA). Gene sets with p value ≤0.05 and FDR <0.25 were considered significantly enriched.
2.8. Statistical analysis
Statistical analyses were performed using SPSS version 22.0 (SPSS Inc., Chicago, IL, USA). The Chi‐square test was used to compare differences between the control and experimental groups. All p values ≤0.05 were considered statistically significant.
3. RESULTS
3.1. Protein identification in gastric cancer tissues
We used a discovery group of four pairs of technical replicates of gastric cancer tissues and adjacent gastric tissues to perform the iTRAQ quantitative proteomics. A total of 431 proteins were found to be differentially expressed in gastric cancer tissues when compared with those in adjacent gastric tissues. 10 PGAM1 was found to be overexpressed in gastric cancer tissues with a 1.233‐fold change compared with that in adjacent gastric tissues (p < 0.01). Figure 1 shows the representative MS/MS peptide spectrum of PGAM1 identified in gastric cancer tissues. Similarly, the results from the gene expression profiling interactive analysis (GEPIA) database showed that PGAM1 was significantly upregulated in patients with stomach adenocarcinoma (Figure 2).
FIGURE 1.
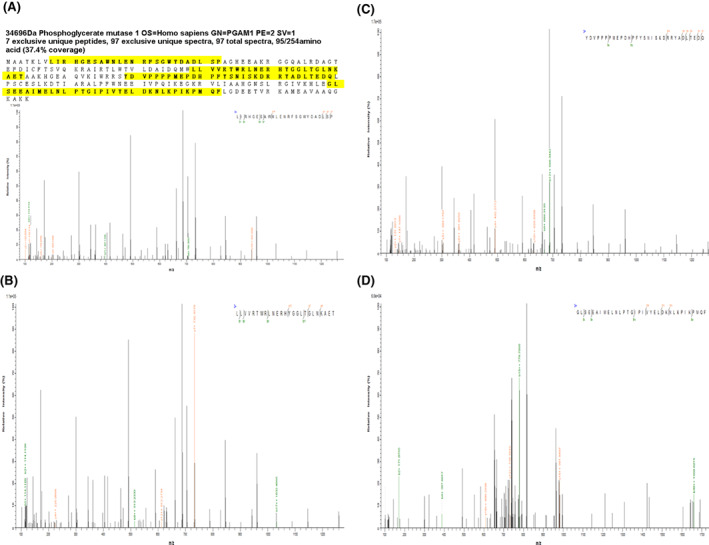
Representative MS/MS spectrums of phosphoglycerate mutase 1
FIGURE 2.

Expression of phosphoglycerate mutase 1 in the gene expression profiling interactive analysis database. STAD, stomach adenocarcinoma
3.2. IHC analysis of PGAM1 expression in gastric cancer
In the present study, we used 139 gastric cancer tissues and adjacent gastric tissues to detect the PGAM1 expression. PGAM1 was predominantly expressed in plasma of gastric cancer. The results showed that PGAM1 was upregulated in gastric cancer tissues (Figure 3C,D) than in adjacent tissues (Figure 3B). The results were consistent with the proteomics results. In gastric cancer tissues, 114 cases presented strong positivity for PGAM1, while 29 cases showed positivity in adjacent gastric tissues (Table 1). Regarding the detection of PGAM1 in gastric cancer, our findings showed a sensitivity of 82.01% (95% CI: 75.5%–88.5%) and a specificity of 79.13% (95% CI: 72.3%–86%).
FIGURE 3.

Validation of phosphoglycerate mutase 1 (PGAM1) expression in gastric cancer using immunohistochemistry analysis. PGAM1 was predominantly expressed in plasma (A, gastric benign lesions; B, adjacent cancer tissues; C and D, gastric cancer tissues).
TABLE 1.
Detection of PGAM1 expression in gastric cancer, adjacent tissues, and benign lesions
| PGAM1 expression | Gastric Cancer tissues | Adjacent tissues | Benign lesions | p‐Value |
|---|---|---|---|---|
| PGAM1 negativity | 25 | 110 | 18 | |
| PGAM1 positivity | 114 | 29 | 7 | <0.001 |
Note: Chi‐square test was used to calculate the difference, with a significance level of p ≤ 0.05.
3.3. Relationship between PGAM1 expression and clinicopathological variables
The relationship between the expression of PGAM1 in gastric cancer and clinicopathological variables was analyzed using the Chi‐square and Fisher's exact test. As can be seen from Table 2, patients with histological grade II and III disease had significantly higher expression of PGAM1 compared to that among patients with histological grade I (p = 0.033). Moreover, patients with lymph node metastasis had higher expression of PGAM1 than did patients without lymph node metastasis (0.031). Patients with TNM stage III and IV had significantly higher expression of PGAM1 than did patients with TNM stage I and II (p = 0.025). To evaluate the diagnostic efficacy of PGAM1 in detecting early gastric cancer, we performed the ROC curve analysis. The area under curve for PGAM1 was 0.718 (p < 0.01) (Figure 4).
TABLE 2.
PGAM1 expression correlated with clinicopathological parameters in patients with gastric cancer
| Clinicopathological parameters | PGAM1 negativity | PGAM1 positivity | Cases | p Value |
|---|---|---|---|---|
| Age (year) | ||||
| ≥60 | 15 | 76 | 91 | 0.526 |
| ≤59 | 10 | 38 | 48 | |
| Sex | ||||
| Male | 17 | 73 | 90 | 0.707 |
| Female | 8 | 41 | 49 | |
| Histology classification | ||||
| Adenocarcinoma | 20 | 96 | 116 | 0.608 |
|
Signet‐ring cell carcinoma |
5 | 18 | 23 | |
| Histological grade | ||||
| I | 15 | 42 | 57 | 0.033 |
| II and III | 10 | 72 | 82 | |
| Lymph node metastasis | ||||
| Positive | 9 | 68 | 77 | 0.031 |
| Negative | 16 | 46 | 62 | |
| TNM Staging | ||||
| I and II | 16 | 45 | 61 | 0.025 |
| III and IV | 9 | 69 | 78 | |
Note: Chi‐square test was used to calculate the difference, with a significance level of p ≤ 0.05.
FIGURE 4.

ROC curve of PGAM1 in detecting gastric cancer. (AUC = 0.718, p < 0.01)
3.4. GSEA to elucidate pathways in gastric cancer
GSEA was used to analyze the RNA‐seq data of gastric cancer from the GEO database (GSE84437). Based on PGAM1 expression, the samples were defined as a PGAM1‐high group (top 50%) and a PGAM1‐low group (bottom 50%). Using the following criteria: nominal NES >1, p‐value ≤0.05, and FDR <0.25, 208 gene sets were significantly enriched in the PGAM1 high‐expression group. The TOP 10 pathways enriched in the PGAM1 high‐expression group are shown in Table 3. The TOP 6 enriched pathways in the PGAM1 high‐expression group were resting_vs_tcr_activated_cd4_tcell_dn (NES = 3.38), gocc_ficolin_1_rich_granule (NES = 3.37), schlosser_myc_targets_repressed_by_serum (NES = 3.26), gocc_ficolin_1_rich_granule_lumen (NES = 3.15), cd4pos_vs_cd8pos_dc_dn (NES = 2.99), and mootha_pgc (NES = 2.94) (Figure 5A–F).
TABLE 3.
Top pathways that were significantly enriched in the PGAM1‐high‐expression group in gastric cancer according to gene set enrichment analysis
| NAME | SIZE | ES | NES | NOM p‐val | FDR Q‐val |
|---|---|---|---|---|---|
| PGAM1‐high expression group | |||||
| Resting_vs_tcr_activated_cd4_tcell_dn | 170 | 0.48 | 3.38 | 0.000 | 0.000 |
| Gocc_ficolin_1_rich_granule | 176 | 0.55 | 3.37 | 0.000 | 0.000 |
| Schlosser_myc_targets_repressed_by_serum | 132 | 0.64 | 3.26 | 0.000 | 0.000 |
| Gocc_ficolin_1_rich_granule_lumen | 120 | 0.59 | 3.15 | 0.000 | 0.000 |
| Cd4pos_vs_cd8pos_dc_dn | 178 | 0.47 | 2.99 | 0.000 | 0.000 |
| Mootha_pgc | 372 | 0.51 | 2.94 | 0.000 | 0.000 |
| Wp_metabolic_reprogramming_in_colon_cancer | 40 | 0.63 | 2.92 | 0.000 | 0.000 |
| Naive_cd4_tcell_vs_dc_dn | 181 | 0.63 | 2.92 | 0.000 | 0.000 |
| Gobp_ribonucleoside_diphosphate_metabolic_process | 105 | 0.51 | 2.89 | 0.000 | 0.000 |
| Gobp_generation_of_precursor_metabolites_and_energy | 399 | 0.50 | 2.80 | 0.000 | 0.000 |
FIGURE 5.

Gene sets activated in the PGAM1‐high expression group, which comprised patients with gastric cancer, according to GSEA analysis. The results showed the TOP 6 pathways enriched in PGAM1‐high‐expression gastric cancer patients (A–F).
4. DISCUSSION
Although endoscopic biopsy has been widely used in clinical practice, there is still a lack of non‐invasive and effective biomarkers for the early detection of gastric cancer. Most patients with gastric cancer present at advanced stages. Moreover, traditional serum biomarkers for gastric cancer have unsatisfactory sensitivity and specificity. Therefore, it was essential to explore novel diagnostic markers with high sensitivity and specificity for gastric cancer. Our previous study showed that a total of 431 proteins were differentially expressed in gastric cancer tissues relative to those in adjacent gastric tissues. 10 PGAM1 was found to be overexpressed in gastric cancer tissues with a 1.233‐fold change. Similarly, the results from the GEPIA database showed that PGAM1 was significantly upregulated in patients with stomach adenocarcinoma (Figure 2).
Phosphoglycerate mutase 1 catalyzes 3‐phosphoglycerate (3‐PG) into 2‐phosphoglycerate (2‐PG) using phospho‐histidine 11 as a phosphate donor/acceptor site within its catalytic domain through the formation of a 2,3‐bisphosphoglycerate intermediate. 11 , 12 , 13 Generally, PGAM1 is expressed in various tissues during the cell biological process. 14 Previous studies have demonstrated that PGAM1 is overexpressed in most cancers, including hepatocellular carcinoma, pancreatic cancer, lung cancer, and gliomas. 15 , 16 , 17 , 18 However, the expression of PGAM1 in gastric cancer is still unclear.
Xu et al. 19 found that PGAM1 expression was significantly higher in glioma tissues than in normal brain tissues. PGAM1 expression was significantly associated with the WHO grade of glioma, which suggests that PGAM1 might be a therapeutic target for gliomas. Li et al. 20 detected PGAM1 expression in clear cell renal cell carcinoma (ccRCC) and found that PGAM1 was expressed at a higher level in 45.8% of ccRCC tissues than in 32.5% of normal kidney tissues. The expression of PGAM1 was significantly associated with age, tumor size, and T stage in ccRCC.
In the present study, using iTRAQ‐labeled quantitative proteomics and immunohistochemistry, we found that PGAM1 was significantly more expressed in 114 (82.01%) gastric cancer specimens than in 29 (20.87%) adjacent gastric tissue samples (Table 1). PGAM1 was predominantly expressed in gastric cancer cell plasma (Figure 3C,D). The sensitivity and specificity of PGAM1 in detecting gastric cancer were 82.01% (95% confidence interval [CI]: 75.5%–88.5%) and 79.13% (95% CI: 72.3%–86%), better than those of traditional biomarkers, such as CEA and CA 19–9. Moreover, the area under the receiver operating characteristic (ROC) curve for detecting PGAM1 in gastric cancer tissues was 0.718 (Figure 4).
Ohba et al. 11 demonstrated that PGAM1 binds to WIP1 and inhibits its nuclear translocation, resulting in the dephosphorylation of the ATM signaling pathway. Inhibition of PGAM1 increased the therapeutic efficacy of irradiation and chemotherapy in gliomas. Previous studies have demonstrated that PGAM1 expression is regulated by TP53. 21 Increasing expression of PGAM1 resulted in the immortalization of primary tumor cells. 22 Li et al. found that silencing PGAM1 expression inhibits the proliferation and invasion of NSCLC cells mediated by the tumor growth factor‐β (TGF‐β) signaling pathway. A further study demonstrated that miR‐3614‐5p could target PGAM1 mRNA in a hypoxia‐independent manner. 23 These studies suggest that PGAM1 is a potent target for the inhibition of cancer cell proliferation and growth.
Several studies have explored the effectiveness of compounds such as PGAM1 inhibitors (PGMI). 24 Based on the lead compound PGMI‐004A, Wang et al. 25 discovered a series of xanthone derivatives that were PGAM1 inhibitors using scaffold hopping and sulfonamide reversal strategy. The xanthone derivatives showed higher potency against PGAM1 than PGMI‐004A and demonstrated moderate anti‐proliferation activity in several cancer cell lines. Wen et al. 26 demonstrated that compound KH3 significantly suppressed the proliferation of various pancreatic ductal adenocarcinoma cells by inhibiting the levels of glycolysis and mitochondrial respiration in correlation with PGAM1 expression. Moreover, Huang et al. 27 discovered a novel PGAM1 allosteric inhibitor HKB99 that could significantly block the structure of PGAM1 and impact both catalytic activity and ACTA2 interaction.
Furthermore, to screen novel inhibitors for PGAM1, Fang et al. 28 explored the structure–activity relationships of anthraquinone compounds using 3D‐QSAR and molecular dynamics simulation models and obtained satisfactory results that provide clues for the rational design of new inhibitors. Recently, Kanwal et al. used in silico tools to evaluate phytochemical compounds that showed higher binding affinities than PGMI‐004A. Using this method, they identified eight phytochemicals that showed a significant binding affinity with the active site of PGAM1. 29 In addition, Mazhar Fareed et al. used the same method to screen 5000 Chinese traditional medicinal phytochemical libraries. They finally found that three medicinal compounds, namely, n‐Nitrosohexamethyleneimine, Subtrifloralactone‐K, and Kanzonol‐n in chain‐A, could successfully bind with the active pockets of PGAM1. 30 Their findings provided an effective method for the identification of hit molecules that could be useful in the development of new drugs against various cancer targets.
In the present study, we performed GSEA to explore the gene sets that were activated in PGAM1‐high‐expression gastric cancer. The results revealed 208 gene sets that were significantly activated, whereas three signal pathways were significantly enriched in PGAM1‐low‐expression patients. The most significantly enriched signal pathways were TCR‐activated CD4 T cell, ficolin 1 rich granule, myc targets repressed by serum, ficolin 1 rich granule lumen, CD4 pos versus CD8 pos DC, mootha pgc, etc. (Figure 5 and Table 3). These results suggest that these gene sets and pathways are tightly correlated with PGAM1 expression in patients with gastric cancer. Among the TOP 10 pathways, the 1st, 5th and 8th pathway were activated CD4 T cell, CD4+ versus CD8+ DC and Naïve CD4+ T cell, respectively. These three pathways were significantly activated in PGAM1 overexpression group gastric cancer patient. The first signal pathway is TCR activated CD4 T cell, in which there was an oncogenic protein BCL‐1 in the progression of cancer. Wen et al demonstrated that knockdown of PGAM1 by siRNA inhibited cell proliferation, migration, and invasion and enhanced cancer cell apoptosis at cellular level. In vivo study, PGAM1 knockdown markedly suppressed tumor growth. Mechanically, deletion of PGAM1 resulted in decreased expression of BCL‐1, enhanced expression of Bax, caspases‐3 and inhibition of MMP‐2 and MMP‐9 expression. 31 Moreover, previous studies have demonstrated the role of glycolysis in T cell‐dependent immune response. However, the regulatory mechanism of glycolysis in activated T cells has not been fully elucidated. Toriyama used T cell‐specific PGAM1 deficient mice to demonstrate the regulatory mechanism of glycolysis in activated T cells. They found that both CD8 and CD4 T cell‐dependent immune responses were attenuated by PGAM1 deficiency. Moreover, the helper T cell‐dependent inflammation was also ameliorated in PGAM1 deficient mice. These results indicated that PGAM1 was essential for the CD8 and CD4 T cell‐dependent immune responses and the helper T cell‐dependent inflammation. Further study explored that glycolysis increased the activation of mTOR complex 1 (mTORC1) and the T‐cell receptor (TCR) signals. 32 Moreover, the 7th gene sets was the metabolic reprogramming pathway, in which there were 44 genes were significantly activated in gastric cancer cells. The NES of this metabolic reprogramming pathway was 2.292, the p value was<0.001, and FDR was <0.001. Many genes enriched in this pathway were key enzymes in glycolytic pathway and fatty acid metabolism pathway, such as PGAM1, G6PD, GAPDH, LDHA, PGK1, PKM, HK3, ACLY, FASN, GLS, GLUD1, GOT2, PDHB, PFKL, and PGD. These results indicated that the metabolic reprogramming pathway was specific for PGAM1 overexpression in gastric cancer. The PGAM1 overexpression may activated other genes expression and vice versa. Liu et al demonstrated that silencing PGAM1 decreased the proliferation, migration and invasion of pancreatic cancer cell lines. Mechanically, PGAM1 mutually regulated HIF‐1α and PGAM1 itself was modulated by the PI3K/Akt/mTOR pathway as a novel downstream target. 33 The detailed mechanism remains needed to be further elucidated by experiments at cellular level and animal level. The major limitation of the present study was that the relationship of PGAM1 expression with clinicopathological parameters was not verified at the cellular level and animal level. We can refer to the previous study which demonstrated that knockdown of PGAM1 decreased the glucose consumption and lactate production of NSCLC cell. The reduction in PGAM1 attenuated the tumor formation of Pten−/‐MEFs in nude mice and prolonged the survival of the tumor bearing mice. 12 The sample size of the present study was relatively small. Based on the results of present study, we will continue to explore the mechanism that PGAM1 overexpressed in gastric cancer in future work.
5. CONCLUSION
In the present study, we used iTRAQ‐based quantitative proteomics to demonstrate that PGAM1 was significantly overexpressed in gastric cancer. The expression of PGAM1 was varied in different subgroups of patients with gastric cancer, and expression was tightly correlated with histological grade, lymph node metastasis, and TNM stage. These findings suggest that PGAM1 was a novel indicator for poor prognosis of gastric cancer, as well as a potent drug target for gastric cancer.
ACKNOWLEDGMENTS
We would like to thank the funding projects of the National Natural Science Foundation of China (81702093), the Sichuan Provincial Department of Science and Technology (2020YJ0379), and the Special Foundation of Cooperation between Nanchong Government and North Sichuan Medical College (20SXJCQN0004; 20SXQT0053; 18SXHZ0281).
Wei C, Xie J, Yuan X, et al. Phosphoglycerate mutase 1 that is essential for glycolysis may act as a novel metabolic target for predicating poor prognosis for patients with gastric cancer. J Clin Lab Anal. 2022;36:e24718. doi: 10.1002/jcla.24718
DATA AVAILABILITY STATEMENT
The dataset (GSE84437) of this study is available on GEO database (https://www.ncbi.nlm.nih.gov/geo/query/acc.cgi?acc=GSE84437). Other data are available from the corresponding author upon reasonable request.
REFERENCES
- 1. Smyth EC, Nilsson M, Grabsch HI, van Grieken NC, Lordick F. Gastric cancer. Lancet. 2020;396:635‐648. [DOI] [PubMed] [Google Scholar]
- 2. Wu H, Miao X, Liu Y, Zhang S, Li C, Hao J. Clinical efficacy of modified Yiwei Shengyang decoction combined with FOLFOX4 chemotherapy regimen in the treatment of advanced gastric cancer and its effect on tumor marker levels. Evid Based Complement Alternat Med. 2022;2022:6234032‐6234035. [DOI] [PMC free article] [PubMed] [Google Scholar] [Retracted]
- 3. Joshi SS, Badgwell BD. Current treatment and recent progress in gastric cancer. CA Cancer J Clin. 2021;71:264‐279. [DOI] [PMC free article] [PubMed] [Google Scholar]
- 4. Wei L, Sun J, Zhang N, et al. Noncoding RNAs in gastric cancer: implications for drug resistance. Mol Cancer. 2020;19:62. [DOI] [PMC free article] [PubMed] [Google Scholar]
- 5. Feng F, Tian Y, Xu G, et al. Diagnostic and prognostic value of CEA, CA19‐9, AFP and CA125 for early gastric cancer. BMC Cancer. 2017;17:737. [DOI] [PMC free article] [PubMed] [Google Scholar]
- 6. Liu X, Cheng Y, Sheng W, et al. Clinicopathologic features and prognostic factors in alpha‐fetoprotein‐producing gastric cancers: analysis of 104 cases. J Surg Oncol. 2010;102:249‐255. [DOI] [PubMed] [Google Scholar]
- 7. Xiao J, He X, Wang Z, et al. Serum carbohydrate antigen 19‐9 and prognosis of patients with gastric cancer. Tumour Biol. 2014;35:1331‐1334. [DOI] [PubMed] [Google Scholar]
- 8. Deng K, Yang L, Hu B, Wu H, Zhu H, Tang C. The prognostic significance of pretreatment serum CEA levels in gastric cancer: a meta‐analysis including14651 patients. PLoS One. 2015;10:e124151. [DOI] [PMC free article] [PubMed] [Google Scholar]
- 9. Jiang Z, Zhang C, Gan L, et al. iTRAQ‐based quantitative proteomics approach identifies novel diagnostic biomarkers that were essential for glutamine metabolism and redox homeostasis for gastric cancer. Proteomics Clin Appl. 2019;13:e1800038. [DOI] [PubMed] [Google Scholar]
- 10. Jiang Z, Shen H, Tang B, Yu Q, Ji X, Wang L. Quantitative proteomic analysis reveals that proteins required for fatty acid metabolism may serve as diagnostic markers for gastric cancer. Clin Chim Acta. 2017;464:148‐154. [DOI] [PubMed] [Google Scholar]
- 11. Ohba S, Johannessen TA, Chatla K, Yang X, Pieper RO, Mukherjee J. Phosphoglycerate mutase 1 activates DNA damage repair via regulation of WIP1 activity. Cell Rep. 2020;31:107518. [DOI] [PubMed] [Google Scholar]
- 12. Sun Q, Li S, Wang Y, et al. Phosphoglyceric acid mutase‐1 contributes to oncogenic mTOR‐mediated tumor growth and confers non‐small cell lung cancer patients with poor prognosis. Cell Death Differ. 2018;25:1160‐1173. [DOI] [PMC free article] [PubMed] [Google Scholar]
- 13. Shen Y, Zhao S, Wang S, et al. S1P/S1PR3 axis promotes aerobic glycolysis by YAP/c‐MYC/PGAM1 axis in osteosarcoma. EBioMedicine. 2019;40:210‐223. [DOI] [PMC free article] [PubMed] [Google Scholar]
- 14. Jiang X, Sun Q, Li H, Li K, Ren X. The role of phosphoglycerate mutase 1 in tumor aerobic glycolysis and its potential therapeutic implications. Int J Cancer. 2014;135:1991‐1996. [DOI] [PubMed] [Google Scholar]
- 15. Du D, Liu C, Qin M, et al. Metabolic dysregulation and emerging therapeutical targets for hepatocellular carcinoma. Acta Pharm Sin B. 2022;12:558‐580. [DOI] [PMC free article] [PubMed] [Google Scholar]
- 16. Liu X, Weng Y, Liu P, et al. Identification of PGAM1 as a putative therapeutic target for pancreatic ductal adenocarcinoma metastasis using quantitative proteomics. Onco Targets Ther. 2018;11:3345‐3357. [DOI] [PMC free article] [PubMed] [Google Scholar]
- 17. Li N, Liu X. Phosphoglycerate mutase 1: its glycolytic and non‐glycolytic roles in tumor malignant behaviors and potential therapeutic significance. Onco Targets Ther. 2020;13:1787‐1795. [DOI] [PMC free article] [PubMed] [Google Scholar]
- 18. Peng XC, Gong FM, Chen Y, et al. Proteomics identification of PGAM1 as a potential therapeutic target for urothelial bladder cancer. J Proteomics. 2016;132:85‐92. [DOI] [PubMed] [Google Scholar]
- 19. Xu Z, Gong J, Wang C, et al. The diagnostic value and functional roles of phosphoglycerate mutase 1 in glioma. Oncol Rep. 2016;36:2236‐2244. [DOI] [PubMed] [Google Scholar]
- 20. Li C, Shu F, Lei B, Lv D, Zhang S, Mao X. Expression of PGAM1 in renal clear cell carcinoma and its clinical significance. Int J Clin Exp Pathol. 2015;8:9410‐9415. [PMC free article] [PubMed] [Google Scholar]
- 21. Cheung EC, Vousden KH. The role of p53 in glucose metabolism. Curr Opin Cell Biol. 2010;22:186‐191. [DOI] [PubMed] [Google Scholar]
- 22. Kondoh H, Lleonart ME, Gil J, et al. Glycolytic enzymes can modulate cellular life span. Cancer Res. 2005;65(1):177‐185. [PubMed] [Google Scholar]
- 23. Li F, Yang H, Kong T, et al. PGAM1, regulated by miR‐3614‐5p, functions as an oncogene by activating transforming growth factor‐β (TGF‐β) signaling in the progression of non‐small cell lung carcinoma. Cell Death Dis. 2020;11:710. [DOI] [PMC free article] [PubMed] [Google Scholar]
- 24. Huang K, Jiang L, Liang R, et al. Synthesis and biological evaluation of anthraquinone derivatives as allosteric phosphoglycerate mutase 1 inhibitors for cancer treatment. Eur J Med Chem. 2019;168:45‐57. [DOI] [PubMed] [Google Scholar]
- 25. Wang P, Jiang L, Cao Y, et al. Xanthone derivatives as phosphoglycerate mutase 1 inhibitors: design, synthesis, and biological evaluation. Bioorg Med Chem. 2018;26:1961‐1970. [DOI] [PubMed] [Google Scholar]
- 26. Wen CL, Huang K, Jiang LL, et al. An allosteric PGAM1 inhibitor effectively suppresses pancreatic ductal adenocarcinoma. Proc Natl Acad Sci U S A. 2019;116:23264‐23273. [DOI] [PMC free article] [PubMed] [Google Scholar]
- 27. Huang K, Liang Q, Zhou Y, et al. A novel allosteric inhibitor of phosphoglycerate mutase 1 suppresses growth and metastasis of non‐small‐cell lung cancer. Cell Metab. 2019;30:1107‐1119. [DOI] [PubMed] [Google Scholar]
- 28. Wang Y, Guo Y, Qiang S, et al. 3D‐QSAR, molecular docking, and md simulations of anthraquinone derivatives as PGAM1 inhibitors. Front Pharmacol. 2021;12:764351. [DOI] [PMC free article] [PubMed] [Google Scholar]
- 29. Kanwal N, Rasul A, Shah MA, Jabeen F, Sultana T. In silico‐based identification of phytochemicals as novel human phosphoglycerate mutase 1 (PGAM1) inhibitors for cancer therapy. Pak J Pharm Sci. 2021;34:665‐670. [PubMed] [Google Scholar]
- 30. Fareed MM, El‐Esawi MA, El‐Ballat EM, et al. In Silico drug screening analysis against the overexpression of PGAM1 gene in different cancer treatments. Biomed Res Int. 2021;2021:5515692‐5515697. [DOI] [PMC free article] [PubMed] [Google Scholar]
- 31. Wen YA, Zhou BW, Lv DJ, et al. Phosphoglycerate mutase 1 knockdown inhibits prostate cancer cell growth, migration, and invasion. Asian J Androl. 2018;20:178‐183. [DOI] [PMC free article] [PubMed] [Google Scholar]
- 32. Toriyama K, Kuwahara M, Kondoh H, et al. T cell‐specific deletion of Pgam1 reveals a critical role for glycolysis in T cell responses. Commun Biol. 2020;3:394. [DOI] [PMC free article] [PubMed] [Google Scholar]
- 33. Liu X, Tan X, Liu P, Wu Y, Qian S, Zhang X. Phosphoglycerate mutase 1 (PGAM1) promotes pancreatic ductal adenocarcinoma (PDAC) metastasis by acting as a novel downstream target of the PI3K/Akt/mTOR pathway. Oncol Res. 2018;26:1123‐1131. [DOI] [PMC free article] [PubMed] [Google Scholar]
Associated Data
This section collects any data citations, data availability statements, or supplementary materials included in this article.
Data Availability Statement
The dataset (GSE84437) of this study is available on GEO database (https://www.ncbi.nlm.nih.gov/geo/query/acc.cgi?acc=GSE84437). Other data are available from the corresponding author upon reasonable request.