Abstract
Background
Acute kidney injury is a common clinical problem with no sensitive and specific diagnostic biomarkers and definitive treatments. The underlying molecular mechanisms of acute kidney injury are unclear. Therefore, it is pivotal to explore the underlying mechanisms and screen for novel diagnostic biomarkers, and therapeutic targets.
Methods
The present study identified 15 hub genes by WGCNA analysis. LASSO‐based logistic regression analysis was used to select key features and construct a diagnostic model of AKI. In addition, GO and KEGG analyses were performed and TF‐mRNA and miRNA‐mRNA network analysis and immune infiltration analysis of hub genes were performed to reveal the underlying mechanisms of AKI.
Results
A diagnostic model was constructed by LASSO‐based logistic regression analysis and was validated by RT‐qPCR based on 15 hub genes. GO and KEGG analyses revealed DEGs were enriched in oxidation–reduction process, cell adhesion, proliferation, migration, and metabolic process. The enriched TFs were BRD2, EP300, ETS1, MYC, SPI1, and ZNF263. The enriched miRNAs were miR‐181c‐5p, miR‐218‐5p, miR‐485‐5p, miR‐532‐5p and miR‐6884‐5p. The immune infiltration analysis showed that Macrophages M2 was decreasing significantly revealing a protective factor for further AKI treatment.
Conclusions
The present study identified 15 hub genes based on WGCNA. Development and validation of a potentially diagnostic model based on 15 hub genes. In addition, exploring the interaction between transcriptional factors and 15 hub genes, and miRNA‐mRNA relationship pairs. Furthermore, immune infiltration analysis was performed by analyzing gene expression profiles of AKI. Our study provides some basis for further experimental studies.
Keywords: acute kidney injury, diagnosis, GEO, immune infiltration, LASSO, miRNA, transcriptional factors, WGCNA
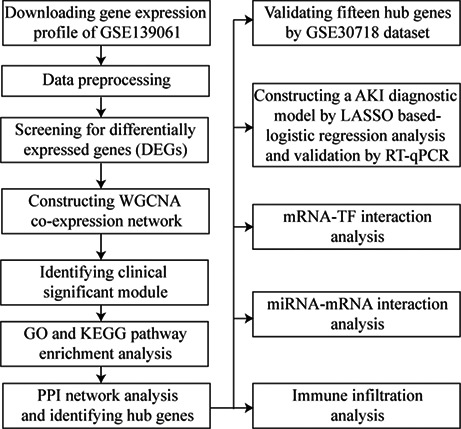
The present study identified 15 hub genes by WGCNA analysis. LASSO‐based logistic regression analysis was used to select key features and construct a diagnostic model of AKI. Then, five biomarkers‐based AKI diagnostic model was validated by RT‐qPCR. In addition, GO and KEGG analyses were performed and TF‐mRNA and miRNA‐mRNA network analysis and immune infiltration analysis of hub genes were performed to reveal the underlying mechanisms of AKI.
Abbreviations
- AKI
acute kidney injury
- BP
biological process
- BP
biological process
- CKD
chronic kidney disease
- CC
cellular component
- CKD
chronic kidney disease
- CC
cellular component
- DEG
differentially expressed gene
- GO
Gene Ontology
- GS
gene significance
- ICU
intensive care unit
- KDIGO
Kidney Disease Improving Global Outcomes
- KEGG
Kyoto Encyclopedia of Genes and Genomes
- LASSO
least absolute shrinkage and selection operator
- ME
module eigengene
- MF
molecular function
- PPI
protein–protein interaction
- ROC
receiver operating characteristic
- TOM
topological overlap measure
- TF
transcriptional factor
- WGCNA
weighted genes co‐expression network analysis
1. INTRODUCTION
Acute kidney injury is a common clinical syndrome of acute deterioration or even loss of kidney function due to different causes such as sepsis, cardiac surgery, trauma, contrast medium, and nephrotoxic drug. It is a vital complication in patients admitted to hospital where the morbidity is almost 10%–15% of all hospitalizations and in patients in the ICU where the prevalence can sometimes be more than 50%. 1 , 2 AKI can progress to chronic kidney disease easily and rapidly without effective clinical treatment. AKI has the characteristics of high morbidity and mortality and there is no effective treatment strategy. 3 AKI will bring high medical expenses if renal dialysis or renal transplant is performed. These issues have contributed AKI to a major public health problem worldwide. 4 Thus, the early, sensitive, and rapid diagnosis of AKI is an important part of the overall management of patients with the various syndromes, which cause or are associated with AKI. However, serum creatinine and urinary output are the cornerstone of our current diagnostic approach, which is neither sensitive nor specific for AKI. Therefore, it is urgent and imperative to develop novel and valid biomarkers for diagnosing AKI early. 5 , 6
Thanks to the development of technologies in microarray and high‐throughput sequencing, an increasing number of biomarkers and therapeutic targets have been discovered and applied in clinical practice. Zhang et al. 7 reported a novel plasma biomarker‐based model for predicting acute kidney injury after cardiac surgery by bioinformatics analysis; however, the predictive performance needed to be improved. Tang et al. 8 reported seven genes were associated with involvement in the occurrence and development of sepsis‐related AKI by bioinformatics analysis. Sreenivasulu et al. 9 identified a novel therapeutic target Adra1b for contrast‐induced acute kidney injury through bioinformatics methods and animal experiments. However, reports about AKI in critically ill patients were rare, it was very vital to explore novel and useful diagnostic biomarkers in transcriptome level. Therefore, we planned to mine key biomarkers by bioinformatics methods in tissue samples from GEO database and validate in clinical samples from critically ill patients, in order to provide significantly diagnostic biomarkers for AKI in critically ill patients. Bioinformatics methods are very important and useful approaches to explore the novel biomarkers and therapeutic targets of AKI and would provide a new horizon for understanding diseases. In this study, we hope to explore crucial indicators for early diagnosing AKI and useful therapeutic targets, which could provide some basis for further experimental studies.
2. MATERIALS AND METHODS
2.1. Preparation of gene expression profile data
The workflow of this present study is shown in Figure S1. The gene expression profile data were obtained from the GEO database (https://www.ncbi.nlm.nih.gov/geo/). GSE139061 (https://www.ncbi.nlm.nih.gov/geo/query/acc.cgi?acc=GSE139061) was gene expression profile dataset based on the platform of GPL20301 (Illumina HiSeq 4000), which contained 39 native human renal biopsy samples and nine reference nephrectomies. GSE30718 (https://www.ncbi.nlm. nih.gov/geo/query/acc.cgi?acc=GSE30718) was gene expression profile dataset based on the platform of GPL570 (Affymetrix Human Genome U133 plus 2.0 Array), which contained 28 native human renal biopsy samples and 11 reference nephrectomies. The two gene expression datasets were downloaded from the database, which was calculated as fragments per kilobase of transcript per million mapped reads. Data standardization was performed by using the multi‐array average algorithm in the affy package in Bioconductor (https://www.bioconductor.org) in R 3.6.2 (https://cran.rstudio.com/). GSE139061 was regarded as training set and GSE30718 was regarded as validating set for further analysis.
2.2. Identification of differentially expressed genes (DEGs)
Limma R package (Version: 3.42.2) was used to screen the differentially expressed genes between AKI cohort and non‐AKI cohort with R 3.6.2 (https://cran.rstudio.com/). Log(2) (|FoldChange|) higher than 1 and adjusted p value < 0.05 were regarded as screening criteria of DEGs. A hierarchical cluster heatmap based on Euclidean distance was generated using the pheatmap R package (Version: 1.0.12) and represented the gene expression intensity and direction of differentially expressed genes. A volcano plot displayed the distribution of DEGs, which log(2) (|FoldChange|) was calculated and shown in the horizontal axis, −log(10) (p‐value) was calculated and shown in the longitudinal axis.
2.3. Construction of Weighted Gene Co‐expression Network Analysis (WGCNA)
WGCNA is a systems biology method for constructing scale‐free networks using gene expression profile data. Total analyses were performed using the R package WGCNA (Version: 1.68) in R 3.6.2 (https://cran.rstudio.com/). Firstly, the similarity matrix of expression profile was constructed by calculating the Pearson's correlation coefficient between two different genes. Then, the similarity matrix of gene expression was converted into the adjacency matrix and scale‐free network was assigned that the optimal soft threshold was β = 4. The crucial function of this step was strengthening strong correlation and weakening weak correlation at the gene expression level. Next, the adjacency matrix was transformed into the topological matrix (TOM). TOM was used to evaluate the degree of association between genes and (1‐TOM) was used for hierarchical clustering of genes. The dynamic tree cut algorithm was used to recognize and classify different modules and find the most representative gene in each module, which was called module eigengene (ME). The ME represented the first principal component of each module, which also meant the overall level of gene expression in this module. The minimum number of genes were 20 in each module, the correlation threshold of hub genes was 0.90 and the unsigned network edge threshold was 0.05. Clinically significant modules were identified by calculating the correlation between ME and clinical trait, and the degree of connection was measured. Gene significance (GS) was used to evaluate this degree and a higher GS indicated the increased significance of genes. 10 , 11 , 12
2.4. Gene Ontology (GO) and Kyoto Encyclopedia of Genes and Genomes (KEGG) pathways enrichment analysis
GO and KEGG pathway enrichment analyses were performed using an online database by DAVID 6.8 (https://david.ncifcrf.gov/). GO and KEGG pathway enrichment analysis was used to identify potential biological mechanism of genes. GO is involved in three categories: biological process (BP), cellular component (CC), and molecular function (MF). The potential biological features and pathways of differentially expressed genes were further explored and the significance threshold was p‐value < 0.05. The critical module, which was mostly associated with the development of AKI was selected as the most representative module and the genes in this module were visualized with Cytoscape 3.5.1 (https://cytoscape.org/).
2.5. Construction of Protein–Protein Interaction (PPI) network
The STRING 11.5 (https://string‐db.org/) was used to construct protein–protein interaction network. This online database provides a system‐wide understanding of cellular function requires knowledge of all function interactions between the expressed proteins. The associations among genes in target module were obtained by STRING database and were visualized with Cytoscape 3.5.1 (https://cytoscape.org/). The CytoHubba package provides a user‐friendly interface to explore hub nodes in biological networks and revealed the association degree among genes by transforming color from dark to light in target module.
2.6. Identification and validation of hub genes
The correlation of genes was calculated using absolute Pearson's correlation values by the Cor R package in R 3.6.2 (https://cran.rstudio.com/). Genes that had high correlation with a module, which meant the absolute of Pearson's correlation values was more than 0.9 was regarded as hub genes. In addition, the GSE30718 dataset downloaded from GEO database (https://www.ncbi.nlm.nih.gov/geo/) was used to validate the hub genes.
2.7. AKI diagnostic model by LASSO‐based logistic regression
The critical module, which was the most related to the development of AKI was selected as the most representative module and hub genes were selected in this module by bioinformatics methods of WGCNA. LASSO‐based logistic regression analysis was applied to select the key features based on hub genes and construct an optimal diagnostic model for AKI. The risk score of each sample was calculated using this formula: Risk Score = ∑ exp (genei*β i ).
2.8. Sample collection and detection by Real‐Time Quantitative PCR (RT‐qPCR)
Venous blood samples were uniformly collected from all participants into EDTA (Ethylene Diamine Tetraacetic Acid) anticoagulation tubes when patients were first diagnosed AKI in ICU. AKI was defined according to KDIGO guidelines as renal function was suddenly decreased within 48 h and serum creatinine increased at least 0.3 mg/dl, or serum creatinine increased more than 1.5 times higher than baseline within 7 days, or urine volume < 0.5 ml/Kg/h for 6 h. The density gradient centrifugation by Ficoll–Hypaque (Sigma Chemical Co) was applied for peripheral blood mononuclear cells (PBMCs) separation from the blood of AKI and control patients. RNA was isolated from PBMCs obtained from the patients using Trizol (Invitrogen, Carlsbad) and reverse transcribed using the RevertAid First Strand cDNA Synthesis Kit (Thermo Fisher Scientific). The RT‐qPCR analysis was performed using AceQ Universal SYBR qPCR Master Mix (Vazyme), Primers, and the C1000 Touch™ thermal cycler (Bio‐Rad, Hercules). The data were normalized to GAPDH levels within each sample and analyzed using the C t method. Primer sequences are listed as follows: RANGAP1: forward 5′‐GAGTGTAGTGGAACGATCAC‐3′, reverse 5′‐CGGGAAGATCACTTTAGACC‐3′; UBTF: forward 5′‐GGCCATTGGTCCAACAAAGAC‐3′, reverse 5′‐AGTCCATGTG TGACTGAGTTGA‐3′; SYNE1: forward 5′‐ACCTCCAATGGT GGTG GAC‐3′, reverse 5′‐CGTGCCAATG TTAGCCACA‐3′; BAZ1A: forward 5′‐CTGCTAC ACCGAAAGCCGTT‐3′, reverse 5′‐GCACAGAA TGGTTCGTT CAAAAA‐3′; COL1A1: forward 5′‐GAGGGCCAAGAC GAAGACATC‐3′, reverse 5′‐CAGATCACGTCA TCG CACA AC‐3′.
2.9. TF‐mRNA and miRNA‐mRNA network analysis
Transcription factors (TFs) as crucial regulators can modulate the expression of target genes by binding to specific DNA sequences of their promoters or enhancers. 13 hTFtarget (https://bioinfo.life.hust.edu.cn/hTFtarget#!/) online database provides an opportunity for understanding comprehensively TF‐target regulations from large‐scale ChIP‐seq data of human TFs. The identification of TF‐target relationship was a basis for making out the molecular regulatory mechanisms underlying biological processes containing the development and pathogenesis. TargetScan 7.1 (https://www.targetscan.org/vert_71/) and ENCORI (https://www.starbase.sysu.edu.cn) are online databases integrate biological targets of miRNAs by searching for the presence of conserved sites, which matches the seed region of each miRNA. The associations between miRNAs and mRNAs were demonstrated to be related to the molecular regulatory mechanisms and pathogenesis and exploring this regulation would be beneficial for mining novel therapeutic targets of AKI.
2.10. Immune infiltration analysis of hub genes
In order to explore the differences in immune cell subtypes, CIBERSORT R package (Version: 1.04) was used to evaluate the proportions of 22 immune cell subtypes based on gene expression profile. The analysis results were used for further analysis. In addition, we compared differences in immune cell subtypes between AKI cohort and non‐AKI cohort by the Mann–Whitney U‐test.
2.11. Statistical analysis
All statistical analyzes were carried out by R 3.6.2 (https://cran.rstudio.com/)and corresponding packages. Statistical significance was set at a probability value of p < 0.05. Significant differences were calculated by one‐way ANOVA with Dunnett's or Newman–keuls test, or by two‐tailed Student's t test or Mann–Whitney U test.
3. RESULTS
3.1. Identification of DEGs in AKI
The DEGs in 39 AKI samples compared with nine non‐AKI samples were analyzed by limma R package (Version:3.42.2) in R 3.6.2 (https://cran.rstudio.com/). There were 20,139 genes were analyzed and 2202 DEGs were obtained, of which 572 DEGs were upregulated significantly and 1630 DEGs were downregulated significantly. The screening criteria for DEGs were log(2) (|FoldChange|) > 1 and the adjusted p value < 0.05. Hierarchical clustering was used to cluster samples and genes according to different gene expression values of genes in various samples and the expression profile of DEGs was visualized using a heat map (Figure S2A). A volcano plot displayed the distribution of DEGs, which log(2) (|FoldChange|) was calculated and shown in the horizontal axis, −log(10) (p‐value) was calculated and shown in the longitudinal axis (Figure S2B). The most significant upregulated 10 genes were visualized in Table S1 and the most significant downregulated 10 genes were shown in Table S2.
3.2. Construction of WGCNA and identification of clinical crucial module
Cluster analysis was carried out on the samples of GSE139061 using average linkage and Pearson's correlation, and the co‐expression network was constructed by co‐expression analysis. The soft threshold β = 4 was identified to ensure a scale‐free network for further analysis (Figure 1A). A total of 7 modules were identified by the average linkage hierarchical clustering, calculating with MEs and combing adjacent modules with the same module and set the height as 0.25 (Figure 1B). Pearson's correlation coefficients among modules were calculated and the associations between modules and inner genes were evaluated (Figure 1C). The brown module (R = 0.75, p = 0.00009) was selected as the target module for the optimal association with the development of AKI from the correlation with clinical trait and the suitable number of genes (Figure 1D).
FIGURE 1.
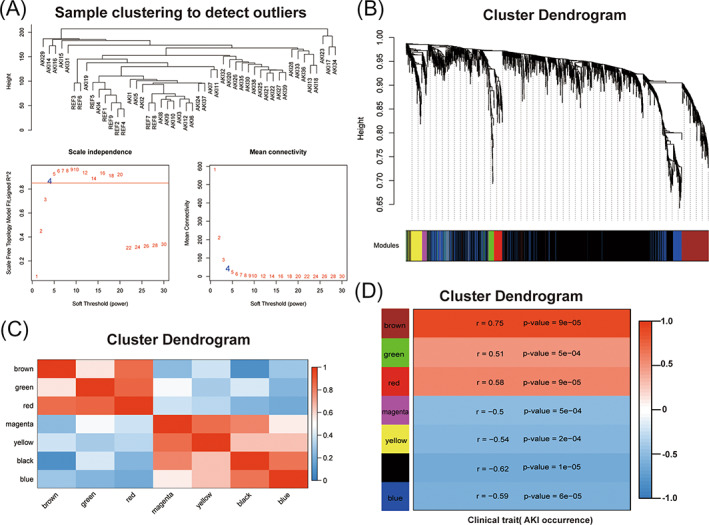
WGCNA analysis of differentially expressed genes. (A) Cluster dendrogram of 48 kidney tissue samples, which contain 39 AKI samples and nine non‐AKI samples, and determination of the soft threshold (β = 4) of weighted co‐expression network; (B) Cluster dendrogram of differentially expressed genes to identify the clinically significant modules associated with the development of AKI; (C) Heatmap of the correlations among different modules; (D) Heatmap of the correlations between module eigengenes and clinical traits of AKI
3.3. GO and KEGG pathway enrichment analysis
The genes in the crucial clinically significant module were categorized into three function groups, including BP, CC, and MF. BP analysis revealed that genes in brown module were mainly involved in oxidation–reduction process, positive regulation of GTPase activity, cell adhesion, transport, response to drug, multiple metabolic processes, and positive regulation of cell migration (Figure 2A). CC analysis showed that genes in brown module were mainly involved in integral component of membrane, plasma membrane, extracellular exosome, and mitochondrion (Figure 2B). MF analysis displayed that genes in brown module were mainly involved in zinc ion binding, protein homodimerization activity, ligase activity, GTPase activator activity, catalytic activity, and hydrolase activity (Figure 2C). KEGG pathway enrichment analysis uncovered that genes in brown module were mainly involved in metabolic pathways, biosynthesis of antibiotics, Rap1 signaling pathway, carbon metabolism, protein digestion and absorption, drug metabolism, chemical carcinogenesis, and retinol metabolism (Figure 2D).
FIGURE 2.
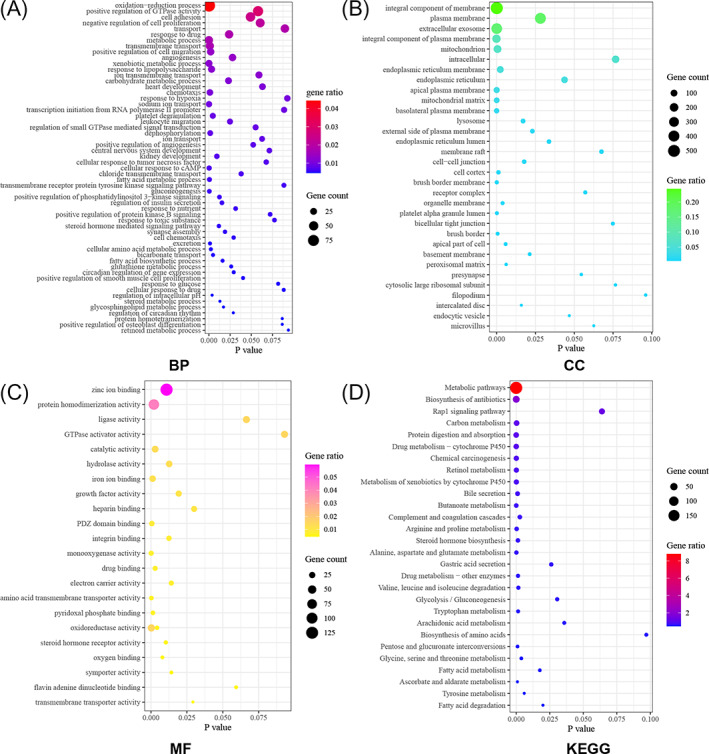
GO and KEGG pathway enrichment analysis of DEGs in DAVID 6.8 database. (A) Biological Process; (B) Cellular Component; (C) Molecular Function; (D) Kyoto Encyclopedia of Genes and Genome pathways
3.4. PPI network analysis of the key module
The PPI network of the genes in brown module was constructed by STRING database version 11.5 (https://cytoscape.org/) and visualized by Cytoscape 3.5.1 (https://cytoscape.org/) (Figure 3). There were 203 genes in brown module and 15 genes were identified as hub genes including KMT2B, NOC2L, COL1A1, BAZ1A, PABPN1, HNRNPD, H6PD, SYNE1, DST, RANGAP1, DEK, MACF1, CHD3, CXXC1, and UBTF. The high degree genes calculated by the CytoHubba plugin were located in the center of the circle network and the dark color represented the high degree of genes. The expression levels of 15 hub genes between AKI and non‐AKI cohort were shown in Figure S3.
FIGURE 3.
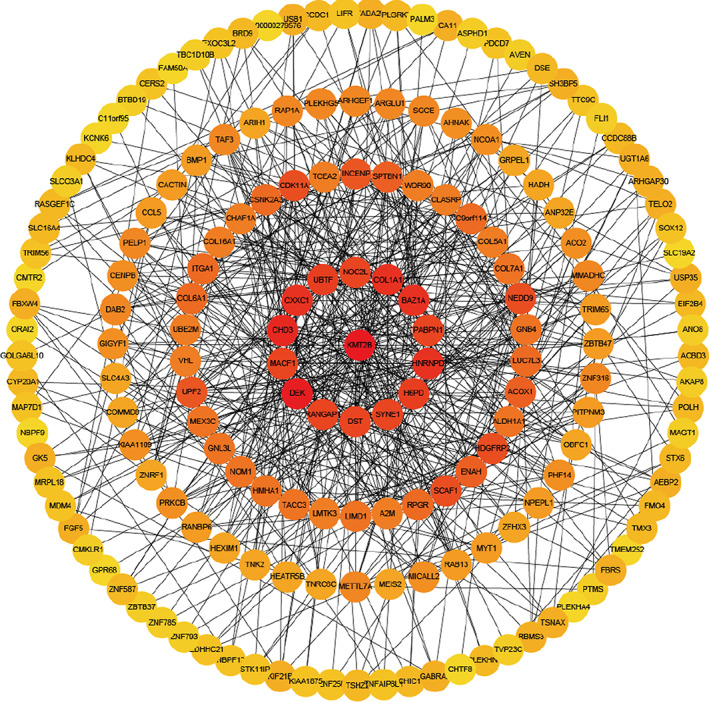
PPI network analysis of DEGs to identify 15 hub genes (KMT2B, NOC2L, COL1A1, BAZ1A, PABPN1, HNRNPD, H6PD, SYNE1, DST, RANGAP1, DEK, MACF1, CHD3, CXXC1, and UBTF) of brown module. The high‐degree genes calculated by the CytoHubba plugin in Cytosacpe 3.5.1 were located in the center of the circle network and the dark color represented the high degree of genes.
3.5. Validation of hub genes and construction of AKI diagnostic model
The expression of 15 hub genes was validated by GSE30718 in GEO database. RNA‐sequencing expression levels of KMT2B, NOC2L, COL1A1, BAZ1A, PABPN1, HNRNPD, H6PD, RANGAP1, DEK, CHD3, CXXC1, and UBTF were significantly increased in AKI cohort compared with non‐AKI cohort. RNA‐sequencing expression levels of DST, MACF1, and SYNE1 were significantly decreased in AKI cohort compared with non‐AKI cohort (Figure S4). The validated results were consistent with the training dataset of GSE139061. To construct AKI related gene diagnostic model, LASSO regression was used to select crucial genes based on 15 hub genes. Then, five crucial genes were selected to perform binary logistic regression analysis (Figure 4A,B). Finally, a diagnostic model containing five genes (RANGAP1, UBTF, SYNE1, BAZ1A, and COL1A1) was established to assess the diagnostic efficiency of each patients as follows: Risk Score = 0.0391* RANGAP1 + 0.5509* UBTF + (−0.4938)* SYNE1 + 0.5081* BAZ1A + 0.0363* COL1A1. In addition, ROC curve analysis was performed to assess the diagnostic power of single gene and this model, which was consisted of five genes. The area under the ROC curve of RANGAP1 was 0.90, 95% confidence interval was 0.80–0.99, p < 0.05. The area under the ROC curve of UBTF was 0.91, 95% confidence interval was 0.83–0.99, p < 0.05. The area under the ROC curve of SYNE1 was 0.87, 95% confidence interval was 0.76–0.98, p < 0.05. The area under the ROC curve of BAZ1A was 0.85, 95% confidence interval was 0.75–0.96, p < 0.05. The area under the ROC curve of COL1A1 was 0.77, 95% confidence interval was 0.58–0.96, p < 0.05. The area under the ROC curve of combination model was 0.99, 95% confidence interval was 0.98–1.01, p < 0.05 (Figure 4C). The combined model of AKI exhibited excellently diagnostic efficiency, which had broad clinical application prospect.
FIGURE 4.

Construction of AKI diagnostic model by LASSO‐based logistic regression analysis. (A, B) Screening and constructing a diagnostic model based on 15 hub genes by LASSO‐based logistic regression; (C), ROC curve analysis for evaluating the diagnostic efficiency of single gene and the combined model
3.6. Validation of the five biomarkers‐based diagnostic model of AKI by RT‐qPCR
We further validated these five biomarkers (UBTF, SYNE1, RANGAP1, BAZ1A, and COL1A1) in plasma samples by RT‐qPCR. There were 35 patients in ICU were enrolled and 15 patients were diagnosed AKI as AKI cohort and 20 patients were not diagnosed with AKI as control cohort. As shown in Figure 5, the levels of five biomarkers in AKI and non‐AKI cohort were consistent with other two dataset (GSE139061 and GSE30718). The ROC curve analysis was performed to validate the diagnostic performance for AKI. The results revealed that these five biomarkers exhibited excellent diagnostic performance for AKI, respectively. Furthermore, the combined model exhibited optimal potential for diagnosing AKI and the AUC of the model was 0.97 (95%CI: 0.88–1.06).
FIGURE 5.
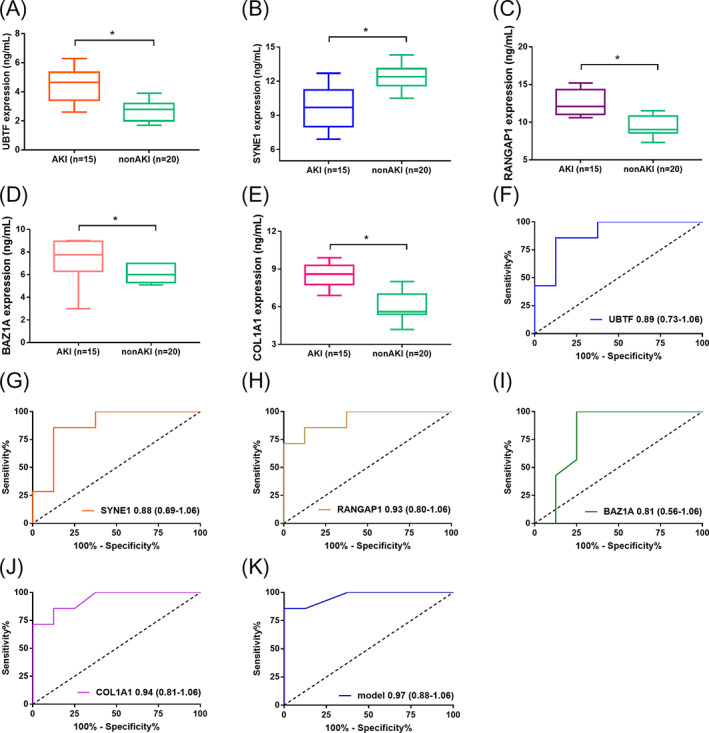
Boxplots showing the plasma level of five biomarkers in AKI diagnostic model using RT‐qPCR. The levels of UBTF, RANGAP1, BAZ1A, and COL1A1 were significantly increased in AKI cohort compared with non‐AKI cohort. The level of SYNE1 was significantly decreased in AKI cohort compared with non‐AKI cohort (A) UBTF; (B) SYNE1; (C) RANGAP1; (D) BAZ1A; (E) COL1A1; (B) ROC curve analysis of five biomarkers in AKI model for diagnosing AKI; (F) UBTF; (G) SYNE1; (H) RANGAP1; (I) BAZ1A; (J) COL1A1; (K) the combined model of five biomarkers by logistic regression analysis
3.7. TF‐mRNA and miRNA‐mRNA network analysis
Using hTFtarget database, we explored the TF‐mRNA interaction in AKI. As presented in Table S3, the 15 hub genes were used to screen corresponding transcription factors, and each hub gene may be transcriptionally regulated by multiple transcription factors, which were combined with transcription factor binding sites in upstream promoter regions. The interaction network was constructed between 15 hub genes and target TFs by Cytoscape 3.5.1 (Figure 6A). Bromodomain‐containing protein 2 (BRD2), Histone acetyltransferase p300 (EP300), Protein C‐ets 1 (ETS1), Myc proto‐oncogene protein (MYC), Transcription factor PU.1 (SPI1) and Zinc finger protein 263 (ZNF263) were significantly enriched transcription factors for the 15 hub genes. Furthermore, we explored the miRNA‐mRNA interaction in AKI using TargetScan 7.1 and ENCORI databases. As presented in Table S4, the predicted target miRNAs were analyzed and each miRNA was combined with 3' UTRs of target mRNA. Each mRNA is corresponding to multiple target miRNAs. The interaction network was established between 15 hub genes and target miRNAs by Cytoscape 3.5.1 (Figure 6B). It was identified that miR‐181c‐5p, miR‐218‐5p, miR‐485‐5p, miR‐532‐5p, and miR‐6884‐5p were significantly enriched target miRNAs for the 15 hub genes.
FIGURE 6.
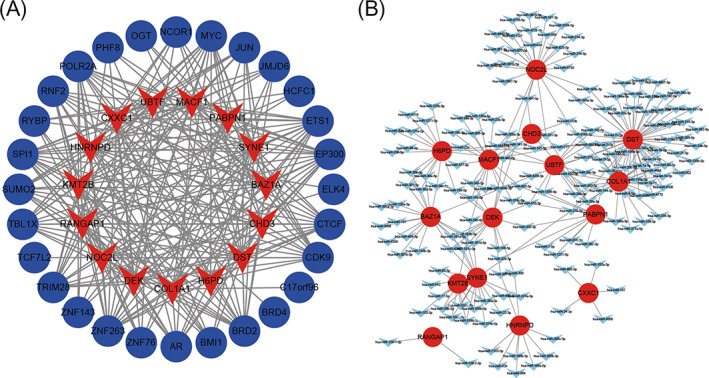
Interaction network between 15 hub genes and target transcriptional factors. (A) the red nodes represent 15 hub genes and the blue nodes represent target transcriptional factors; (B) the interaction network between 15 hub genes and target miRNAs. The red nodes represent 15 hub genes and the blue nodes represent target miRNAs.
3.8. Immune cell subtypes analysis between AKI and non‐AKI cohort
The 22 immune cell proportions of AKI were shown in Figure 7A. T‐cell CD4 naïve, T‐cell CD4 memory resting, NK cell resting, Monocytes accounted for a large proportions of AKI immune cell infiltration. AKI and non‐AKI cohort displayed different immune cells expression. The expression of Monocytes and Macrophages M0 in AKI cohort was increasing significantly compared with non‐AKI cohort. The expression of Macrophages M2 in AKI cohort was decreasing significantly compared with non‐AKI cohort (Figure 7B).
FIGURE 7.
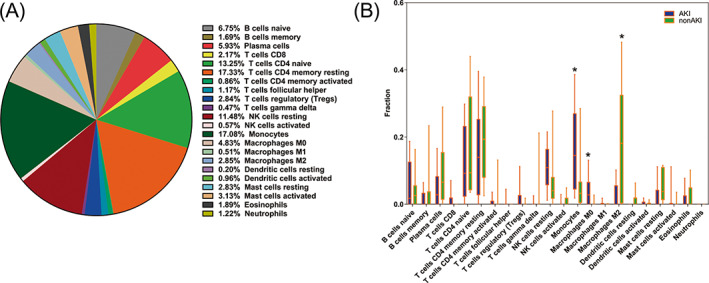
Immune infiltration analysis between AKI cohort and non‐AKI cohort. (A) The proportion of 22 immune cells in AKI. T‐cell CD4 naïve, T‐cell CD4 memory resting, NK cell resting, Monocytes accounted for a large proportions of AKI immune cell infiltration; (B) AKI and non‐AKI cohort displayed different immune cells expression. The blue color represents AKI cohort and the green color represents non‐AKI cohort. Different immune cell type expression was observed between AKI and non‐AKI cohort.
4. DISCUSSION
Acute kidney injury is a frequent complication in critically ill patients, increasing significantly both hospital mortality and morbidity. 14 The pathophysiology of AKI shares common pathogenic denominators including cell death, cell injury, inflammation, and fibrosis, regardless of the initiating insults. 15 At present, owing to the lack of sensitive and specific means of AKI prevention and therapy, it is crucial to explore the diagnostic biomarkers, novel therapeutic targets, and potential pathophysiological mechanism in AKI.
With adjusted p value < 0.05 and log(2) (|Foldchange|) > 1 as the cutoff, 2202 DEGs (572 upregulated and 1630 downregulated genes) were identified, which had potential to be novel drivers and may play a role in the pathophysiological mechanism underlying AKI development. Fifteen hub genes (KMT2B, NOC2L, COL1A1, BAZ1A, PABPN1, HNRNPD, H6PD, SYNE1, DST, RANGAP1, DEK, MACF1, CHD3, CXXC1, and UBTF) of brown module were selected using comprehensive analytical method of WGCNA, which were further successfully validated using another dataset of GEO database. To further understand the molecular mechanism, GO and KEGG pathways enrichment analyses of the DEGs was performed. As for GO analysis, it was identified that DEGs were enriched in oxidation–reduction process, cell adhesion, proliferation, migration, metabolic process, mitochondria, iron ion binding, heparin‐binding, oxygen binding, and so on. As for KEGG pathways enrichment analysis, it was identified that DEGs were enriched in metabolic pathways, biosynthesis of antibiotics, Rap1 signaling pathways, carbon metabolism, drug metabolism, and so on. Recent studies had shown that the primary site of damage during AKI, proximal tubular epithelial cells, were highly metabolically active, relying on fatty acids to meet energy demands, which were rich in mitochondria and peroxisomes. The two organelles mediated fatty acid oxidation. 16 Mitochondria are cytoplasmic organelles with a double phospholipid membrane that generate energy via oxidative phosphorylation. 17 Mitochondria are also associated with calcium homeostasis, intracellular reactive oxygen species (ROS) generation, and cell signaling functions. 18 , 19 Mitochondrial fatty acid β‐oxidation serves as the preferred source of ATP in the kidney and its dysfunction results in ATP depletion and lipotoxicity to elicit tubular injury and inflammation and subsequent fibrosis progression. 20 The kidney is a highly metabolic organ with high levels of oxidation within cellular mitochondria. 21 Metabolic process includes glucose metabolism, lipid metabolism, drug metabolism, and so on which have been discovered in the enrichment analysis of genes in brown module. Lipid metabolism plays a basic role in renal physiology, especially in tubules. 22 Some studies have revealed the emerging association between increased metabolites and AKI pathogenesis and progression from different perspectives, which were consistent with our study. 23 , 24
The present study identified that 15 genes were significantly associated with AKI development as hub genes of brown module. The Mixed Lineage Leukemia 2 (MLL2) protein, also known as KMT2B, belongs to the family of mammalian histone H3 lysine 4 (H3K4) methyltransferases. 25 Moreover, KMT2B plays a key role in development, and germline deletions of MLL2 have been associated with early growth retardation, neural tube defects, and apoptosis that leads to embryonic death. The research has revealed that KMT2B acts as a chromatin modifier gene harbors mutations in Renal cell carcinomas through high‐throughput sequencing efforts. 26 However, to our knowledge, no experimental studies of KMT2B in acute kidney injury have been reported to date, which is worthy of further study. NOC2L, acts as an inhibitor of histone acetyltransferase activity, prevents acetylation of all core histones by the EP300/p300 histone acetyltransferase at p53/TP53‐regulated target promoters in a histone deacetylases‐independent manner with chronic kidney disease. 27 COL1A1, acts as type I collagen, is a member of group I collagen (fibrillary forming collagen). The mutations of COL1A1 can cause Osteogenesis imperfecta has been reported extensively. Recent research have revealed that COL1A1 is highly associated with chronic kidney disease, cardiovascular diseases and bone metabolism disorders. 28 Moreover, the experimental and theory studies of COL1A1 in acute kidney injury are required for further study. Heterogeneous nuclear ribonucleoprotein D (HNRNPD), has been shown to regulate gene expression at the translational and even the transcriptional level and regulate AU‐rich elements (ARE)‐mRNA turnover, primarily functioning to promote rapid ARE‐mRNA degradation and various kidney cells express multiple isoforms of HNRNPD. 29 H6PD is a steroid conversion and receptor gene, which plays a crucial role in steroid conversion and response in kidney transplantation. 30 The research on SYNE1 revealed that the essential roles in mediating sunitinib cytotoxicity and the loss of function rendered renal cell carcinoma cell resistant to sunitinib in vitro and in vivo. 31 The rest of the hub genes were demanded to move one step further uncovering the pathophysiologic mechanisms and biological principles of AKI. These hub genes will be potential biomarkers and therapeutic targets of acute kidney injury in the future.
The present study identified that BRD2, EP300, ETS1, MYC, SPI1, ZNF263 were significantly enriched transcriptional factors for 15 hub genes. BRD2 can specially bind acetylated histone H4 and mediate transcription, which belongs to the bromodomain and extraterminal domain (BET) family regulating the expression of many immunity‐associated genes and pathways. 32 EP300, a protein with an essential role in controlling cell growth, cell division and prompting cells to differentiate to take on specialized functions, can mediate epigenetic variation of kidney disease as a transcriptional factor. 33 , 34 ETS1 is a member of the ETS family and regulates the expression of a variety of genes including growth factors, chemokines, and adhesion molecules and plays a crucial role in the cell cycle progression of renal tubules in acute renal failure (ARF). The ETS1 pathway may regulate the transcription of cyclin D1 and control the regeneration of renal tubules in ARF. 35 MYC acts as a transcriptional factor becomes activated in resident kidney stromal cells early after kidney injury and can regulate metabolic switch in fibrosis initiation and progression. 36 Another study revealed MYC acts as a transcriptional factor participating in the positive feedback loop of MEG3/miR‐145‐5p/RTKN/Wnt/β‐catenin/c‐MYC to promote renal ischemia‐reperfusion injury by activating mitophagy and inducing apoptosis. 37 SPI1 can activate H19 which overexpression confers protection against renal injury by stimulating proangiogenic signaling in endothelial cells and tubular epithelial cells of ischemic kidney tissue. 38 ZNF263 acts as a transcriptional factor that can regulate a crucial enzyme involved in imparting anticoagulant activity to heparin and also can influence the gene expression of ZRANB2 in human kidney cells. 39 Our study demonstrated that miR‐181c‐5p, miR‐218‐5p, miR‐485‐5p, miR‐532‐5p, and miR‐6884‐5p were significantly enriched target miRNAs for 15 hub genes. miR‐181c‐5p is a member of miR‐181c family and plays a crucial role in regulating extracellular matrix proteins during AKI occurrence and progression. 40 miR‐218‐5p participates in regulating sepsis‐induced acute kidney injury by miR‐218‐5p/hemeoxygenase‐1 signaling pathway. 41 Wang et al. 42 reported that miR‐218‐5p expressed in endothelial progenitor cells contributes to the development and repair of the kidney microvasculature. CirC_0008529/miR‐485‐5p/WNT2B was a vital signaling axis to regulate high glucose‐induced renal cell apoptosis and inflammatory injury. 43 The research of miR‐532‐5p uncovered that LINC00052 ameliorates acute kidney injury by sponging miR‐532‐5p and activating the Wnt signaling pathway. 44 miR‐6884‐5p regulates the functions of proliferation, invasion, epithelial–mesenchymal transformation in tumors; however, there are rarely research to reveal the function and mechanism of kidney diseases. 45 Our study results revealed that the expression of Macrophages M2 in AKI cohort was decreasing significantly compared with non‐AKI cohort, which meant M2 macrophages were a protective factor for AKI development. The research showed that M2 macrophages can effectively alleviate acute kidney injury by decreasing inflammatory response and promoting primary proximal tubular epithelial cells proliferation, which was consistent with our findings. 46
In conclusion, our study has several strengths. The present study identified 15 hub genes in acute kidney injury using WGCNA and constructed a diagnostic model by LASSO‐based logistic regression and validated by RT‐qPCR in blood samples of AKI in critically ill patients. Furthermore, crucial pathways, Transcription factors, miRNAs, and 22 immune cell subtypes, which were associated with AKI were analyzed and provided some basis for future experimental studies. However, the study has also limitations. The pathogenic mechanism of AKI remains uncertain in our study, and it is vital to explore inner mechanism of AKI based on 15 hub genes and find out the optimal diagnostic and therapeutic targets, and that is the research direction for our study.
Supporting information
Figure S1
Figure S2
Figure S3
Figure S4
Tables S1–S4
Sun T, Cao Y, Huang T, Sang Y, Dai Y, Tao Z. Comprehensive analysis of fifteen hub genes to identify a promising diagnostic model, regulated networks, and immune cell infiltration in acute kidney injury. J Clin Lab Anal. 2022;36:e24709. doi: 10.1002/jcla.24709
Tao Sun is the first author.
DATA AVAILABILITY STATEMENT
The datasets used and/or analyzed during the current study are available from the corresponding author on reasonable request.
REFERENCES
- 1. Al‐Jaghbeer M, Dealmeida D, Bilderback A, Ambrosino R, Kellum JA. Clinical decision support for In‐Hospital AKI. J Am Soc Nephrol. 2018;29:654‐660. [DOI] [PMC free article] [PubMed] [Google Scholar]
- 2. Hoste EA, Bagshaw SM, Bellomo R, et al. Epidemiology of acute kidney injury in critically ill patients: the multinational AKI‐EPI study. Intensive Care Med. 2015;41:1411‐1423. [DOI] [PubMed] [Google Scholar]
- 3. Levey AS, James MT. Acute kidney injury. Ann Intern Med. 2017;167:ITC66‐Itc80. [DOI] [PubMed] [Google Scholar]
- 4. Chawla LS, Bellomo R, Bihorac A, et al. Acute kidney disease and renal recovery: consensus report of the Acute Disease Quality Initiative (ADQI) 16 workgroup. Nat Rev Nephrol. 2017;13:241‐257. [DOI] [PubMed] [Google Scholar]
- 5. Venkatachalam MA, Weinberg JM, Kriz W, Bidani AK. Failed tubule recovery, AKI‐CKD transition, and kidney disease progression. J Am Soc Nephrol. 2015;26:1765‐1776. [DOI] [PMC free article] [PubMed] [Google Scholar]
- 6. Chen Y, Lin L, Tao X, Song Y, Cui J, Wan J. The role of podocyte damage in the etiology of ischemia‐reperfusion acute kidney injury and post‐injury fibrosis. BMC Nephrol. 2019;20:106. [DOI] [PMC free article] [PubMed] [Google Scholar]
- 7. Zhang Y, Zhao H, Su Q, et al. Novel plasma biomarker‐based model for predicting acute kidney injury after cardiac surgery: a case control study. Front Med. 2021;8:799516. [DOI] [PMC free article] [PubMed] [Google Scholar]
- 8. Tang Y, Yang X, Shu H, et al. Bioinformatic analysis identifies potential biomarkers and therapeutic targets of septic‐shock‐associated acute kidney injury. Hereditas. 2021;158:13. [DOI] [PMC free article] [PubMed] [Google Scholar]
- 9. Kilari S, Sharma A, Zhao C, et al. Identification of novel therapeutic targets for contrast induced acute kidney injury (CI‐AKI): alpha blockers as a therapeutic strategy for CI‐AKI. Transl Res. 2021;235:32‐47. [DOI] [PMC free article] [PubMed] [Google Scholar]
- 10. Lin J, Yu M, Xu X, et al. Identification of biomarkers related to CD8(+) T cell infiltration with gene co‐expression network in clear cell renal cell carcinoma. Aging. 2020;12:3694‐3712. [DOI] [PMC free article] [PubMed] [Google Scholar]
- 11. Sun T, Wang D, Ping Y, et al. Integrated profiling identifies SLC5A6 and MFAP2 as novel diagnostic and prognostic biomarkers in gastric cancer patients. Int J Oncol. 2020;56:460‐469. [DOI] [PMC free article] [PubMed] [Google Scholar]
- 12. Lin X, Li J, Tan R, Zhong X, Yang J, Wang L. Identification of hub genes associated with the development of acute kidney injury by weighted gene co‐expression network analysis. Kidney Blood Press Res. 2021;46:63‐73. [DOI] [PubMed] [Google Scholar]
- 13. Zhang Q, Liu W, Zhang HM, et al. hTFtarget: a comprehensive database for regulations of human transcription factors and their targets. Genomics Proteomics Bioinformatics. 2020;18:120‐128. [DOI] [PMC free article] [PubMed] [Google Scholar]
- 14. Klein SJ, Brandtner AK, Lehner GF, et al. Biomarkers for prediction of renal replacement therapy in acute kidney injury: a systematic review and meta‐analysis. Intensive Care Med. 2018;44:323‐336. [DOI] [PMC free article] [PubMed] [Google Scholar]
- 15. Sato Y, Yanagita M. Immune cells and inflammation in AKI to CKD progression. Am J Physiol Renal Physiol. 2018;315:F1501‐F1512. [DOI] [PubMed] [Google Scholar]
- 16. Chiba T, Peasley KD, Cargill KR, et al. Sirtuin 5 Regulates proximal tubule fatty acid oxidation to protect against AKI. J am Soc Nephrol. 2019;30:2384‐2398. [DOI] [PMC free article] [PubMed] [Google Scholar]
- 17. Green DR, Galluzzi L, Kroemer G. Mitochondria and the autophagy‐inflammation‐cell death axis in organismal aging. Science. 2011;333:1109‐1112. [DOI] [PMC free article] [PubMed] [Google Scholar]
- 18. Galley HF. Oxidative stress and mitochondrial dysfunction in sepsis. Br J Anaesth. 2011;107:57‐64. [DOI] [PubMed] [Google Scholar]
- 19. Rocha M, Herance R, Rovira S, Hernández‐Mijares A, Victor VM. Mitochondrial dysfunction and antioxidant therapy in sepsis. Infect Disord Drug Targets. 2012;12:161‐178. [DOI] [PubMed] [Google Scholar]
- 20. Jang HS, Noh MR, Kim J, Padanilam BJ. Defective mitochondrial fatty acid oxidation and lipotoxicity in kidney diseases. Front Med. 2020;7:65. [DOI] [PMC free article] [PubMed] [Google Scholar]
- 21. Kitada M, Xu J, Ogura Y, Monno I, Koya D. Manganese superoxide dismutase dysfunction and the pathogenesis of kidney disease. Front Physiol. 2020;11:755. [DOI] [PMC free article] [PubMed] [Google Scholar]
- 22. Li W, Duan A, Xing Y, Xu L, Yang J. Transcription‐based multidimensional regulation of fatty acid metabolism by HIF1α in renal tubules. Front Cell Dev Biol. 2021;9:690079. [DOI] [PMC free article] [PubMed] [Google Scholar]
- 23. Bugarski M, Ghazi S, Polesel M, Martins JR, Hall AM. Changes in NAD and lipid metabolism drive acidosis‐induced acute kidney injury. J Am Soc Nephrol. 2021;32:342‐356. [DOI] [PMC free article] [PubMed] [Google Scholar]
- 24. Small DM, Sanchez WY, Roy SF, et al. n‐acetyl‐cysteine increases cellular dysfunction in progressive chronic kidney damage after acute kidney injury by dampening endogenous antioxidant responses. Am J Physiol Renal Physiol. 2018;314:F956‐F968. [DOI] [PMC free article] [PubMed] [Google Scholar]
- 25. Klonou A, Chlamydas S, Piperi C. Structure, activity and function of the MLL2 (KMT2B) protein lysine methyltransferase. Life (Basel). 2021;11:283. [DOI] [PMC free article] [PubMed] [Google Scholar]
- 26. de Cubas AA, Rathmell WK. Epigenetic modifiers: activities in renal cell carcinoma. Nat Rev Urol. 2018;15:599‐614. [DOI] [PMC free article] [PubMed] [Google Scholar]
- 27. Hublitz P, Kunowska N, Mayer UP, et al. NIR is a novel INHAT repressor that modulates the transcriptional activity of p53. Genes Dev. 2005;19:2912‐2924. [DOI] [PMC free article] [PubMed] [Google Scholar]
- 28. Perco P, Wilflingseder J, Bernthaler A, et al. Biomarker candidates for cardiovascular disease and bone metabolism disorders in chronic kidney disease: a systems biology perspective. J Cell Mol Med. 2008;12:1177‐1187. [DOI] [PMC free article] [PubMed] [Google Scholar]
- 29. Schroeder JM, Ibrahim H, Taylor L, Curthoys NP. Role of deadenylation and AUF1 binding in the pH‐responsive stabilization of glutaminase mRNA. Am J Physiol Renal Physiol. 2006;290:F733‐F740. [DOI] [PubMed] [Google Scholar]
- 30. Christakoudi S, Runglall M, Mobillo P, et al. Steroid regulation: an overlooked aspect of tolerance and chronic rejection in kidney transplantation. Mol Cell Endocrinol. 2018;473:205‐216. [DOI] [PubMed] [Google Scholar]
- 31. Elgendy M, Fusco JP, Segura V, et al. Identification of mutations associated with acquired resistance to sunitinib in renal cell cancer. Int J Caner. 2019;145:1991‐2001. [DOI] [PubMed] [Google Scholar]
- 32. Wang N, Wu R, Tang D, Kang R. The BET family in immunity and disease. Signal Transduct Target Ther. 2021;6:23. [DOI] [PMC free article] [PubMed] [Google Scholar]
- 33. Liang W, Yamahara K, Hernando‐Erhard C, et al. A reciprocal regulation of spermidine and autophagy in podocytes maintains the filtration barrier. Kidney Int. 2020;98:1434‐1448. [DOI] [PubMed] [Google Scholar]
- 34. Chu AY, Tin A, Schlosser P, et al. Epigenome‐wide association studies identify DNA methylation associated with kidney function. Nat Commun. 2017;8:1286. [DOI] [PMC free article] [PubMed] [Google Scholar]
- 35. Feng W, Chumley P, Prieto MC, et al. Transcription factor avian erythroblastosis virus E26 oncogen homolog‐1 is a novel mediator of renal injury in salt‐sensitive hypertension. Hypertension. 1979;2015(65):813‐820. [DOI] [PMC free article] [PubMed] [Google Scholar]
- 36. Lemos DR, McMurdo M, Karaca G, et al. Interleukin‐1beta activates a MYC‐dependent metabolic switch in kidney stromal cells necessary for progressive tubulointerstitial fibrosis. J Am Soc Nephrol. 2018;29:1690‐1705. [DOI] [PMC free article] [PubMed] [Google Scholar]
- 37. Liu D, Liu Y, Zheng X, Liu N. c‐MYC‐induced long noncoding RNA MEG3 aggravates kidney ischemia‐reperfusion injury through activating mitophagy by upregulation of RTKN to trigger the Wnt/β‐catenin pathway. Cell Death Dis. 2021;12:191. [DOI] [PMC free article] [PubMed] [Google Scholar]
- 38. Haddad G, Kolling M, Wegmann UA, et al. Renal AAV2‐mediated overexpression of long non‐coding RNA H19 attenuates ischemic acute kidney injury through sponging of microRNA‐30a‐5p. J am Soc Nephrol. 2021;32:323‐341. [DOI] [PMC free article] [PubMed] [Google Scholar]
- 39. Yang YH, Markus MA, Mangs AH, Raitskin O, Sperling R, Morris BJ. ZRANB2 localizes to supraspliceosomes and influences the alternative splicing of multiple genes in the transcriptome. Mol Biol Rep. 2013;40:5381‐5395. [DOI] [PubMed] [Google Scholar]
- 40. Chen SJ, Wu P, Sun LJ, et al. miR‐204 regulates epithelial‐mesenchymal transition by targeting SP1 in the tubular epithelial cells after acute kidney injury induced by ischemia‐reperfusion. Oncol Rep. 2017;37:1148‐1158. [DOI] [PubMed] [Google Scholar]
- 41. Zhang T, Xiang L. Honokiol alleviates sepsis‐induced acute kidney injury in mice by targeting the miR‐218‐5p/heme oxygenase‐1 signaling pathway. Cell Mol Biol Lett. 2019;24:15. [DOI] [PMC free article] [PubMed] [Google Scholar]
- 42. Wang X, Liu J, Yin W, et al. miR‐218 expressed in endothelial progenitor cells contributes to the development and repair of the kidney microvasculature. Am J Pathol. 2020;190:642‐659. [DOI] [PMC free article] [PubMed] [Google Scholar]
- 43. Wang W, Lu H. High glucose‐induced human kidney cell apoptosis and inflammatory injury are alleviated by Circ_0008529 knockdown via Circ_0008529‐mediated miR‐485‐5p/WNT2B signaling. Appl Biochem Biotechnol. 2022. doi: 10.1007/s12010-022-04088-z. Online ahead of print. [DOI] [PubMed] [Google Scholar]
- 44. Li X, Zheng P, Ji T, Tang B, Wang Y, Bai S. LINC00052 ameliorates acute kidney injury by sponging miR‐532‐3p and activating the Wnt signaling pathway. Aging. 2020;13:340‐350. [DOI] [PMC free article] [PubMed] [Google Scholar]
- 45. Lv H, Hou H, Lei H, et al. MicroRNA‐6884‐5p regulates the proliferation, invasion, and EMT of gastric cancer cells by directly targeting S100A16. Oncol Res. 2020;28:225‐236. [DOI] [PMC free article] [PubMed] [Google Scholar]
- 46. Mao R, Wang C, Zhang F, et al. Peritoneal M2 macrophage transplantation as a potential cell therapy for enhancing renal repair in acute kidney injury. J Cell Mol Med. 2020;24:3314‐3327. [DOI] [PMC free article] [PubMed] [Google Scholar]
Associated Data
This section collects any data citations, data availability statements, or supplementary materials included in this article.
Supplementary Materials
Figure S1
Figure S2
Figure S3
Figure S4
Tables S1–S4
Data Availability Statement
The datasets used and/or analyzed during the current study are available from the corresponding author on reasonable request.


