Abstract
Background
Aerobic glycolysis is a main characteristic of tumors, and inhibited glycolysis impedes the tumor development. Farnesoid X Receptor (FXR) mainly regulates bile acid metabolism. In this research, we mainly investigated whether FXR was involved in the regulation of glycolysis in colon cancer.
Methods
The differential expression analysis was performed on FXR and Enhancer Binding Protein Beta (CEBPB) data in colon cancer downloaded from The Cancer Genome Atlas (TCGA) database. Western blot and qRT‐PCR were used to detect the expression levels of CEBPB and FXR. The upstream gene of FXR was predicted through bioinformatic analysis. ChIP and dual luciferease assays were performed to confirm the targeted relationship between CEBPB and FXR. Gene Set Enrichment Analysis (GSEA) was performed on FXR. Finally, the glycolysis capabilities of cells in each treatment group were detected. CCK‐8, colony formation assay and flow cytometry were performed to test proliferation and apoptosis of colon cancer cells.
Results
FXR was lowly expressed at the cell level in colon cancer. In vitro assays verified the antitumor effect of FXR on colon cancer. ChIP and dual luciferase assays verified that transcription factor CEBPB bound with the promotor region of FXR, and negatively regulated the expression of FXR. Cell function assays proved that silenced expression of FXR promoted glycolysis, which promoted the development of colon cancer cells.
Conclusion
The study on FXR‐regulated glycolysis of colon cancer cells helps us to further understand the molecular mechanism by which FXR regulated the development of colon cancer cells.
Keywords: CEBPB, colon cancer, FXR, glycolysis
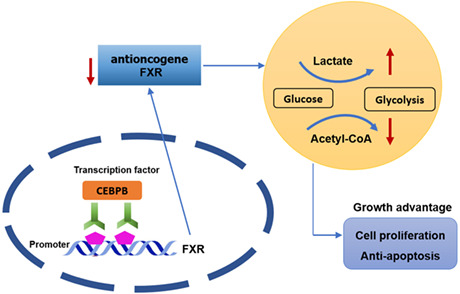
The molecular mechanism by which CEBPB/FXR axis affects colon cancer progression.
1. INTRODUCTION
Colon cancer is a malignant gastrointestinal tumor with high morbidity and poor prognosis. Without surgical removal, the 5‐year survival of patients at the late stage of colon cancer is low. 1 Therefore, a promising target is desperately needed for colon cancer treatment. Warburg effect reveals that even when the oxygen is sufficient, cancer cells tend to choose aerobic glycolysis rather than oxidative phosphorylation (OXPHOS). 2 Aerobic glycolysis provides not only energy that tumor cells need, but also massive intermediate products necessary for cell formation (nucleotides, amino acids, lipids and NADPH). 3 , 4 Aerobic glycolysis is closely related to tumor microenvironment (TME) features (hypoxia, acidosis and immunosuppression). Tumor glycolysis exacerbates hypoxia, acidosis and immunosuppression, and leads to tumor proliferation, angiogenesis, epithelial‐mesenchymal transition (EMT), invasion and metastasis. 5
Metabolic reprogramming is a vital feature for tumors. 6 , 7 Tumor treatment by inhibiting glycolysis is drawing more and more attention. For instance, Bian et al. 7 found that nuclear receptor Nur77 (nerve growth factor‐induced gene B) was a suppressor for hepatocellular carcinoma. The interaction between Nur77 and PEPCK1 (phosphoenolpyruvate carboxykinase) represses the glycolysis, which exhausts ATP and hinders cell growth. Ma et al. 8 discovered that E2F transcription factor 1 manipulated SEC61 Translocon Subunit Gamma to accelerate the development and metastasis of breast cancer by modulating glycolysis. However, few reports focus on colon cancer and glycolysis. Accordingly, this study investigated their relationship.
Farnesoid X receptor (FXR) is a nuclear receptor that transcribes and mediates the signal transcription viability of bile acid. FXR belongs to the nuclear receptor (NR) superfamily, and is vital in mammal reproduction, development and metabolism. 9 FXR locates in human chromosome 12q23.1, and contains 11 exons and 10 introns. 10 It mainly regulates bile acid metabolism to keep the concentration of bile acid in a biologically proper range, thereby preventing bile acid‐induced cytotoxicity. 11 , 12 , 13 Andrea et al. 14 investigated loss of FXR expression in the late stage of colon cancer. At the same time, Sigurd et al. 15 reported that the low expression of FXR in human colon cancer was related to high grading of tumors and poor clinicopathological reaction. These studies indicate that FXR may be a tumor suppressor, but its potential molecular mechanism in the glycolysis process of colon cancer is still unclear.
In the early stage of the study, it was found through bioinformatics analyses that there was an upstream transcription factor (TF) Enhancer Binding Protein Beta (CEBPB) for FXR. CEBPB was significantly upregulated in colon cancer, which was negatively related to FXR. A series of research unveiled that CEBP was an important TF in tumors. 16 Li et al. 17 reported that isoforms of CEBPB participated in aerobic glycolysis, and accelerated growth of breast cancer. Hu et al. 18 found that MIR503 Host Gene repressed the proliferation and invasion of cervical cancer cells, and promoted cell apoptosis through miR‐191/CEBPB axis. So far, the role of CEBPB in colon cancer has been rarely reported. Hence, this study aims to discuss the influence of CEBPB targeting FXR on colon cancer, as well as whether CEBPB targeting FXR affects cancer progression through aerobic glycolysis.
2. MATERIALS AND METHODS
2.1. Bioinformatics analyses
The expression data of FXR mRNA (Normal: 41, Tumor: 480) were downloaded from The Cancer Genome Atlas (TCGA, https://portal.gdc.cancer.gov/). R package “edgeR” was used to perform differential analysis on the normal and the tumor groups (|log FC| > 2, padj < 0.05). Thereafter, hTFtarget and PROMO databases were adopted to predict the upstream regulatory genes of FXR. UALCAN (http://ualcan.path.uab.edu/index.html) was taken to predict the expression of CEBPB protein. ChIPBase (http://rna.sysu.edu.cn/chipbase/) was used to test the correlation between the expression of FXR and CEBPB. JASPAR database was adopted to predict the putative binding site on FXR and CEBPB. Finally, Gene Set Enrichment Analysis (GSEA) was performed on FXR mRNAs to investigate the enriched pathways in colon cancer.
2.2. Cell culture and treatment
Four strains of colon cancer cell lines HCT116 (BNCC337692), SW620 (BNCC337664), HT‐29 (BNCC100164), SW480 (BNCC100604) and one strain of normal human colon cell lines CCD‐18Co (BNCC337724) were prepared for subsequent treatment. HCT116 and CCD‐18Co were cultured in Roswell Park Memorial Institute (RPMI)‐1640 medium. SW620 and SW480 were cultured in CM1‐1 medium. HT‐29 was cultured in McCOY's 5A medium. All these cells were cultured in an incubator containing 5% CO2 at 37°C.
To control the expression of FXR and CEBPB in cells, oe‐FXR and si‐FXR, oe‐CEBPB and si‐CEBPB were established. To acquire oe‐FXR and oe‐CEBPB, the complete CDS sequence of FXR and CEBPB (from GenBank database) were linked to pcDNA3.1 plasmid. The blank pcDNA3.1 plasmid was taken as a negative control (oe‐NC). To silence the expression of FXR and CEBPB, siFXR and siCEBPB were established. All the primer sequences were synthesized by Sangon Biotech. The Lipofectamine 2000 kit (Thermo Fisher) was used to transfect 2 μg plasmid vectors to colon cancer cells SW620 and HCT116. The transfected cells were cultured in an incubator containing 5% CO2 at 37°C.
2.3. qRT‐PCR
Colon cancer cells in each treatment group were collected. Total RNA extraction kit (Invitrogen, Thermo Fisher Scientific, Inc.) was adopted to extract RNA complying with the protocol. β‐actin was taken as an internal reference. The reverse transcription kit (Takara, RR037A) was adopted to reversely transcribe the RNA, while qRT‐PCR kit (Takara, RR820A) was applied for quantitative analysis. Each sample has to be repeated at least three times. In the end, the relative expression was calculated using . Table 1 lists the involved primer sequences.
TABLE 1.
Primer sequences used in qRT‐PCR
| Primer | Forward | Reverse |
|---|---|---|
| FXR | 5′–CAGCAATTGTTATCCTGTCTCC–3′ | 5′–CAGGCTGGTGAATCTTACACA–3′ |
| CEBPB | 5′– AACTTTGGCACTGGGGCACTTG−3′ | 5′–GGGCAGAGGGAGAAGCAGAGAG−3′ |
| β‐Actin | 5′–CTTAGTTGCGTTACACCCTTTCTTG–3′ | 5′–CTGTCACCTTCACCGTTCCAGTTT–3′ |
2.4. Western blot
Four strains of colon cancer cell lines HCT116, SW620, HT‐29, SW480 and one normal human colon cell line CCD18Co were collected. Total protein extraction kit (Catl. No. WLA019, Wanleibio) was adopted to extract the total proteins complying with the protocol given by the manufacturer, with β‐actin as the internal reference. The bicinchoninic acid (BCA) method was used to test the concentration of protein samples. Thereafter, 10% sodium dodecyl sulfate polyacrylamide gel electrophores (SDS‐PAGE) was applied to separate equal proteins (20 μg). Proteins were then transferred to a PVDF membrane. The membrane was blocked with 5% skim milk at room temperature for 1 h, and then cultivated with primary antibodies overnight at 4°C. Thereafter, it was incubated with secondary antibody Goat Anti‐Rabbit IgG H&L (HRP) (1:2000, ab6721) at room temperature for 1 h. Finally, the signal was detected in the gel imaging system, and the band intensity was calculated with ImageJ software. The information of antibodies used in this experiment was as follows: anti‐β‐actin (1:1000, Rabbit polyclonal, ab8227); anti‐FXR (1:1000, Rabbit polyclonal, ab228949); anti‐CEBPB (1:1000, Rabbit monoclonal, ab32358).
2.5. Dual‐luciferase assay
The promoter region of FXR containing CEBPB binding site was cloned to Pgl3‐basic (Panomics, Fremont), and the sequence was named as FXR WT. The promoter region of FXR containing all the possibly mutated CEBPB sites was cloned to Pgl3‐basic (Panomics), and the sequence was named as FXR MUT, with pRLSV40 (Promega) as a control. To study whether silenced or overexpressed CEBPB would impact FXR viability, different concentrations of si‐CEBPB and oe‐CEBPB were co‐transfected to SW620 and HCT116 cells, respectively. Dual‐luciferase reporter detection system was used to detect the luciferase viability.
2.6. The measurement of glycolysis pathway viability
This study determined the activity of the glycolysis pathway by quantitatively measuring the levels of different products (including pyruvate, lactic acid, citric acid and malic acid) produced during glycolysis. Oxygen consumption rate (OCR) and extracellular acidification rate (ECAR) were measured using Seahorse Biosciences XF96 analyzer. Cells were cultured in the petri dish for 24 h, and then cultured in XF medium at 37°C for 2 h. OCR was measured complying with the instruction of XF Cell Mito Stress Test Profile. Oligomycin, carbonyl cyanide m‐chlorophenyl hydrazone (CCCP), and rotenone were added in sequence, and then the OCR value was determined. ECAR was measured complying with XF Glycolysis Stress Test Profile. Glucose, oligomycin and 2‐deoxyglucose were sequentially added to each well until the concentration reached a specified level. ECAR value represented the glycolysis capability, while OCR value represents oxygen consumption rate. The relevant calculation formula was as follows: Glycolysis level = Glycolytic capacity of cells after adding glucose non‐glycolytic acid value (mean(2)−mean(1)); Glycolytic capacity = Maximum glycolytic capacity of cells after adding oligo non‐glycolytic acid value (max(3)−mean(1)); Basic oxygen consumption rate = basic oxygen consumption value non‐mitochondrial respiration and proton leakage (mean(1)−mean(4)); Maximum oxygen consumption rate = Maximum oxygen consumption value non‐mitochondrial respiration and proton leakage (max(3)−mean(4)).
2.7. Cell proliferation capability
CCK‐8 was utilized to detect the cell proliferation viability of colon cancer cells in each treatment group. A microplate reader was adopted to test the absorbance (450 nm) at 0, 24, 48 and 72 h respectively. Meanwhile, the colony formation assay was applied to determine the cell proliferation capability of colon cancer cells in each treatment group. The transfected colon cancer cells were inoculated into 6‐well plates with 5 × 10 2 cells per well. They were cultured in an incubator containing 5% CO2 at 37°C for 12 days. The visible colonies were manually counted after cells were stained.
2.8. Cell apoptosis test
Firstly, colon cancer cells in each treatment group were collected. Then cells were washed three times using precooled phosphate buffer saline (PBS). The cells were resuspended in the binding buffer, where fluorescein isothiocyanate (FITC) and propidium iodide (PI) were then added in the dark using double staining method. Finally, a flow cytometer was adopted to detect the cell apoptosis. Each test was repeated at least three times.
2.9. Chromatin immunoprecipitation (ChIP) assay
Colon cancer cells were cultured in 100 mm petri dish to 80% concentration. ChIP assay was undertaken following the protocol of ChIP kit (P2078, Beyotime Biotechnology). Cell lysates were cultured with IgG as a control. PCR was applied to amplify FXR promoter region to Region 2 (located −1488 ~ −1272) and Region 3 (located −838 ~ −630) that contained CEBPB binding sites, and Region 1 (located −553 ~ −175) that excluded CEBPB binding sites. The latter was taken as a negative control. Antibodies used in ChIP assay were anti‐CEBPB (1:1000, Rabbit monoclonal, ab32358), anti‐IgG (1:1000, Rabbit monoclonal, ab109489). Table 2 shows the primers sequences in ChIP assay.
TABLE 2.
Primers sequences used in ChIP assay
| Primers | Forward | Reverse |
|---|---|---|
| Region1 | 5′–GTCATTGTCTCCATCTCTGCT −3′ | 5′–TGTGTGTCATTTGTTTCCCGTC –3′ |
| Region2 | 5′–TGCTATCTGCCACACACTTTTC–3′ | 5′–CTCTCCCCTTCTTCTGTTTTCC–3′ |
| Region3 | 5′–CTTTGGGAAGTTGTTTCTCAGC–3′ | 5′–TTTGTAGTTTCCTTGCTGTCCC –3′ |
2.10. Statistical analyses
All the data in the study were analyzed using GraphPad Prism 8.0 software and in the form of mean ± standard deviation. The data were subjected to Student‐t test or Bonferroni‐corrected one‐way analysis of variance. * p < 0.05 means a statistically significant difference.
3. RESULTS
3.1. FXR is downregulated in colon cancer tissue and cells
To investigate the expression of FXR in colon cancer, FXR expression data were first downloaded from TCGA database. FXR expression in colon cancer and adjacent tissue was analyzed. The result implied that FXR was significantly downregulated in colon cancer (Figure 1A). To further verify the result, qRT‐PCR and Western blot were utilized to test the FXR expression in colon cancer cell lines. The results suggested that compared with normal human colon cell line CCD‐18Co, FXR expression was prominently lowered in colon cancer cell lines HCT116, SW620, HT‐29, and SW480 (Figure 1B–D). FXR was highly expressed in colon cancer cell line HCT116, while lowly expressed in SW620 (Figure 1B–D). Therefore, HCT116 and SW620 were chosen for further studies.
FIGURE 1.
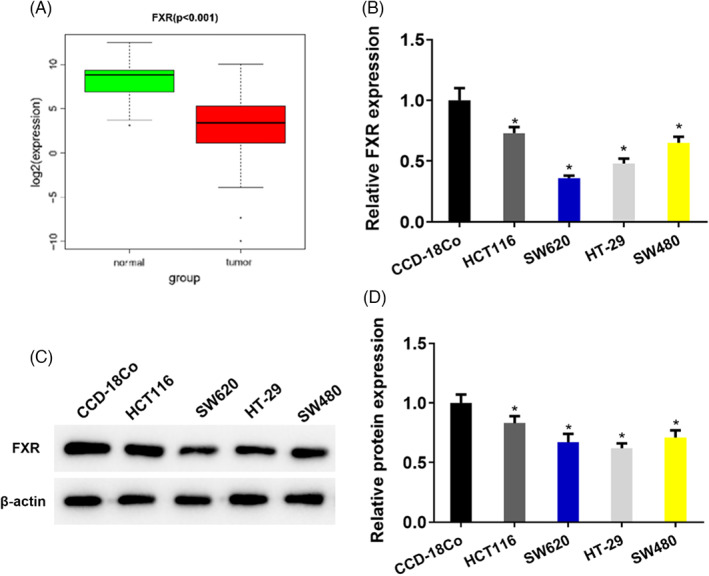
FXR is downregulated in colon cancer tissue and cells. (A) FXR expression data in colon cancer were downloaded from TCGA database. The level of FXR in colon cancer and adjacent tissue. (B) qRT‐PCR detected the level of FXR in four strains of colon cancer cell lines (HCT116, SW620, HT‐29, SW480) and one human normal colon cell line CCD‐18Co. (C) Western blot determined the protein expression of FXR in four strains of cancer cell lines (HCT116, SW620, HT‐29, SW480) and one human normal colon cell line CCD‐18Co, where β‐actin was the internal reference. (D) Quantification of Western blot band intensity from (C). * p < 0.05
3.2. The aberrant expression of FXR affects the proliferation and apoptosis of colon cancer cells
To explore the impact of aberrant expression of FXR on colon cancer cells functions, oe‐FXR and si‐FXR cell lines were established. First, qRT‐PCR was applied to test the cell transfection efficiency. The results indicated that FXR expression was remarkably increased in cells transfected with oe‐FXR, while the FXR expression was notably lowered in cells transfected with si‐FXR (Figure 2A). Thereafter, CCK‐8 and the colony‐formation assay indicated that compared with the control group, cell proliferation capability of cells transfected with oe‐FXR was significantly lowered (Figure 2B,C). At the same time, cell proliferation capability of cells transfected with si‐FXR was remarkably enhanced (Figure 2B,C). In addition, the flow cytometry was utilized to figure out the cell apoptosis rate. The result unveiled that the cell apoptosis rates of cells transfected with oe‐FXR were significantly increased, while the cell apoptosis rates of cells transfected with si‐FXR were remarkably reduced (Figure 2D). To sum up, overexpressed FXR repressed the cell proliferation of colon cancer cells and stimulated cell apoptosis. The silenced FXR facilitated the proliferation of colon cancer proliferation and repressed cell apoptosis. FXR was a tumor suppressor in colon cancer.
FIGURE 2.
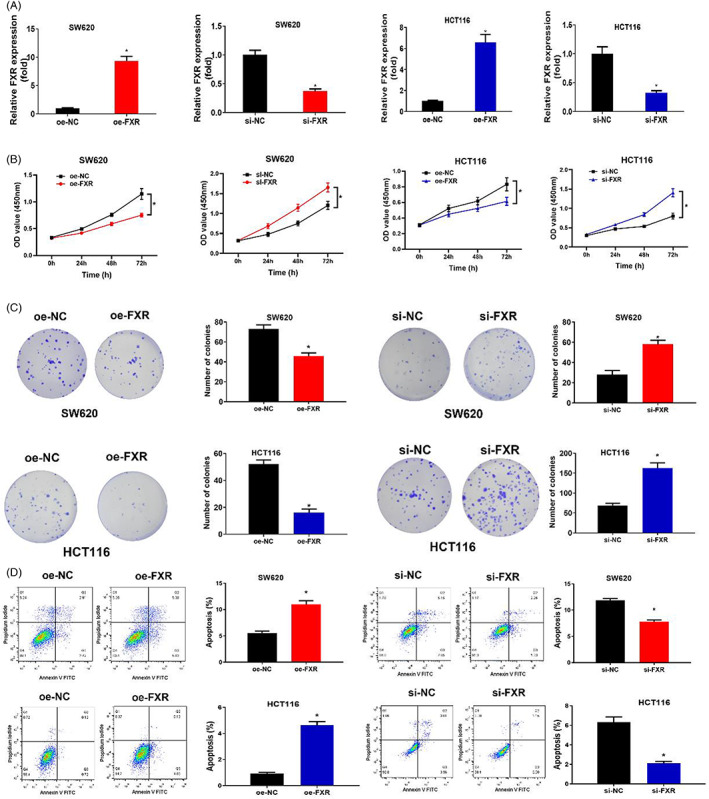
The aberrant expression of FXR affects the proliferation and apoptosis of colon cancer cells. (A) The expression of FXR in SW620 and HCT116 cell lines after oe‐FXR and si‐FXR were transfected. oe‐NC and si‐NC were control groups. (B) The cell viability in each treatment group. OD value was 450 nm, and the cell proliferation viability were measured at 0, 24, 48, 72 h respectively. (C) Cell proliferation capability in each treatment group. (D) Cell apoptosis rate in each treatment group. Cell grouping settings in Figure A–D: oe‐FXR and oe‐NC groups, si‐FXR and si‐NC groups. * p < 0.05
3.3. The aberrant expression of FXR affects the glycolysis of colon cancer
In recent years, more and more studies have been focusing on inhibiting glycolysis to block the malignant progression of tumors. In this study, the low expression of FXR was significantly related to the Glycolysis/Gluconeogenesis metabolic pathway subjecting to GSEA (Figure 3A). In order to study whether aberrant expression of FXR was involved in cellular glycolysis, oe‐FXR and si‐FXR cell lines were constructed. First, glycolysis products in the oe‐FXR transfection group were measured through biochemical experiments. The results implied that overexpressed FXR inhibited the production of pyruvic acid, lactic acid, citric acid and malic acid in colon cancer cells (Figure 3B,C), indicating that inducing FXR expression could block the glycolysis process. In contrast, the silenced expression of FXR significantly promoted the production of pyruvic, lactic acid, citric acid and malic acid in colon cancer cells (Figure 3B,C), indicating that the silenced expression of FXR could promote the glycolysis process of colon cancer cells.
FIGURE 3.
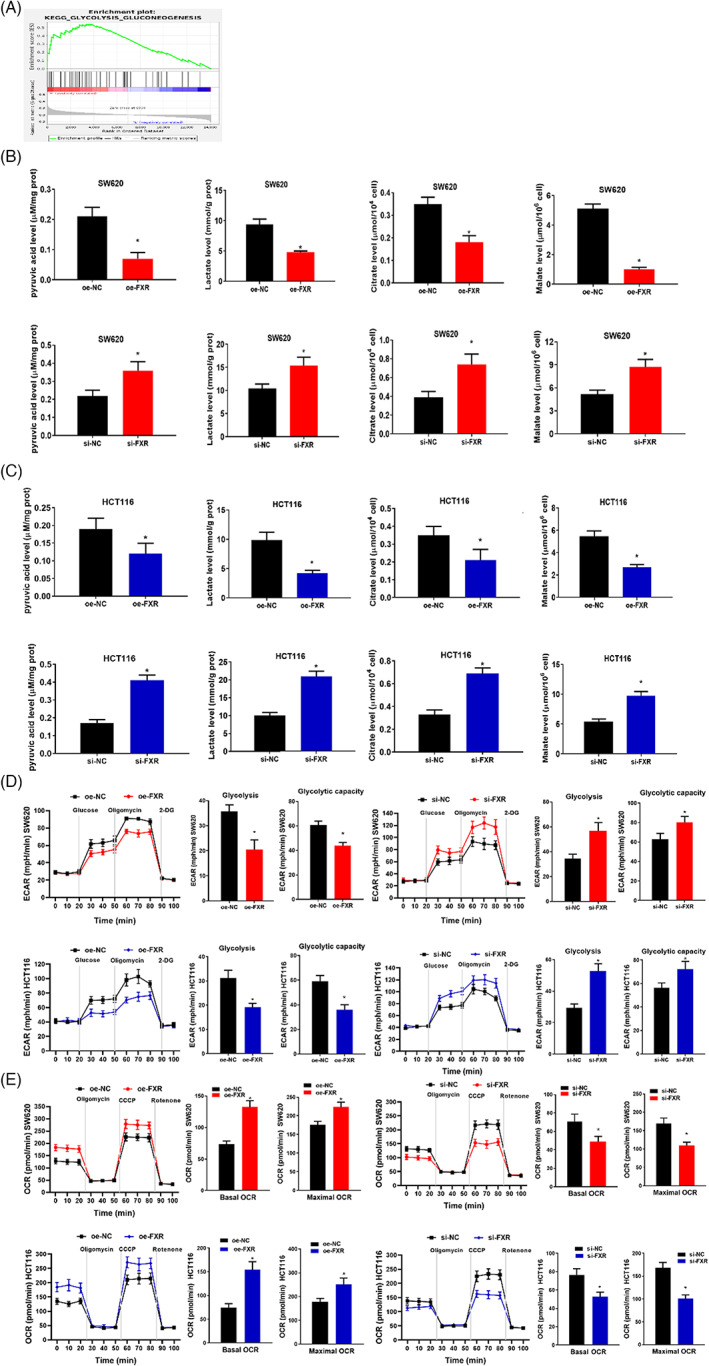
The aberrant expression of FXR affects the glycolysis of colon cancer. (A) GSEA results implied that the down‐regulation of FXR is remarkably correlated with Glycolysis/Gluconeogenesis. (B) Pyruvic acid, lactic acid, citric acid and malic acid were measured in SW620 treatment groups. (C) Pyruvic acid, lactic acid, citric acid and malic acid were measured in HCT116 treatment groups. (D–E) Seahorse XP 96 was used to analyze ECAR and OCR of SW620 and HCT116. The glycolysis level, the basic oxygen consumption rate of glycolysis, and the maximum oxygen consumption rate were calculated based on the test results. During the detection of Seahorse XP 96, glucose, oligomycin, carbonyl cyanide m‐chlorophenyl hydrazone (CCCP), rotenone and 2‐deoxyglucose (2DG) were sequentially injected into the experimental microchamber. * p < 0.05
To further determine the effect of aberrant expression of FXR on cell glycolysis and metabolism, a real‐time quantitative glycolysis assay was performed. Seahorse method was adopted to analyze ECAR and OCR. ECAR detected the glycolysis capacity of SW620 and HCT116 cells, while OCR detected the oxidative phosphorylation (OXPHOS) viability of mitochondria (Figure 3D,E). Their results demonstrated that overexpressed FXR prominently repressed the glycolysis level and capacity of colon cancer cells (Figure 3D). Overexpressed FXR resulted in a significant increase in the basic oxygen consumption rate and maximum oxygen consumption rate (Figure 3E). It was indicated that compared with OXPHOS, the glycolysis level was lowered. In contrast, the silenced expression of FXR prominently impelled the glycolysis level and capacity of colon cancer cells (Figure 3D). The silenced FXR resulted in a significant decrease in the basic oxygen consumption rate and maximum oxygen consumption rate (Figure 3E). It was indicated that glycolysis level was increased over OXPHOS. In sum, overexpressed FXR repressed glycolysis in colon cancer cells, while silenced FXR promoted glycolysis. Aberrant FXR expression affected the progression of colon cancer by regulating cellular glycolysis.
3.4. CEBPB directly targets FXR
To dig up the upstream gene of FXR, hTFtarget and PROMO databases were utilized. CEBPB was found to be the only one TF that regulated the expression of FXR (Figure 4A). CEBPB was significantly highly expressed in colon cancer patients (Figure 4B). The Pearson correlation analysis revealed that the expression levels of CEBPB and FXR were negatively correlated (Figure 4C). To further verify the results of bioinformatics analyses, qRT‐PCR was adopted to test the expression level of CEBPB in colon cancer cells. It was revealed that CEBPB was remarkably upregulated in cells (Figure 4D), indicating that CEBPB promoted the progression of colon cancer.
FIGURE 4.
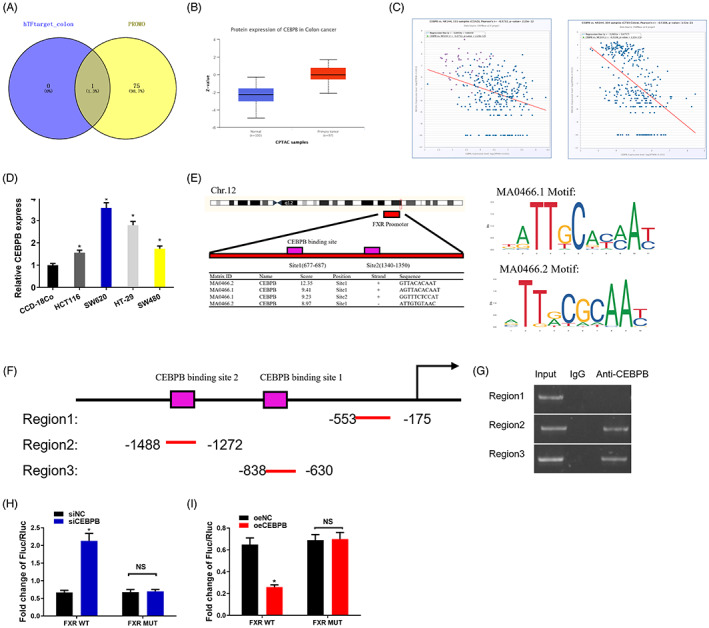
TF CEBPB regulates the expression of FXR in colon cancer cells by directly binding FXR promoter. (A) The upstream genes of FXR were predicted by hTFtarget and PROMO databases. (B) The expression of CEBPB protein was analyzed using UALCAN (http://ualcan.path.uab.edu/index.html). (C) The correlation of CEBPB expression in TCGA database and colon cancer was analyzed utilizing bioinformatics method. (D) Levels of CEBPB in four strains of colon cancer cell lines (HCT116, SW620, HT‐29, SW480) and one strain of human normal colon cancer cell line CCD‐18Co. (E) ChIPBase and JASPER databases were adopted to predict the putative binding site of CEBPB on FXR. (F) The diagram demonstrating the FXR promoter region using different primers for amplication. Region 2 and Region 3 both contain one CEBPB binding site, while Region 1 that excludes CEBPB binding site is taken as a negative control. (G) The relationship between CEBPB and FXR promoter. (H) si‐CEBPB is constructed, and then co‐transfected with the firefly luciferase vector containing either wild or mutation FXR promoter. pRL‐SV40 containing Renilla luciferase is taken as a control plasmid. The firefly luciferase and Renilla luciferase ratio are utilized to check the viability of promoters. The test is repeated three times on each sample. (I) oe‐CEBPB is constructed, and then co‐transfected with the firefly luciferase vector containing either wild or mutation FXR promoter. pRL‐SV40 containing Renilla luciferase is taken as a control plasmid. The firefly luciferase‐Renilla luciferase ratio is utilized to check the viability of promoters. The test is repeated three times.* p < 0.05
To identify the targeted relationship between CEBPB and FXR, ChIPBase and JASPER databases were first adopted. CEBPB was revealed as the key TF that regulated FXR (Figure 4E). Through bioinformatics analysis, it was predicted that there were at least two possible binding sites for CEBPB on FXR promoter: Site1(677–687) and Site2(1340–1350) (Figure 4E). Then the ChIP assay verified the binding relationship between CEBPB and FXR promoter region. Hereby, two primers containing CEBPB core binding sequences were designed. The sequences were located in the transcription start sites (Region 2 and Region 3). Region 1 (excluding binding elements) was taken as a negative control (Figure 4F). The binding of CEBPB and FXR promoter was observed in regions 2 and 3, while there were no bands in the negative control (Region 1) (Figure 4G), implying that CEBPB targeted Region 2 and Region 3 of FXR promoter.
Thereafter, the dual‐luciferase assay determined the molecular regulation mechanism of CEBPB targeting FXR. The reported luciferase gene driven by FXR promoter was utilized to test the transcription viability of FXR, thereby measuring the luciferase viability when CEBPB was overexpressed or silenced. When CEBPB was silenced in SW620 cells, the luciferase viability was significantly increased (Figure 4H). In contrast, overexpressed CEBPB in HCT116 led to a significant decrease of luciferase viability (Figure 4I). Comparing the viability of wild and mutant FXR promoters (FXR WT and FXR MUT, respectively), the experimental results indicated that CEBPB knockdown did not affect the luciferase viability of FXR MUT (Figure 4I). Similarly, overexpressed CEBPB had no effect on FXR MUT activity (Figure 4I). The above experimental results revealed that CEBPB directly bound to the CEBPB binding element in the FXR promoter region to drive downstream gene expression. Overexpressed CEBPB could suppress the activation of FXR, while silenced CEBPB could activate FXR.
3.5. CEBPB targets FXR to affect the glycolysis of colon cancer and cell growth
To further examine whether CEBPB affected the glycolysis by targeting FXR in colon cancer, we set up the HCT116 cells transfected with oe‐CEBPB, si‐CEBPB, oe‐FXR and si‐FXR vector. Cell grouping was as follows: Vector+oe‐NC, oe‐CEBPB+oe‐NC, oe‐CEBPB+oe‐FXR, Vector+si‐NC, si‐CEBPB+si‐NC, si‐CEBPB+si‐FXR. Western blot tested the cell transfection efficiency in each treatment group. The results revealed that the CEBPB protein level was prominently risen in oe‐CEBPB treatment group, while the FXR protein level was remarkably reduced. FXR protein level was remarkably increased in co‐transfected oe‐CEBPB and oe‐FXR groups (Figure 5A). What is more, the CEBPB protein level was prominently reduced in si‐CEBPB treatment group, while the FXR protein level was remarkably risen. CEBPB protein level was remarkably decreased in co‐transfected si‐CEBPB and si‐FXR groups (Figure 5A). Thereafter, ECAR was taken to analyze the glycolysis process in each treatment group. OCR evaluated mitochondrial OXPHOS activity (Figure 5B,C). The overexpressed CEBPB remarkably promoted the glycolysis level and capability of colon cancer cells (Figure 5B,C), but notably abated the basic oxygen consumption rate and the maximum oxygen consumption rate (Figure 5B,C). The glycolysis level was notably increased in comparison with OXPHOS. In contrast, when oe‐CEBPB and oe‐FXR were co‐transfected into colon cancer cells, oe‐FXR offset the promotion of oe‐CEBPB‐driven glycolysis in colon cancer (Figure 5B,C). The results of Vector+si‐NC, si‐CEBPB+si‐NC and si‐CEBPB+si‐FXR groups also matched the above results. Therefore, CEBPB boosted glycolysis in colon cancer by suppressing the expression of FXR.
FIGURE 5.
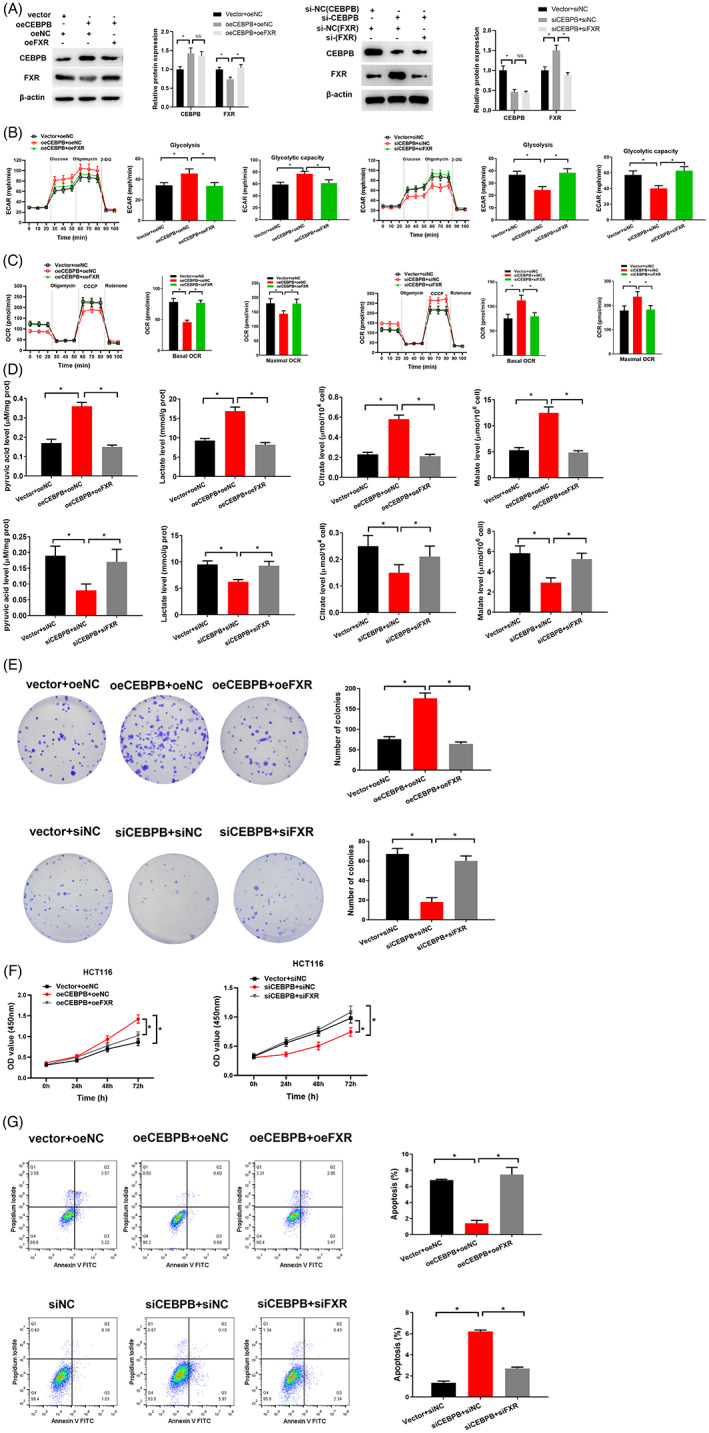
CEBPB targets FXR to affect the glycolysis of colon cancer and cell growth. (A) Protein level of CEBPB and FXR in each treatment group. (B–C) Seahorse XP96 was applied to analyze ECAR and OCR in cells in each treatment group. The glycolysis level and capability, basic oxygen consumption ratio, and the maximum oxygen consumption ratio were calculated based on the test results. (D) Contents of pyruvic acid, lactic acid, citric acid and malic acid were measured in cells in each treatment group. (E) Cell proliferation capability in each treatment group. (F) CCK‐8 was adopted to dig out cell proliferation viability in each treatment group. OD value was set at 450 nm, and the cell proliferation viability was measured at 0, 24, 48 and 72 h. (G) Cell apoptosis rate in each treatment group. Cell grouping setting of group A–G: Vector+oeNC, oeCEBPB+oeNC, oeCEBPB+oeFXR, Vector+siNC, siCEBPB+siNC, siCEBPB+siFXR. * p < 0.05
To verify that CEBPB targeting FXR affected the glycolysis of colon cancer. Product test of Glycolysis/Gluconeogenesis revealed that production of pyruvic acid, lactic acid, citric acid and malic acid remarkably soared and decreased in colon cancer cells with overexpressed CEBPB and CEBPB knockout, respectively. (Figure 5D), indicating that overexpressed CEBPB could promote the glycolysis progression, while inhibition of CEBPB expression could inhibit glycolysis. In contrast, when oe‐CEBPB and oe‐FXR were co‐transfected to colon cancer cells, the production of pyruvic acid, lactic acid, citric acid and malic acid in the cells were notably reduced (Figure 5D). In sum, oe‐FXR offset the glycolysis facilitated by oe‐CEBPB in colon cancer (Figure 5D). The results of Vector+si‐NC, si‐CEBPB+si‐NC and si‐CEBPB+si‐FXR group also matched the above results. In other words, CEBPB accelerated the glycolysis of colon cancer cells by targeting FXR.
On top of that, cell functional experiments were carried out to confirm that CEBPB targeting FXR affected colon cancer cell growth. CCK‐8 and colony formation assay revealed that overexpressed CEBPB led to a prominent increase in cell proliferation capabilities of colon cancer cells (Figure 5E,F). Flow cytometry unveiled that overexpressed CEBPB resulted in a remarkable reduction in cell apoptosis rate (Figure 5G). In contrast, when oe‐CEBPB and oe‐FXR were co‐transfected, the cell proliferation capability was notably reduced (Figure 5E,F), but the cell apoptosis was considerably increased (Figure 5G). The results of Vector+si‐NC, si‐CEBPB+si‐NC and si‐CEBPB+si‐FXR groups also matched the above results (Figure 5E–G). To sum up, overexpressed CEBPB promoted the growth of colon cancer cells, which could be offset by overexpressing FXR. Specifically, CEBPB promoted cancer progression by downregulating FXR expression. The glycolysis of colon cancer cells was then promoted to accelerate the cell growth of colon cancer cells.
4. DISCUSSION
This study analyzed the regulation between CEBPB and FXR, which was further proven by ChIP and dual luciferase assays. The suppression of FXR on tumor cells was evaluated. Percentages of pyruvic acid, lactic acid, citric acid and malic acid, as well as ECAR and OCR of cells in petri dish were measured. A series of cell assays and molecular assays suggested that CEBPB negatively regulated the expression of FXR and accelerated aerobic glycolysis, which facilitated colon cancer cell growth (Figure 6).
FIGURE 6.
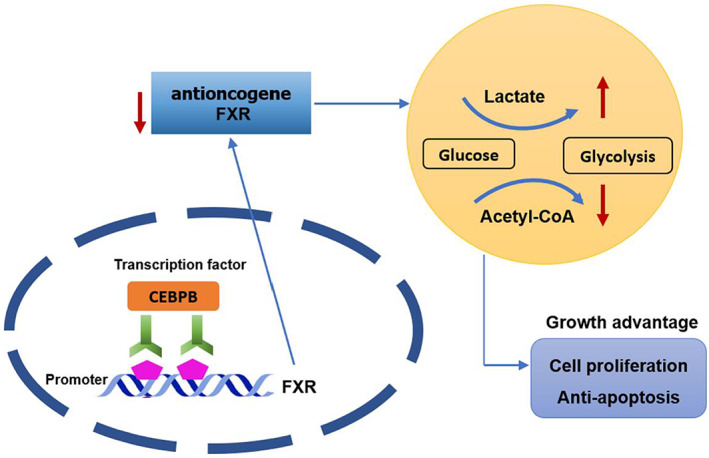
The molecular mechanism by which CEBPB/FXR axis affects colon cancer progression. The figure demonstrates that CEBPB/FXR axis regulates glycolysis and cell growth in colon cancer cells.
FXR is a crucial gene relating to metabolism. This study verified from cell level that FXR was downregulated in colon cancer. In fact, studies have found that FXR is downregulated in colon cancer. For instance, Li et al. 19 uncovered that overexpressed FXR could induce the antitumor activity of colorectal cancer. Yu et al. 20 unveiled that FXR antagonized Wnt/beta‐catenin signaling to further repress colorectal tumorigenesis. In spite of that, the molecular mechanism of FXR in colorectal cancer remains to be further investigated. 20 , 21 In this study, it was verified through in vitro experiments that overexpressed FXR repressed the proliferation of colon cancer cells, confirming that FXR played an anticancer role in colon cancer. Excitingly, we discovered and confirmed for the first time that the TF CEBPB could bind to the FXR promoter region and negatively regulate the expression of FXR. CEBPB played an important role in maintaining the tumorigenesis and invasion ability. 22 For example, the TF CEBPB represses the proliferation of osteosarcoma by regulating its downstream target gene CLEC5A. 23 Here, we clarified that overexpressed CEBPB could accelerate glycolysis and malignant progression in colon cancer cells. In addition, we also confirmed that CEBPB played as a promoter in colon cancer by suppressing the expression of FXR.
Herein, it was found through bioinformatics approach that low‐level FXR was remarkably relevant to glycolysis signaling. In the 1920s, Otto Warburg discovered that glycolysis was the main source of energy for cancer cells even with sufficient oxygen. 24 Oxidative phosphorylation is the main mechanism for normal cells to produce energy. However, during cell growth and proliferation, tumor cells require a large amount of energy in a short time. OXPHOS cannot effectively provide energy for tumors, while glycolysis pathways do. Therefore, cancer cells mainly produce energy through glycolysis, and the lactic acid produced by glycolysis provides an acidic environment for tumor growth. 25 The Warburg effect is mainly manifested in glucose consumption, lactic acid production and ATP levels in cancer cells. Therefore, by measuring the content of pyruvic acid, lactic acid, citric acid and malic acid, as well as ECAR and OCR of cells, we could determine whether FXR affected glycolysis. The results of this study revealed that overexpressed FXR significantly repressed the glycolysis level and capacity of colon cancer cells, and led to a significant increase in the basic oxygen consumption rate and maximum oxygen consumption rate of cells. Overexpressed CEBPB significantly accelerated the glycolysis level and capacity of colon cancer, indicating that the glycolysis level was increased. It could be seen that CEBPB repressed the glycolysis capability of colon cancer cells by repressing FXR level. Our research further validated the research of Geoffrey 26 and Xie 27 , namely, FXR could regulate glycolysis and control the metabolic reprogramming of cells.
This study systematically verified through a series of molecular experiments and cell experiments that TF CEBPB negatively regulated the expression of FXR to mediate cell aerobic glycolysis, thereby affecting the growth of colon cancer cells. However, we did not deeply dissect the downstream signaling regulated by CEBPB/FXR axis in colon cancer progression. At the same time, there are not plenty of studies focusing on the molecular mechanism of FXR‐regulated colon cancer growth. Accordingly, we intended to explore the signaling pathways downstream of the CEBPB/FXR axis. Therefore, the molecular mechanism of FXR‐regulated colon cancer growth will be further clarified. On the other hand, whether the CEBPB/FXR regulatory axis contributes to the metastasis of advanced colon cancer, and whether the CEBPB/FXR regulatory axis contributes to the clinical targeted therapy of colon cancer, need further research. Our team intends to continue to dissect the function of the CEBPB/FXR regulatory axis in colon cancer in the future. In sum, our results manifested that the TF CEBPB negatively regulated the expression of FXR, adjusted cell aerobic glycolysis, and accelerated the growth of colon cancer. Therefore, this study enabled a more comprehensive cognition of the pathogenesis of colon cancer, thereby providing a theoretical basis for molecular diagnosis and treatment of colon cancer.
Wang Z, Pang J, Wang L, Dong Q, Jin D . CEBPB regulates the bile acid receptor FXR to accelerate colon cancer progression by modulating aerobic glycolysis. J Clin Lab Anal. 2022;36:e24703. doi: 10.1002/jcla.24703
REFERENCES
- 1. Al Abdulsalam EA, Al Harithy RN. Visfatin and global histone H3K9me levels in colon cancer. Ann Med. 2021;53:647‐652. doi: 10.1080/07853890.2021.1925737 [DOI] [PMC free article] [PubMed] [Google Scholar]
- 2. Sanderson SM, Locasale JW. Revisiting the Warburg effect: some tumors hold their breath. Cell Metab. 2018;28:669‐670. doi: 10.1016/j.cmet.2018.10.011 [DOI] [PMC free article] [PubMed] [Google Scholar]
- 3. Wang T, Marquardt C, Foker J. Aerobic glycolysis during lymphocyte proliferation. Nature. 1976;261:702‐705. doi: 10.1038/261702a0 [DOI] [PubMed] [Google Scholar]
- 4. Pavlova NN, Thompson CB. The emerging hallmarks of cancer metabolism. Cell Metab. 2016;23:27‐47. doi: 10.1016/j.cmet.2015.12.006 [DOI] [PMC free article] [PubMed] [Google Scholar]
- 5. Warburg O, Wind F, Negelein E. The metabolism of tumors in the body. J Gen Physiol. 1927;8:519‐530. doi: 10.1085/jgp.8.6.519 [DOI] [PMC free article] [PubMed] [Google Scholar]
- 6. Hirata H, Sugimachi K, Komatsu H, et al. Decreased expression of Fructose‐1,6‐bisphosphatase associates with glucose metabolism and tumor progression in hepatocellular carcinoma. Cancer Res. 2016;76:3265‐3276. doi: 10.1158/0008-5472.CAN-15-2601 [DOI] [PubMed] [Google Scholar]
- 7. Bian XL, Chen HZ, Yang PB, et al. Nur77 suppresses hepatocellular carcinoma via switching glucose metabolism toward gluconeogenesis through attenuating phosphoenolpyruvate carboxykinase sumoylation. Nat Commun. 2017;8:14420. doi: 10.1038/ncomms14420 [DOI] [PMC free article] [PubMed] [Google Scholar]
- 8. Ma J, He Z, Zhang H, zhang W, Gao S, Ni X. SEC61G promotes breast cancer development and metastasis via modulating glycolysis and is transcriptionally regulated by E2F1. Cell Death Dis. 2021;12:550. doi: 10.1038/s41419-021-03797-3 [DOI] [PMC free article] [PubMed] [Google Scholar]
- 9. Mustonen EK, Lee SML, Nieß H, Schwab M, Pantsar T, Burk O. Identification and characterization of novel splice variants of human farnesoid X receptor. Arch Biochem Biophys. 2021;705:108893. doi: 10.1016/j.abb.2021.108893 [DOI] [PubMed] [Google Scholar]
- 10. Huber RM, Murphy K, Miao B, et al. Generation of multiple farnesoid‐X‐receptor isoforms through the use of alternative promoters. Gene. 2002;290:35‐43. doi: 10.1016/s0378-1119(02)00557-7 [DOI] [PubMed] [Google Scholar]
- 11. Makishima M, Okamoto AY, Repa JJ, et al. Identification of a nuclear receptor for bile acids. Science. 1999;284:1362‐1365. doi: 10.1126/science.284.5418.1362 [DOI] [PubMed] [Google Scholar]
- 12. Parks DJ, Blanchard SG, Bledsoe RK, et al. Bile acids: natural ligands for an orphan nuclear receptor. Science. 1999;284:1365‐1368. doi: 10.1126/science.284.5418.1365 [DOI] [PubMed] [Google Scholar]
- 13. Hsieh J, Koseki M, Molusky MM, et al. TTC39B deficiency stabilizes LXR reducing both atherosclerosis and steatohepatitis. Nature. 2016;535:303‐307. doi: 10.1038/nature18628 [DOI] [PMC free article] [PubMed] [Google Scholar]
- 14. De Gottardi A et al. The bile acid nuclear receptor FXR and the bile acid binding protein IBABP are differently expressed in colon cancer. Dig Dis Sci. 2004;49:982‐989. doi: 10.1023/b:ddas.0000034558.78747.98 [DOI] [PubMed] [Google Scholar]
- 15. Lax S, Schauer G, Prein K, et al. Expression of the nuclear bile acid receptor/farnesoid X receptor is reduced in human colon carcinoma compared to nonneoplastic mucosa independent from site and may be associated with adverse prognosis. Int J Cancer. 2012;130:2232‐2239. doi: 10.1002/ijc.26293 [DOI] [PubMed] [Google Scholar]
- 16. Zhou Q, Sun X, Pasquier N, et al. Cell‐penetrating CEBPB and CEBPD leucine zipper decoys as broadly acting anti‐cancer agents. Cancers (Basel). 2021;13:2504. doi: 10.3390/cancers13102504 [DOI] [PMC free article] [PubMed] [Google Scholar]
- 17. Li W et al. Aerobic glycolysis controls myeloid‐derived suppressor cells and tumor immunity via a specific CEBPB isoform in triple‐negative breast cancer. Cell Metab. 2018;28:87‐103.e6. doi: 10.1016/j.cmet.2018.04.022 [DOI] [PMC free article] [PubMed] [Google Scholar]
- 18. Hu YL, Zhang YX, Liu N, Liu H, Yuan YC. LncRNA MIR503HG regulated cell viability, metastasis and apoptosis of cervical cancer via miR‐191/CEBPB axis. Eur Rev Med Pharmacol Sci. 2021;25:3200‐3210. doi: 10.26355/eurrev_202104_25728 [DOI] [PubMed] [Google Scholar]
- 19. Li S, Xu Z, Guo J, Zheng J, Sun X, Yu J. Farnesoid X receptor activation induces antitumour activity in colorectal cancer by suppressing JAK2/STAT3 signalling via transactivation of SOCS3 gene. J Cell Mol Med. 2020;24:14549‐14560. doi: 10.1111/jcmm.16083 [DOI] [PMC free article] [PubMed] [Google Scholar]
- 20. Yu J, Li S, Guo J, Xu Z, Zheng J, Sun X. Farnesoid X receptor antagonizes Wnt/beta‐catenin signaling in colorectal tumorigenesis. Cell Death Dis. 2020;11:640. doi: 10.1038/s41419-020-02819-w [DOI] [PMC free article] [PubMed] [Google Scholar]
- 21. Lee YJ, Lee EY, Choi BH, Jang H, Myung JK, You HJ. The role of nuclear receptor subfamily 1 group H member 4 (NR1H4) in colon cancer cell survival through the regulation of c‐Myc stability. Mol Cells. 2020;43:459‐468. doi: 10.14348/molcells.2020.0041 [DOI] [PMC free article] [PubMed] [Google Scholar]
- 22. Du C et al. Microarray data analysis to identify crucial genes regulated by CEBPB in human SNB19 glioma cells. World J Surg Oncol. 2016;14:258. doi: 10.1186/s12957-016-0997-z [DOI] [PMC free article] [PubMed] [Google Scholar]
- 23. Lu J, Chen W, Liu H, Yang H, Liu T. Transcription factor CEBPB inhibits the proliferation of osteosarcoma by regulating downstream target gene CLEC5A. J Clin Lab Anal. 2019;33:e22985. doi: 10.1002/jcla.22985 [DOI] [PMC free article] [PubMed] [Google Scholar]
- 24. Koppenol WH, Bounds PL, Dang CV. Otto Warburg's contributions to current concepts of cancer metabolism. Nat Rev Cancer. 2011;11:325‐337. doi: 10.1038/nrc3038 [DOI] [PubMed] [Google Scholar]
- 25. Annibaldi A, Widmann C. Glucose Metabolism in Cancer Cells. Curr Opin Clin Nutr Metab Care. 2010;13:466‐470. [DOI] [PubMed] [Google Scholar]
- 26. Preidis GA, Kim KH, Moore DD. Nutrient‐sensing nuclear receptors PPARalpha and FXR control liver energy balance. J Clin Invest. 2017;127:1193‐1201. doi: 10.1172/JCI88893 [DOI] [PMC free article] [PubMed] [Google Scholar]
- 27. Xie Y, Wang H, Cheng X, et al. Farnesoid X receptor activation promotes cell proliferation via PDK4‐controlled metabolic reprogramming. Sci Rep. 2016;6:18751. doi: 10.1038/srep18751. PMID: 26728993; PMCID: PMC4700422. [DOI] [PMC free article] [PubMed] [Google Scholar]


