

Abstract
Background
Aortopathy is common with bicuspid aortic valve (BAV), and underlying intrinsic tissue abnormalities are believed causative. Valve‐mediated hemodynamics are altered in BAV and may contribute to aortopathy and its progression. The contribution of intrinsic tissue defects versus altered hemodynamics to aortopathy progression is not known.
Purpose
To investigate relative contributions of tissue‐innate versus hemodynamics in progression of BAV aortopathy.
Study Type
Retrospective.
Subjects
Four hundred seventy‐three patients with aortic dilatation (diameter ≥40 mm; comprised of 281 BAV with varied AS severity, 192 tricuspid aortic valve [TAV] without AS) and 124 healthy controls. Subjects were 19–91 years (141/24% female).
Field Strength/Sequence
1.5T, 3T; time‐resolved gradient‐echo 3D phase‐contrast (4D flow) MRI.
Assessment
A surrogate measure for global aortic wall stiffness, pulse wave velocity (PWV), was quantified from MRI by standardized, automated technique based on through‐plane flow cross‐correlation maximization. Comparisons were made between BAV patients with aortic dilatation and varying aortic valve stenosis (AS) severity and healthy subjects and aortopathy patients with normal TAV.
Statistical Tests
Multivariable regression, analysis of covariance (ANCOVA), Tukey's, student's (t), Mann–Whitney (U) tests, were used with significance levels P < 0.05 or P < 0.01 for post‐hoc Bonferroni‐corrected t/U tests. Bland–Altman and ICC calculations were performed.
Results
Multivariable regression showed age with the most significant association for increased PWV in all groups (increase 0.073–0.156 m/sec/year, R 2 = 0.30–48). No significant differences in aortic PWV were observed between groups without AS (P = 0.20–0.99), nor were associations between PWV and regurgitation or Sievers type observed (P = 0.60, 0.31 respectively). In contrast, BAV AS patients demonstrated elevated PWV and a significant relationship for AS severity with increased PWV (covariate: age, R 2 = 0.48). BAV and TAV patients showed no association between aortic diameter and PWV (P = 0.73).
Data Conclusion
No significant PWV differences were observed between BAV patients with normal valve function and control groups. However, AS severity and age in BAV patients were directly associated with PWV increases.
Evidence Level
3
Technical Efficacy
Stage 3
Keywords: hemodynamics, 4D flow MRI, valvular heart disease, pulse wave velocity (PWV)
Introduction
Bicuspid aortic valve (BAV) disease, the most common congenital heart defect, is associated with high risk of aortopathy such as aortic dilatation, aneurysm, and dissection. 1 There is evidence for a genetic origin of BAV, with familial heritability, differential prevalence by sex, and aortic medial wall tissue differences between BAV and normal tricuspid aortic valve (TAV) subjects on a cellular level. 2 , 3 , 4 These structural wall tissue differences may be associated with altered aortic wall biomechanics, such as stiffness as a potential contributing factor to greater risk for aortopathy in BAV. 3 , 5
It is also suggested that BAV is frequently associated with impaired valve function, such as aortic valve stenosis (AS). 2 , 3 Valve abnormalities can result in altered aortic hemodynamics (eg, valve flow jets with elevated peak systolic velocities), which can impact the vessel wall and further accelerate the development of aortopathy. 1 , 2 , 3 , 6 , 7 , 8 , 9 Indeed, studies have shown that BAV‐mediated changes in aortic flow dynamics can result in exposure to high wall shear stress, a known stimulus for vessel wall remodeling and medial aortic wall degeneration. 8 , 9 However, debates exist regarding relative contributions of altered wall structure and BAV‐mediated hemodynamics as the main causes of complications for BAV patients. 10 , 11 Innate wall tissue differences in BAV may exist and result in altered aortic wall biomechanics, and thus relate to increased risk for aortopathy, even in the presence of normal BAV valve function. 12 A systematic characterization of biomechanical properties such as aortic stiffness in BAV patients across the spectrum of aortic valve dysfunction would help answer these uncertainties.
Pulse wave velocity (PWV) is a common surrogate measure for vessel wall stiffness in‐vivo. 13 Many studies have used PWV to characterize vascular stiffness through a variety of measurement techniques, including tonometry, ultrasound, and phase‐contrast MRI. 13 , 14 , 15 , 16 Recent methodological developments have shown that four‐dimensional (4D) flow MRI can be employed to estimate global PWV of the thoracic aorta. 15 , 16 , 17 A strong dependence of aortic stiffness upon age—with higher PWV values measured in older subjects—has been proposed by several studies. 15 , 18 , 19 , 20 Previous studies in patients with aortopathy found altered elastic properties in aneurysmal subjects. 18 , 21 , 22 However, these studies were limited by restricted age ranges and small cohort sizes. 18 , 21 , 22 Other studies have included larger cohorts with wider age ranges and have observed either no changes to elastic properties or have found elevated PWV in aneurysm patients. 23 , 24 However, these studies also included restricted age ranges or did not systematically control for age‐related elasticity changes, which may have created potential confounders for comparisons of elastic properties between subject groups spanning large age ranges. 23 , 24
The purpose of this study was to investigate global aortic wall stiffness, as measured by 4D flow MRI‐derived PWV, in a cohort of BAV patients with aortic dilatation, adequately sized to control for a wide range of ages and to investigate influences of hemodynamic factors such as AS.
Materials and Methods
All subjects were included in the study according to procedures approved by an Institutional Review Board. Informed consent was obtained prospectively for all healthy subjects. Patients undergoing standard‐of‐care MRI were enrolled by retrospective chart review and waiver of consent.
Study Cohort
An institutional database with cardiothoracic MRI data from 1443 patients undergoing surveillance for aortopathy and/or valve disease and who received an aortic 4D flow MRI between January 2011 and December 2019 was retrospectively queried. Inclusion criteria comprised either TAV or BAV with ascending aortic (AAo) dilatation, defined as a mid‐ascending aorta (MAA) or sinus of Valsalva (SOV) diameter larger than 4.0 cm (as measured in clinical contrast‐enhanced MRI).
Classification of AS used standardized grading taken from blinded standard of care imaging readings (descriptors “none,” “trace,” “mild,” “moderate,” ”severe”) or peak‐velocity (v max) measurements from two‐dimensional (2D) phase‐contrast MRI when clinical grades were not available. The 2D phase‐contrast MRI was acquired in the same session with planes placed below, at and above the aortic valve. Patients with descriptions “none”/“trace” or with v max <2.5 m/sec were categorized “AS−”; those with “mild” or v max measurements 2.5–3 m/sec were “AS+”; and those with “moderate”/“severe” or v max >3 m/sec were “AS++.” Classification of aortic valve regurgitation (AR) was based on clinical reports (descriptors “none,” “mild,” “moderate,” “severe”). Patients with an ejection fraction (EF) under 50% were excluded. Patients with aortic coarctation, dissection, or connective tissue disorders (eg, Marfan's syndrome) were also excluded. No patients with TAV and AS categories AS+/AS++ were included, as only few of those patients matching the inclusion criteria (13 subjects) had images available for analysis.
Cardiothoracic MRI studies from a separate group of prospectively recruited healthy subjects with no known cardiovascular disease (ages 19 to 81 years) were used as healthy control data for this study. A total of 124 control volunteer subjects were included. All volunteer scans were performed between January 2012 and December 2019.
From the aggregate set of subjects, five subject groups were defined as described (Fig. 1): healthy subjects with no known cardiovascular disease (“healthy”), aortopathy patients with normal TAV and no AS (“TAV AS−”), and aortopathy patients with BAV and varying degrees of AS (“BAV AS−/AS+/AS++”).
FIGURE 1.

Study cohort. The cohort for this study was composed of patients with aortopathy and bicuspid aortic valve or tricuspid aortic valve and healthy subjects with tricuspid valves. Patients with bicuspid aortic valve and a range of aortic valve stenosis were included. AS = aortic valve stenosis; AV = aortic valve; BAV = bicuspid aortic valve; TAV = tricuspid aortic valve.
This study identified an initial total number of 312 BAV patients and 213 TAV AS− patients with aortic dilatation based on the inclusion/exclusion criteria. A total of 130 healthy control subjects were identified from the prospectively recruited control database. Thirty‐one BAV patients, five TAV patients, and six healthy controls were excluded due to velocity aliasing in images or PWV estimation errors (resulting from image acquisition artefacts), resulting in a final cohort of 597 subjects (Table 1). The final study cohort comprised 192 TAV patients (age range 19–91 years) with AAo dilatation and without AS (TAV AS−), 171 BAV patients (age range 22–77 years) with AAo dilatation and without AS (BAV AS−), 45 BAV patients (age range 22–76 years) with AAo dilatation and mild AS (BAV AS+), and 65 BAV patients (age range 24–83 years) with AAo dilatation and moderate or greater AS (BAV AS++). The total number of healthy controls with no known cardiovascular disease and normal TAV included was 124.
TABLE 1.
Study Cohort Characteristics
| Healthy Control (n = 124) | TAV AS− (n = 192) | BAV AS− (n = 171) | BAV AS+ (n = 45) | BAV AS++ (n = 65) | P‐Value | |
|---|---|---|---|---|---|---|
| Age (unit: y) |
51 ± 17 [19–81] |
60 ± 13 [19–91]* |
47 ± 13 [22–77]† |
51 ± 13 [22–76]† |
56 ± 13 [24–83]‡ |
<0.001 |
| Sex | 54 F, 70 M | 39 F, 151 M* | 31 F, 140 M* | 10 F, 35 M | 7 F, 58 M* | <0.001 |
| EF (unit: %) | 56 ± 5 | 60 ± 5* | 60 ± 6* | 62 ± 6*,† | 64 ± 6*,†,‡ | <0.001 |
| mAAo (unit: cm) |
2.9 ± 0.38 [2.0–4.6] |
3.7 ± 0.42 [2.7–5.1]* |
4.0 ± 0.50 [2.8–5.4]*,† |
4.3 ± 0.56 [3.2–5.9]*,† |
4.1 ± 0.45 [3.3–5.0]*,† |
<0.001 |
| MAA (unit: cm) | – |
4.0 ± 0.51 [2.7–5.3] |
4.2 ± 0.60 [2.5–5.5]† |
4.5 ± 0.59 [3.4–6.1]†,‡ |
4.4 ± 0.45 [3.3–5.5]† |
<0.001 |
| SOV (unit: cm) | – |
4.3 ± 0.44 [3.1–5.6] |
4.3 ± 0.44 [3.2–5.7] |
4.3 ± 0.45 [3.6–6.0] |
4.1 ± 0.41 [3.3–5.5]†,‡ |
0.0016 |
| AS | – | 192 none/trace | 171 none/trace | 45 mild | 33 moderate, 32 severe | – |
| AR | – | 110 none, 66 mild, 16 moderate | 72 none, 72 mild, 22 moderate, 5 severe† | 15 none, 20 mild, 8 moderate, 2 severe† | 29 none, 21 mild, 11 moderate, 4 severe† | 0.0045 |
| Sievers | – | – | 34 type‐0, 124 type‐1, 9 type‐2, 4 unknown | 10 type‐0, 23 type‐1, 12 type‐2‡ | 10 type‐0, 40 type‐1, 15 type‐2‡ | <0.001 |
Characteristics of age, sex, EF, mAAo, MAA, SOV, AS severity, AR severity, and BAV Sievers type for the study cohort are summarized in mean ± standard deviation or in count as appropriate for each group. Extremal values for each group's age and diameter measures are shown in brackets ([min,max]) below the mean and standard deviations. Cross‐cohort comparison P‐values are from ANOVA (continuous variables) or chi‐square test (categorical variables) as appropriate. Post hoc adjusted pairwise comparison for each demographic variable with significant differences to healthy controls are denoted by *; differences to TAV AS− patients by †; and to BAV AS− patients by ‡ (no post‐hoc differences found for BAV AS+ vs. BAV AS++).
EF = ejection fraction; MAA = maximal‐area ascending aortic diameter; SOV = sinus of valsalva diameter; AS = aortic valve stenosis; AR = aortic valve insufficiency/regurgitation; ANOVA = analysis of variance; mAAo = median ascending aortic diameter; BAV = bicuspid aortic valve; TAV = tricuspid aortic valve.
MRI Acquisition
All MRI exams were performed at 1.5T (Aera/Avanto/Espree, Siemens Healthineers, Erlangen, Germany) or 3T (Skyra, Siemens Healthineers, Erlangen, Germany), including 4D flow MRI and contrast‐enhanced MR angiography of the thoracic aorta. Sequence parameters for 4D flow MRI were field of view = 124–406 × 180–500 × 38–176 mm3, spatial/temporal resolution = 1.2–3.1 × 1.2–3.1 × 1.2–5.0 mm3 / 33–45 msec, velocity encoding (VENC) = 80–500 cm/sec (chosen from flow scout), echo time (TE) = 2.1–3.0 msec, repetition time (TR) = 4.1–5.7 msec, flip angle = 7°–25°, with free breathing/respiratory navigators. Acquisitions were performed with prospective gating using MRI‐compatible ECG leads placed on the subject's chest (577 scans) or retrospective gating (20 scans). Contrast administration for patient scans used Gadavist or Magnevist (Bayer Healthcare, Berlin, Germany), Multihance (Patheon Italia, Ferentino, Italy), Dotarem (Guerbet, Villepinte, France), or Ablavar (Lantheus, North Billerica, MA, USA), or Feraheme (Amag Pharmaceuticals, Waltham, MA, USA). Prospective healthy volunteer studies included 4D flow MRI but not contrast‐enhanced MR angiography.
Data Analysis
Analysis of 4D flow MRI included a previously described pre‐processing workflow with corrections for phase offset errors from Maxwell terms, eddy currents, and velocity aliasing. 25 After pre‐processing, a three‐dimensional (3D) segmentation of the thoracic aorta was created using commercial software (Mimics Innovation Suite 20.0, Materialize, Leuven, Belgium). Quantification of global aortic PWV values was performed using custom software programmed in MATLAB (R2020b, Mathworks, Natick, MA, USA) based on previously reported methodology. 17 Briefly, PWV quantification steps (Fig. 2) included automated creation and placement of aortic centerlines from a modified 3D thinning algorithm applied to the aortic segmentation. 26 Along the centerline, perpendicular analysis planes (4 mm spacing) were placed, with flow‐time curves calculated for each plane. Next, one plane was chosen as a reference plane, and flow transit times were estimated by cross‐correlating flow‐time curves with every other plane's. This was repeated to use every plane as the reference plane. The transit time for plane pairs was taken as the delay that maximized cross‐correlation coefficients of flow‐time curves. Then, from the transit time versus distance relation along the aorta, a linear fit was used to estimate PWV (i.e., fitting PWV = distance/time), and the result was assigned to the given reference plane (Fig. 2, right). Finally, with PWV values for each plane, the median or mean (for Gaussian‐distributed values, with Gaussian distribution determined by Lilliefors test) of all values gave the global PWV estimate. 16
FIGURE 2.
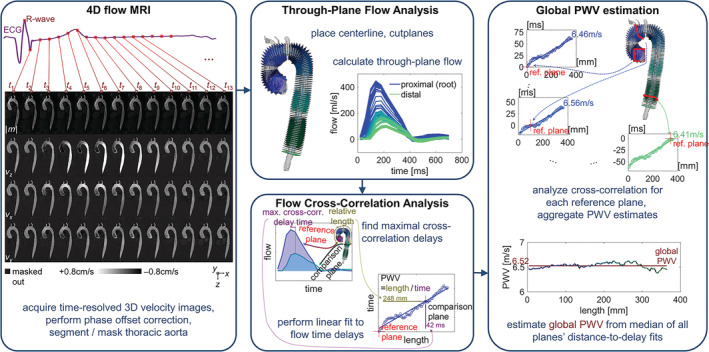
Global pulse‐wave velocity estimation. The computation flow for global PWV estimation included pre‐processing of 4D flow MRI, calculation of through‐plane flow through cross‐sections along the length of the aorta, and cross‐correlation of flow curves and linear fits of the time delays along the length; global PWV was estimated from the fits for all planes. PWV = pulse wave velocity; 4D = four‐dimensional.
The phase contrast velocity images and PWV analyses were examined for errors in all subjects. Full volume and time stacks for phase images were viewed by EJ, KJ, with selected confirmation by MM (2, 4, 18 years' experience respectively). Subjects with residual velocity aliasing were excluded (n = 19). To identify PWV estimation errors, 2D flow‐time curves and cross‐correlation results were examined for confounds, which were defined as missing flow upstroke due to inappropriate ECG trigger delay and incomplete capture of the cardiac cycle or failed midline/planes placement. Subjects with such PWV estimation errors were excluded (n = 4 missing upstroke, n = 6 failed placement).
The MAA and SOV diameters were measured by trained diagnostic radiologists (five different readers, minimum 9 years of experience at institution) blinded to this study. In addition to the measured MAA and SOV diameters, the median AAo diameter (mAAo) was calculated from geometric analysis of the 3D aortic segmentations in the ascending region. 27 The analysis traced the distance along a normal vector at each facet of the segmentation mesh to the opposite mesh surface and estimated median diameter as the median of all AAo distances. The AAo region was defined as extending from the root to the brachiocephalic artery branch point.
A supplemental set of aortic segmentations for a random subset of subjects was created for the purpose of assessing reproducibility of PWV quantification by using them as input to the same automated PWV analysis described earlier (Fig. 2). The random subset of subjects was drawn by uniform random distribution from across all subject categories (23% of total subjects, n = 141 subjects), and it included 32 healthy subjects, 59 BAV subjects, and 50 TAV subjects. All segmentations were created by a pool of four observers (PhD/MD/graduate‐student researchers, 2–8 years experience) using the same software (Mimics Innovation Suite 20.0, Materialize, Leuven, Belgium).
Statistical Analysis
Patient demographics and global aortic PWV were compared across subject groups (healthy, BAV AS−/+/++, TAV AS−) by Kruskal‐Wallis analysis of variance (ANOVA) test (for continuous variables) or Chi‐squared test (categorical variables). Post‐hoc testing of demographic variables used Tukey's test. Additionally, PWV values for subject groups were compared by Kruskal‐Wallis ANOVA testing separately for the six age decades (<30, 30–40, 40–50, 50–60, 60–70, >70 years). These age ranges were selected to allow for granular, age‐dependent comparison without under‐powering the statistical results. Post‐hoc pairwise testing for differences between subject groups within each age decade used student's t‐test or Mann–Whitney U tests (as appropriate from Lilliefors test). Bonferroni correction was applied to adjust for multiple comparisons, with a level of statistical significance of P < 0.01.
Multiple linear regression analysis was performed with age and diameter or EF as independent predictors of global aortic PWV for each subject group separately (significance level 0.05). Aortic diameter metrics were also tested in regression analysis for each group. For BAV patients, analysis of covariance (ANCOVA) was performed for PWV with categorical classification of AS (AS−, AS+, and AS++), controlling for age as a covariate. Tests including BAV Sievers type, AR, or MAA as the independent variables were conducted, both without and with additional control for AS severity (same classification). All statistical analysis was performed in MATLAB (R2020b, Mathworks, Natick, MA, USA).
Analysis of the reproducibility of PWV quantification was conducted by creating Bland–Altman plots and calculating limits of agreement (LoA) and intra‐class correlation coefficients (ICCs) from pairs of PWV values. The pairings used were PWV quantification for any given subject's segmentation generated by the first observer compared to that from the second observer.
Results
Study Cohort Demographic Variations
The demographic characteristics are summarized in Table 1. Age distributions differed significantly between cohorts. Post‐hoc testing showed that TAV AS− patients were older compared to healthy controls and BAV groups were younger compared to the TAV AS− cohort. EFs were in normal ranges for all subject groups but differed significantly between healthy controls and the TAV and BAV cohorts (Table 1). The mAAo dimensions were consistently larger for all BAV groups (AS−, AS+, and AS++) compared to the TAV AS− patients and healthy controls. In addition, BAV patients presented with more severe AR compared to the TAV AS− group. Finally, distributions of sex were different between patients and healthy controls, but no significant PWV differences were found in post‐hoc testing by sex within subject groups and age decades (healthy cohort: P = 0.10–0.97, BAV AS−: P = 0.07–0.80, BAV AS+: P = 0.27–0.90, BAV AS++: P = 0.37–0.88, TAV AS−: P = 0.30–0.93).
Global Aortic PWV—Relationships with Age, Aortic Dimensions, Valve Function/Type
Correlation analysis revealed significant positive relationships between increased age and elevated global aortic PWV (r = 0.65). Similar associations of aortic stiffness with age were also observed for all five subject groups individually (r = 0.55–0.68; Fig. 3a). In addition, increased mAAo was significantly correlated with higher aortic PWV for healthy controls (r = 0.53; Fig. 3b, i) and TAV AS− patients (r = 0.21; Fig. 3b, ii). However, no significant associations (P = 0.38–0.91) of stiffness and aortic dimensions (MAA, SOV, or mAAo) were observed in any BAV patient group (Fig. 3b, iii–v). Significant relationships between mAAo and age (Fig. 3c) were observed in healthy subjects (r = 0.61) and patients of the TAV and BAV AS− groups (TAV: r = 0.36; BAV AS−: r = 0.24).
FIGURE 3.
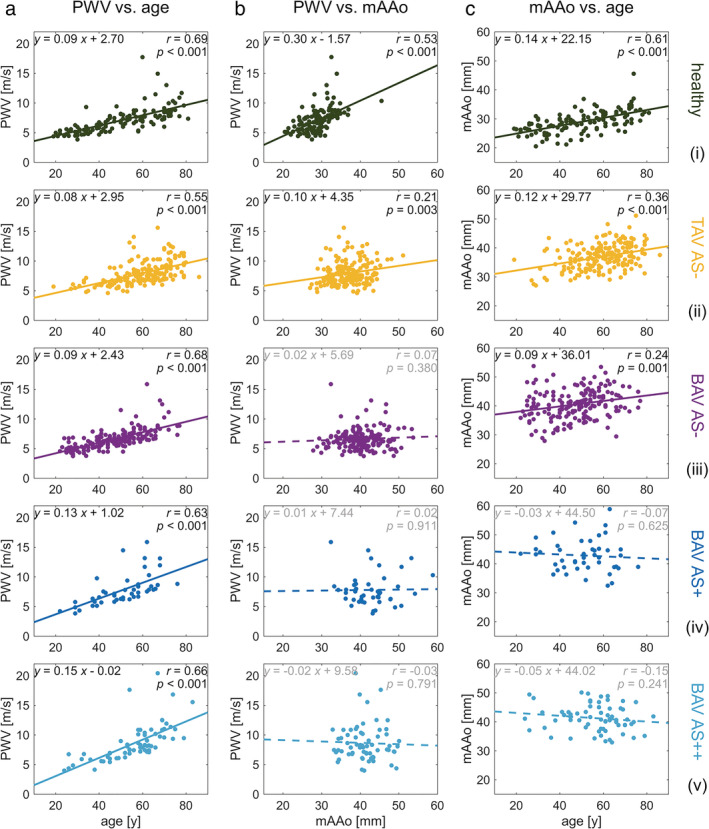
Relations of pulse wave velocity, age, and aortic dimension. Linear correlations between PWV, age, and mAAo are shown (a–c) for the healthy control subjects and the four patient groups (top to bottom). Pearson correlation coefficient (r) values are shown along with a solid line fit for correlations showing statistical significance (P < 0.05) or a dashed line for correlations without statistical significance. PWV = pulse wave velocity; mAAo = median ascending aortic diameter.
Regression analysis showed that age was the strongest association with increased PWV for all five subject groups (adjusted‐R 2 0.38–0.48; Table 2). For healthy controls increased mAAo diameter was also associated with higher PWV in the same regression analysis. In all other subject groups (TAV and BAV patients), no significant association (P = 0.08–0.77; Table 2) between any measure of aortic diameter (MAA, SOV, or mAAo) and PWV were found.
TABLE 2.
Associations of Age and Aortic Dimensions with PWV
| Healthy | TAV | BAV AS− | BAV AS+ | BAV AS++ | ||||||
|---|---|---|---|---|---|---|---|---|---|---|
| [m/sec Per Unit] | P | [m/sec Per Unit] | P | [m/sec Per Unit] | P | [m/sec Per Unit] | P | [m/sec Per Unit] | P | |
| Age [unit: y] | 0.073 | <1E–10 | 0.082 | <1E–13 | 0.092 | <1E–23 | 0.134 | <1E–5 | 0.156 | <2E–9 |
| mAAo [unit: mm] | 0.10 | 0.03 | 0.0087 | 0.77 | −0.034 | 0.083 | 0.031 | 0.59 | 0.045 | 0.50 |
| Model fit |
Adj.‐R 2 = 0.48 P = 1.57E–18 |
Adj.‐R 2 = 0.30 P = 1.31E–15 |
Adj.‐R 2 = 0.46 P = 1.42E–23 |
Adj.‐R 2 = 0.37 P = 2.40E–5 |
Adj.‐R 2 = 0.43 P = 1.33E–8 |
|||||
Effect parameter values for PWV regressed against age and mAAo are shown with significance test P values for the healthy cohort and patient groups; coefficients without significance level P < 0.05 are in italic.
mAAo = median ascending aortic diameter; BAV = bicuspid aortic valve; TAV = tricuspid aortic valve; AS = aortic valve stenosis.
In the analysis restricted to BAV patients, ANCOVA revealed a significant relationship between AS severity and increased PWV (R 2 = 0.48, age as covariate). The increase of PWV was higher for patients with more severe stenosis (AS+: 0.77 m/sec increase; AS++: 1.00 m/sec increase). Tests for influence upon PWV of BAV Sievers type, AR grade, or MAA diameter showed no significance (P = 0.30–0.87; Table 3), either when controlling for or not controlling for AS severity (Table 3).
TABLE 3.
Influence of Regurgitation, Valve Morphology, Aortic Diameter Upon PWV
| Controlled for Age | Controlled for Age and AS | |||
|---|---|---|---|---|
| Effect | Significance | Effect | Significance | |
| AR [m/sec] |
−0.32 (mild) −0.07 (moderate) −0.05 (severe) |
n.s. (P = 0.59) |
−0.31 (mild) −0.18 (moderate) −0.23 (severe) |
n.s. (P = 0.60) |
| MAA [m/sec per mm] | +0.0032 |
n.s. (P = 0.87) |
−0.0063 |
n.s. (P = 0.73) |
| Sievers [m/sec] |
+0.16 (type‐0) −0.23 (type‐1) +0.08 (type‐2) |
n.s. (P = 0.30) |
+0.29 (type‐0) −0.06 (type‐1) −0.24 (type‐2) |
n.s. (P = 0.31) |
| Co‐variate(s) | Age: 0.12 m/sec per year (P < 0.005) |
Age: 0.11 m/sec per year (P < 0.005) AS: 0.77 m/sec [AS+], 1.0 m/sec [AS++] (P < 0.005) |
||
Tests in ANCOVA for the influence of regurgitation (AR), aortic diameter (MAA), and BAV morphology (Sievers type) upon PWV for BAV patients (any AS status) show no significant effects (all above 0.05 test threshold) for any, with or without controlling for AS severity.
BAV = bicuspid aortic valve; MAA = maximal‐area ascending aortic diameter; AS = aortic valve stenosis; AR = aortic valve insufficiency/regurgitation; ANCOVA = analysis of variance; PWV = pulse wave velocity.
Global Aortic PWV—BAV vs. TAV Aortopathy vs. Healthy Comparisons per Age Decade
Figure 4 shows the distribution of global aortic PWV for all five groups arranged by age decade grouping (six groupings). For all groups, the median global PWV in any given age decade was higher compared to the previous decade (eg, median for healthy <30 years: 4.9 m/sec, for 30–40 years: 5.4 m/sec, for 40–50 years: 6.3 m/sec, for 50–60 years: 7.3 m/sec, for 60–70 years: 7.8 m/sec, for ≥70 years; 8.5 m/sec), indicative of a strong association between aortic stiffness and age. In the absence of AS, PWV was similar for BAV patients (BAV AS−), TAV patients (TAV AS−), and healthy controls across all six age decades. In contrast, older BAV patients with mild (BAV AS+) or moderate to severe stenosis (BAV AS++) in the group of patients over 50 years of age demonstrated a trend toward elevated aortic PWV. These differences were significant for BAV AS++ compared to BAV AS− patients in the decade of 50 to 60 years (8.7 ± 2.6 m/sec vs. 7.1 ± 1.2 m/sec) and compared to healthy controls in the patients ≥70 years of age (11.8 ± 2.7 m/sec vs. 9.1 ± 1.4 m/sec).
FIGURE 4.

Global pulse wave velocity value distributions across subject groups by age range. Distribution of global PWV in 10‐year age ranges are shown for healthy subjects (green), TAV patients with AAo dilatation (yellow), BAV patients with AAo dilatation and no/trace AS (purple), mild AS (dark blue), and moderate/severe AS (light blue). Hypothesis‐testing P values are annotated for inter‐group comparisons with significance level 0.01 (Bonferroni correction for five groups). PWV = pulse wave velocity; TAV = tricuspid aortic valve; AAo = ascending aorta/aortic; BAV = bicuspid aortic valve; AS = aortic valve stenosis.
Reproducibility of PWV Measures
The mean difference for PWV quantification performed from different pairs of aortic segmentations was −0.01 m/sec, with 1.96 standard deviation LoA of [−0.29,0.27] (Fig. 5). The ICC for paired quantifications was 0.993.
FIGURE 5.

Inter‐observer comparison for PWV calculation. Segmentations from multiple observers for a subgroup of subjects were collected (left), and the automated PWV calculation method (center) was applied to each segmentation. The inter‐observer comparison for PWV (right) is shown with limits of agreement (right, dashed lines) and intra‐class correlation coefficients (right). PWV = pulse wave velocity; ICC = intra‐class correlation coefficient.
Discussion
This study systematically analyzed the impact of age, valve type (congenital BAV versus TAV), aortic dilatation, and aortic valve dysfunction (AS and AR) on changes in global aortic stiffness as quantified by PWV derived from 4D flow MRI derived. The main findings were 1) older age showed the strongest association with increased PWV across all cohorts and subject groups (healthy, BAV AS−, BAV AS+, BAV AS++, TAV AS−); 2) no differences in aortic stiffness were observed between BAV patients without valve dysfunction compared to healthy controls or patients with aortic dilatation and normal TAV; 3) in BAV patients, accounting for age, AS severity was associated with elevated PWV; and 4) the extent of aortic dilatation (aortic dimension) was not associated with changes in global aortic PWV, despite an association observed between aortic dimension and PWV in healthy controls. The results may suggest that BAV is not associated with altered global aortic stiffness in the absence of valve dysfunction, specifically AS, and that age is a main contributing factor to increased MRI‐derived PWV, irrespective of valve type and aortic dilatation. In this regard, the development of AS, and thus altered flow characteristics, may contribute to changes in aortic wall architecture and thus elevated PWV in BAV patients. More severe AS was associated with more elevated PWV in these patients, while AR severity was not associated with PWV changes.
Global Aortic PWV—Relationships with Age
Aortic stiffness is known to increase with age, and this relationship has been demonstrated in many studies using varied measurement methods. 17 , 18 , 19 , 20 In this study, the cohort size permitted sub‐grouping of subjects into 10‐year ranges when comparing PWV across subject types (healthy, BAV/TAV patients). Our findings related to aortic PWV and age compare well with other studies with smaller cohort sizes. For example, correlation coefficients and regression slopes reported in our study for PWV versus age in healthy subjects are similar to those reported in other studies using MRI, ultrasound or tonometry but with smaller cohort sizes (r = 0.78, 0.61; m = 0.065, 0.097 m/sec/year). 15 , 19 , 28 , 29
Tissue‐Innate vs. Hemodynamic Contributions to BAV Aortopathy
Our findings may indicate that PWV in BAV patients with aortic dilatation without AS is not different compared to PWV of non‐BAV controls, despite known baseline differences of elastic media in the aortic wall for BAV patients. 4 , 12 This suggests that genetically induced wall tissue changes for BAV patients might not generally coincide with globally altered aortic wall stiffness, to the extent that it can be measured with PWV quantification from MRI. In contrast, BAV patients with AS exhibited globally altered PWV at older age. Moreover, controlling for age, BAV patients demonstrated a significant relationship between AS severity and increased PWV. Other aortic valve characteristics such as AR or Sievers type were not associated with elevated PWV. Thus, changes in aortic stiffness in this BAV group may be associated with high velocity valve flow jets that impinge upon the aortic wall. These altered flow characteristics have been associated with increased wall shear stress and degradation of medial wall fibers that contribute to elastic deformation in response to pulsatile blood pressure. 8 , 9 Prior studies have also demonstrated significant changes to AAo flow (flow angulation, elevated wall shear stress) even for BAV patients with normal aortic valve function. 30 , 31
It was unexpected that stiffness for BAV patients without AS was not altered, as we had hypothesized. We speculate that BAV‐mediated flow changes in patients without additional valve dysfunction (AS) may still be below the threshold that would inflict sufficient wall tissue damage or be below a limit that is detectable by MRI‐derived PWV measurements. Additionally, the wall remodeling processes, including loss of elastic fibers and replacement by collagen, do not occur instantaneously, and it may be that any wall tissue damage resulting from BAV‐mediated abnormal flow does not manifest as observable increased stiffness initially. 12 , 32 The presence of AS may exacerbate changes in aortic 3D flow dynamics, thereby leading to altered wall stiffness over time, i.e. at older age to the point that we were able to observe differences in older patients.
Associations of Age, Dimensions and Stenosis with Global Aortic PWV Increases
In theory, PWV depends both on the elastic modulus and the vessel diameter. 16 However, aortic dilatation and thus varying dimensions, i.e. varying aortic radius, along the aorta complicate this relationship in reality. 16 While no associations of PWV with aortic diameter were observed in our patient cohorts, aortic diameter variations within groups can be heterogeneous and complex. It is known that the development of aortopathy is associated with tissue remodeling (changes in elastin and collagen structure). 8 , 9 , 18 These changes may affect the regional aorta wall elastic modulus that could counterbalance local geometric changes (dilatation). As a result, no net effect on PWV from the aortic diameter itself is observed. For BAV patients, with a spectrum of valve dysfunction, the observed effects of AS upon increased PWV are consistent with observations in earlier studies that showed disruption of elastin fiber architecture caused by abnormal aortic flow. 8 , 9 However, the PWV is expected to increase, as the stiffness (elastic modulus) increases due to reduced load‐bearing potential from fragmented elastin. 8 , 18 In our study cohort, increased stiffness was primarily associated with AS, and significant influences upon stiffness from AR or valve type were not observed.
There have been several studies of aortic stiffness in patients with thoracic or abdominal aortic aneurysm, although comparatively few studies focus on patients with thoracic aortopathy. 18 , 33 Previous studies of PWV in patients with aortic aneurysms have found differing trends and associations, with some reporting PWV in aneurysmal patients to be increased. 8 , 24 , 34 However, other previous work has reported no differences in PWV or decreases. 23 , 33 In some cases, the divergent findings may be a result of the inability to control adequately for known covariates, such as age, which was done in the present study. For example, previous studies included wider age (>20 years) ranges or older patient groups 23 , 24 in comparisons across subject groups. Another study in a larger number of aortic aneurysm patients with BAV, TAV, or Marfan's syndrome and controls for age variation found no differences in PWV between BAV and TAV patients. 35 However, patients with more than mild aortic valve stenosis or regurgitation were excluded from that study. 35
Other studies that focused on BAV and TAV patients matched for AS status have found overlaps between stiffness measurements between the two patient groups. 36 , 37 Additionally, in comparisons between BAV and TAV patients with moderate to severe AS, aortic diameters for BAV patients were found to be larger but similarly stiff to those of TAV patients. 36 These results are consistent with our findings: across age ranges, aortic PWV values for BAV AS− and TAV AS− patients were similar; and in our patient groups, aortic PWV was mostly not associated with diameter. Taken together, these results may indicate a potentially close link between stiffness and hemodynamics, but a more complex relationship between flow function and progressive aortic dilation.
Limitations
Our study was based on the quantification of PWV as a measure of global aortic stiffness. However, BAV‐mediated aortic flow changes are known to manifest regionally, for example with locally elevated wall shear stress. 30 , 38 Further study of localized measures of aortic stiffness would thus be valuable to develop a better understanding of relationships between regional changes in flow and stiffness. For example, early local changes in biomechanical properties of the aortic wall may manifest before a global elevation of PWV occurs. 12 , 32 The technique for PWV measurement used in our study (aortic 4D flow MRI) is suitable for the quantification of global PWV. However, methodological constraints related to the temporal resolution of 4D flow MRI make detection of flow transit times over shorter segments of the aorta challenging. The need for multiple bipolar encoding gradients to acquire 3D velocity information sets a relatively high minimum on achievable temporal resolution (tens of msec) for 4D flow MRI. Additionally, given the retrospective nature of our study, our quantification of PWV is potentially affected by variable precision resulting from varied acquisition parameters such as gradient hardware performance, which affects achievable temporal resolution, and VENC setting, which affects both velocity SNR and temporal resolution. The influence of these varied settings is manifest across our cohorts, however, so in aggregate we do not expect our results to be affected by any systemic bias. Alternative imaging techniques, such as 2D phase‐contrast MRI with high (millisecond‐order) temporal resolution, implemented with well‐defined inter‐plane distance measurements, or such as single‐plane flow‐versus‐area quantification, are promising options for achieving high‐fidelity localized PWV quantification. 39 However, these methods may be more susceptible to user‐dependent acquisition settings, namely placement of measurement planes, than full volumetric acquisitions are, which can pose challenges for large‐scale PWV studies. Using measurement methods attuned to local properties could be better sensitized to reveal the relationship between altered flow and altered vessel biomechanics.
Our retrospective analysis used a broad categorization of AS severity, and it did not include information about other aspects of valve dysfunction, such as when subjects developed AS relative to PWV measurements. Additionally, our study did not include TAV patients with AS, as they were rare in our database, and we were unable to construct an adequately sized cohort for parallel comparison. Incorporating more detailed description of AS, such as number of years present or rate of severity progression, or incorporating serial follow‐up PWV measurements, could help reveal more details about the interaction between pathological flow and longitudinal changes in vessel wall properties.
In assembling a cohort of subjects with varying disease statuses, it can be challenging to match demographic factors such as age and sex or comorbidities. This study included a comparatively large number of subjects, allowing for subgrouping to mitigate the influence of demographics on the analysis, but in some cases (eg, <30 years TAV AS− patients) only small numbers of subjects were available for comparison. This limits the power of comparisons for those subgroups, and an expanded study with more subjects in these smaller subgroups is warranted to confirm our findings. Additionally, arterial stiffening is known to be sexually dimorphic. 40 However, only slight differences of PWV by sex were present in our data, and we did not incorporate sex into our analysis.
Conclusion
Significant associations between increased age and elevated PWV were observed for all BAV and TAV subject groups. Minimal differences were found between non‐stenotic BAV patients and either healthy subjects or non‐stenotic TAV patients, which may indicate that the known genetic and aortic wall tissue differences of BAV patients do not necessarily coincide with altered global aortic stiffness. In contrast, BAV patients with AS exhibited globally altered PWV at older age, and the degree of AS was directly associated with elevated PWV. These findings might indicate that, in addition to age, AS‐mediated abnormal aortic flow conditions may induce changes in aortic wall properties and stiffness.
Contract grant sponsor: NIH (R01HL115828, R01HL133504, F30HL145995, TL1TR001423); American Heart Association (20CDA35310687); Melman Bicuspid Aortic Valve Program, Bluhm Cardiovascular Institute.
References
- 1. Otto CM, Nishimura RA, Bonow RO, et al. 2020 ACC/AHA Guideline for the Management of Patients With Valvular Heart Disease. J Am Coll Cardiol 2021;77(4):e25‐e197. [DOI] [PubMed] [Google Scholar]
- 2. Cripe L, Andelfinger G, Martin LJ, Shooner K, Benson DW. Bicuspid aortic valve is heritable. J Am Coll Cardiol 2004;44(1):138‐143. [DOI] [PubMed] [Google Scholar]
- 3. Siu SC, Silversides CK. Bicuspid aortic valve disease. J Am Coll Cardiol 2010;55(25):2789‐2800. [DOI] [PubMed] [Google Scholar]
- 4. Bauer M, Pasic M, Meyer R, et al. Morphometric analysis of aortic media in patients with bicuspid and tricuspid aortic valve. Ann Thorac Surg 2002;74(1):58‐62. [DOI] [PubMed] [Google Scholar]
- 5. Nistri S, Grande‐Allen J, Noale M, et al. Aortic elasticity and size in bicuspid aortic valve syndrome. Eur Heart J 2008;29(4):472‐479. [DOI] [PubMed] [Google Scholar]
- 6. Mahadevia R, Barker AJ, Schnell S, et al. Bicuspid aortic cusp fusion morphology alters aortic three‐dimensional outflow patterns, wall shear stress, and expression of aortopathy. Circulation 2014;129(6):673‐682. [DOI] [PMC free article] [PubMed] [Google Scholar]
- 7. Charitos EI, Stierle U, Petersen M, et al. The fate of the bicuspid valve aortopathy after aortic valve replacement. Eur J Cardiothorac Surg 2014;45(5):e128‐e135. [DOI] [PubMed] [Google Scholar]
- 8. Guzzardi DG, Barker AJ, Van Ooij P, et al. Valve‐related hemodynamics mediate human bicuspid aortopathy: Insights from wall shear stress mapping. J Am Coll Cardiol 2015;66(8):892‐900. [DOI] [PMC free article] [PubMed] [Google Scholar]
- 9. Bollache E, Guzzardi DG, Sattari S, et al. Aortic valve‐mediated wall shear stress is heterogeneous and predicts regional aortic elastic fiber thinning in bicuspid aortic valve‐associated aortopathy. J Thorac Cardiovasc Surg 2018;156(6):2112‐2120. [DOI] [PMC free article] [PubMed] [Google Scholar]
- 10. Girdauskas E, Borger MA, Secknus M‐A, Girdauskas G, Kuntze T. Is aortopathy in bicuspid aortic valve disease a congenital defect or a result of abnormal hemodynamics? A critical reappraisal of a one‐sided argument. Eur J Cardiothorac Surg 2011;39(6):809‐814. [DOI] [PubMed] [Google Scholar]
- 11. Sievers H‐H, Sievers HL. Aortopathy in bicuspid aortic valve disease — Genes or hemodynamics? Or Scylla and Charybdis? Eur J Cardiothorac Surg 2011;39(6):803‐804. [DOI] [PubMed] [Google Scholar]
- 12. Yassine NM, Shahram JT, Body SC. Pathogenic mechanisms of bicuspid aortic valve Aortopathy. Front Physiol 2017;8:687. [DOI] [PMC free article] [PubMed] [Google Scholar]
- 13. Pannier BM, Avolio AP, Hoeks A, Mancia G, Takazawa K. Methods and devices for measuring arterial compliance in humans. Am J Hypertens 2002;15(8):743‐753. [DOI] [PubMed] [Google Scholar]
- 14. Cavalcante JL, Lima JAC, Redheuil A, Al‐Mallah MH. Aortic stiffness. J Am Coll Cardiol 2011;57(14):1511‐1522. [DOI] [PubMed] [Google Scholar]
- 15. Markl M, Wallis W, Brendecke S, Simon J, Frydrychowicz A, Harloff A. Estimation of global aortic pulse wave velocity by flow‐sensitive 4D MRI. Magn Reson Med 2010;63(6):1575‐1582. [DOI] [PubMed] [Google Scholar]
- 16. Wentland AL, Grist TM, Wieben O. Review of MRI‐based measurements of pulse wave velocity: A biomarker of arterial stiffness. Cardiovasc Diagn Ther 2014;4(2):193. [DOI] [PMC free article] [PubMed] [Google Scholar]
- 17. Jarvis K, Soulat G, Scott M, et al. Investigation of aortic wall thickness, stiffness and flow reversal in patients with cryptogenic stroke: A 4D flow MRI study. J Magn Reson Img 2021;53(3):942‐952. [DOI] [PMC free article] [PubMed] [Google Scholar]
- 18. Länne T, Sonesson B, Bergqvist D, Bengtsson H, Gustafsson D. Diameter and compliance in the male human abdominal aorta: Influence of age and aortic aneurysm. Eur J Vasc Surg 1992;6(2):178‐184. [DOI] [PubMed] [Google Scholar]
- 19. Rogers WJ, Hu YL, Coast D, et al. Age‐associated changes in regional aortic pulse wave velocity. J Am Coll Cardiol 2001;38(4):1123‐1129. [DOI] [PubMed] [Google Scholar]
- 20. Ohyama Y, Teixido‐Tura G, Ambale‐Venkatesh B, et al. Ten‐year longitudinal change in aortic stiffness assessed by cardiac MRI in the second half of the human lifespan: The multi‐ethnic study of atherosclerosis. Eur Heart J Cardiovasc Imaging 2016;17(9):1044‐1053. [DOI] [PMC free article] [PubMed] [Google Scholar]
- 21. Azadani AN, Chitsaz S, Mannion A, et al. Biomechanical properties of human ascending thoracic aortic aneurysms. Ann Thorac Surg 2013;96(1):50‐58. [DOI] [PubMed] [Google Scholar]
- 22. Niestrawska JA, Regitnig P, Viertler C, Cohnert TU, Babu AR, Holzapfel GA. The role of tissue remodeling in mechanics and pathogenesis of abdominal aortic aneurysms. Acta Biomater 2019. Apr;88:149‐161. [DOI] [PubMed] [Google Scholar]
- 23. Bailey MA, Davies JM, Griffin KJ, et al. Carotid‐femoral pulse wave velocity is negatively correlated with aortic diameter. Hypertens Res 2014;37(10):926‐932. [DOI] [PubMed] [Google Scholar]
- 24. Abbas A, Cecelja M, Hussain T, et al. Thoracic but not abdominal phase contrast magnetic resonance‐derived aortic pulse wave velocity is elevated in patients with abdominal aortic aneurysm. J Hypertens 2015;33(5):1032‐1038. [DOI] [PubMed] [Google Scholar]
- 25. Bock J, Kreher B, Hennig J, Markl M. Optimized pre‐processing of time‐resolved 2D and 3D phase contrast MRI data. In: Proceedings of the 15th Annual meeting of ISMRM, Berlin, Germany. 2007.
- 26. Lee TC, Kashyap RL, Chu CN. Building skeleton models via 3‐D medial surface axis thinning algorithms. CVGIP: Graphical Models and Image Processing 1994;56(6):462‐478. [Google Scholar]
- 27. Scott MB, Huh H, van Ooij P, et al. Impact of age, sex, and global function on normal aortic hemodynamics. Magn Reson Med 2020;84(4):2088‐2102. [DOI] [PMC free article] [PubMed] [Google Scholar]
- 28. Doupis J, Papanas N, Cohen A, McFarlan L, Horton E. Pulse wave analysis by applanation tonometry for the measurement of arterial stiffness. Open Cardiovasc Med J 2016;10(1):188‐195. [DOI] [PMC free article] [PubMed] [Google Scholar]
- 29. Vappou J, Luo J, Okajima K, Di Tullio M, Konofagou E. Aortic pulse wave velocity measured by pulse wave imaging (PWI): A comparison with applanation tonometry. Artery Res 2011;5(2):65. [DOI] [PMC free article] [PubMed] [Google Scholar]
- 30. Barker AJ, Markl M, Bürk J, et al. Bicuspid aortic valve is associated with altered wall shear stress in the ascending aorta. Circ Cardiovasc Imaging 2012;5(4):457‐466. [DOI] [PubMed] [Google Scholar]
- 31. Rodríguez‐Palomares JF, Dux‐Santoy L, Guala A, Kale R, Maldonado G, Teixidó‐Turà G, Galian L, Huguet M, Valente F, Gutiérrez L, González‐Alujas T, Johnson KM, Wieben O, García‐Dorado D, Evangelista A Aortic flow patterns and wall shear stress maps by 4D‐flow cardiovascular magnetic resonance in the assessment of aortic dilatation in bicuspid aortic valve disease. J Cardiovasc Magn Reson 2018:20(1)28, 20. [DOI] [PMC free article] [PubMed] [Google Scholar]
- 32. Tronc F, Mallat Z, Lehoux S, Wassef M, Esposito B, Tedgui A. Role of matrix metalloproteinases in blood flow–induced arterial enlargement: Interaction With NO. Arterioscler Thromb Vasc Biol 2000;20(12):e120‐e126. [DOI] [PubMed] [Google Scholar]
- 33. Lee CW, Sung SH, Chen CK, et al. Measures of carotid‐femoral pulse wave velocity and augmentation index are not reliable in patients with abdominal aortic aneurysm. J Hypertens 2013;31(9):1853‐1860. [DOI] [PubMed] [Google Scholar]
- 34. Kröner ES, Westenberg JJ, Kroft LJ, Brouwer NJ, van den Boogaard PJ, Scholte AJHA. Coupling between MRI‐assessed regional aortic pulse wave velocity and diameters in patients with thoracic aortic aneurysm. Neth Heart J 2015;23(10):493‐501. [DOI] [PMC free article] [PubMed] [Google Scholar]
- 35. Guala A, Rodriguez‐Palomares J, Dux‐Santoy L, et al. Influence of aortic dilation on the regional aortic stiffness of bicuspid aortic valve assessed by 4‐dimensional flow cardiac magnetic resonance. JACC Cardiovasc Imaging 2019;12(6):1020‐1029. [DOI] [PubMed] [Google Scholar]
- 36. Singh A, Horsfield MA, Bekele S, et al. Aortic stiffness in aortic stenosis assessed by cardiovascular MRI: A comparison between bicuspid and tricuspid valves. Eur Radiol 2019;29(5):2340‐2349. [DOI] [PMC free article] [PubMed] [Google Scholar]
- 37. Pascaner AF, Houriez‐Gombaud‐Saintonge S, Craiem D, et al. Comprehensive assessment of local and regional aortic stiffness in patients with tricuspid or bicuspid aortic valve aortopathy using magnetic resonance imaging. Int J Cardiol 2021. Mar;326:206‐212. [DOI] [PubMed] [Google Scholar]
- 38. Sun L, Chandra S, Sucosky P. Ex vivo evidence for the contribution of hemodynamic shear stress abnormalities to the early pathogenesis of calcific bicuspid aortic valve disease. PLoS One 2012;7(10):e48843. [DOI] [PMC free article] [PubMed] [Google Scholar]
- 39. Vulliémoz S, Stergiopulos N, Meuli R. Estimation of local aortic elastic properties with MRI: Estimation of local aortic elastic properties. Magn Reson Med 2002;47(4):649‐654. [DOI] [PubMed] [Google Scholar]
- 40. Ogola BO, Zimmerman MA, Clark GL, et al. New insights into arterial stiffening: Does sex matter? Am J Physiol Heart Circ Physiol 2018;315(5):H1073‐H1087. [DOI] [PMC free article] [PubMed] [Google Scholar]