Abstract
Introduction:
Although phonatory glottal posture and airflow pulse shape affect voice quality, studies to date have been limited by visualization of vocal fold (VF) vibration from a superior view. We performed 3D reconstruction of VF vibratory motion during phonation from a medial view and assessed glottal volume waveform and resulting acoustics as a function of neuromuscular stimulation.
Study Design:
In vivo canine hemilarynx phonation.
Methods:
Across 121 unique combinations of superior laryngeal nerve (SLN) and recurrent laryngeal nerve (RLN) stimulation, the hemilarynx was excited to oscillation with airflow. VF medial surface reference points were tracked on high-speed video, mapped into 3D space, and surface shape was restored using cubic spline interpolation. Glottal surface shape, reconstruction-based parameters, and glottal volume waveform were calculated. Fundamental frequency (F0), cepstral peak prominence (CPP), and harmonic amplitude (H1-H2) were measured from high-quality audio samples.
Results:
The glottis was convergent during opening and divergent during closing. Neuromuscular activation changed phonatory glottal shape and reduced glottal volume. Significant reduction in glottal volume and closing quotient were present with SLN stimulation. RLN stimulation significantly increased F0 and CPP and decreased H1-H2 (constricted glottis), while SLN effects were similar and synergistic with concurrent RLN stimulation.
Conclusion:
3D reconstruction of in vivo medial surface vibration revealed effects of laryngeal nerve stimulation on glottal vibratory pattern and acoustic correlates of voice quality. SLN activation resulted in significantly quicker glottal closure per cycle, decreased glottal volume, and higher-pitched, less breathy, and less noisy voice. RLN had a similar effect on acoustic measures.
Keywords: in vivo canine phonation, vocal fold medial surface, hemilarynx, voice quality, glottal volume waveform, vocal fold vibration
INTRODUCTION
Understanding vocal fold (VF) vibratory patterns and glottal shape changes is fundamental to voice production research and treatment of voice disorders.1,2,3 In the source-filter model,2,4 glottal modulation of airflow is the source of voice, and the shape (waveform) and velocity of the individual glottal airflow pulse is intimately linked to voice quality.5 Previous methodologies used to measure, visualize, and quantify flow in the form of volume velocity, i.e. the rate at which airflow passes a specified area, such as Rothenberg’s inverse filtering and hot-wire anemometry, have different limitations. Rothenberg’s inverse filtering6,7,8 of radiated pressure waveform at the lips provides only an estimation of glottal volume velocity, and results can be error prone due to methodological assumptions. Hot wire anemometry in constant temperature mode measures the volume velocity 1 cm above the glottis in the midline plane and can be inaccurate when the flow is moving slowly, such as during the closed phase.9 More recent approaches include high-speed particle imaging velocimetry10 (PIV), a more precise 2D visualization method, and tomographic PIV.11 In contrast to prior techniques, tomographic PIV is a validated 3D visualization method.11,12 Still, as flow is measured outside of the glottis, only indirect conclusions can be drawn regarding intraglottal vibratory movement.
A direct visualization of vocal fold medial surface oscillation is challenging, as prior attempts to visualize the vocal folds have largely utilized a superior endoscopic view. High-speed video (HSV) of laryngeal vibration from a transoral view by Bell Labs13 and various supraglottic and subglottic views have been used in ex vivo phonation studies, such as by Baer14 in 1975 and Yumoto15 in 1993. These have established the current paradigm of phonatory glottal shape changes. As subglottal pressure applied to the closed glottis reaches phonation onset pressure, the VFs start to separate from inferior to superior until the upper lips separate and the glottis fully opens. After reaching maximal lateral excursion, the VFs start closing, also from inferior to superior. Thus, the glottis shape is convergent during opening, divergent during closing, and rectangular somewhere in the mid-glottal cycle. However, this basic oscillatory paradigm has remained largely unexplored experimentally or computationally.
One methodology to fully visualize the entire medial surface during both opening and closing glottal phases is to record VF vibration in a hemilarynx from a medial viewpoint using HSV. Döllinger et al. used this methodology, but results were limited by vibrational instabilities in an ex vivo human larynx study16 and inability to stimulate laryngeal nerves in a graded manner in an in vivo canine larynx study17. The present study combines an in vivo canine hemilarynx phonation, graded stimulation of the recurrent laryngeal nerve (RLN) and superior laryngeal nerve (SLN), and 3D reconstruction of medial surface to recreate the glottal cycle shape and volume change and ultimately to relate glottal physiology to voice quality. With direct intraglottal in vivo visualization of the laryngeal medial surface, a novel method for glottal shape and volume reconstruction, and concurrent evaluation of acoustic parameters across a range of muscle activation conditions, we investigate the following questions: (1) How does the glottal shape change during phonation? (2) What is the shape of the glottal volume waveform (GVW)? (3) What are the effects of neuromuscular activation on (a) glottal shape, (b) GVW, and (c) acoustic parameters? Results reveal the role of neuromuscular control in modulating GVW and a tight relationship between neuromuscular activation, GVW, and voice acoustics.
METHODS
Hemilarynx Phonation
This study complied with all applicable national and institutional policies on the use of laboratory animals and was approved by the institutional Animal Research Committee. One male mongrel canine was used. Hemilarynx surgery and experimental set-up have been detailed previously and are briefly described.18,19 Intraoperative anesthesia was provided via a tracheotomy, the larynx was exposed in the neck, and a right hemilaryngectomy was performed. A grid of 30 India ink landmarks was tattooed onto the left VF medial surface. A transparent right-angle glass prism was positioned with its hypotenuse parallel to glottal midline with the opposite faces providing two distinct views of the VF used for 3D reconstruction (Fig. 1A). Phonation was achieved by stimulating the laryngeal nerves and providing humidified rostral airflow via a subglottic tube as the left VF vibrated against the prism.
Figure 1.
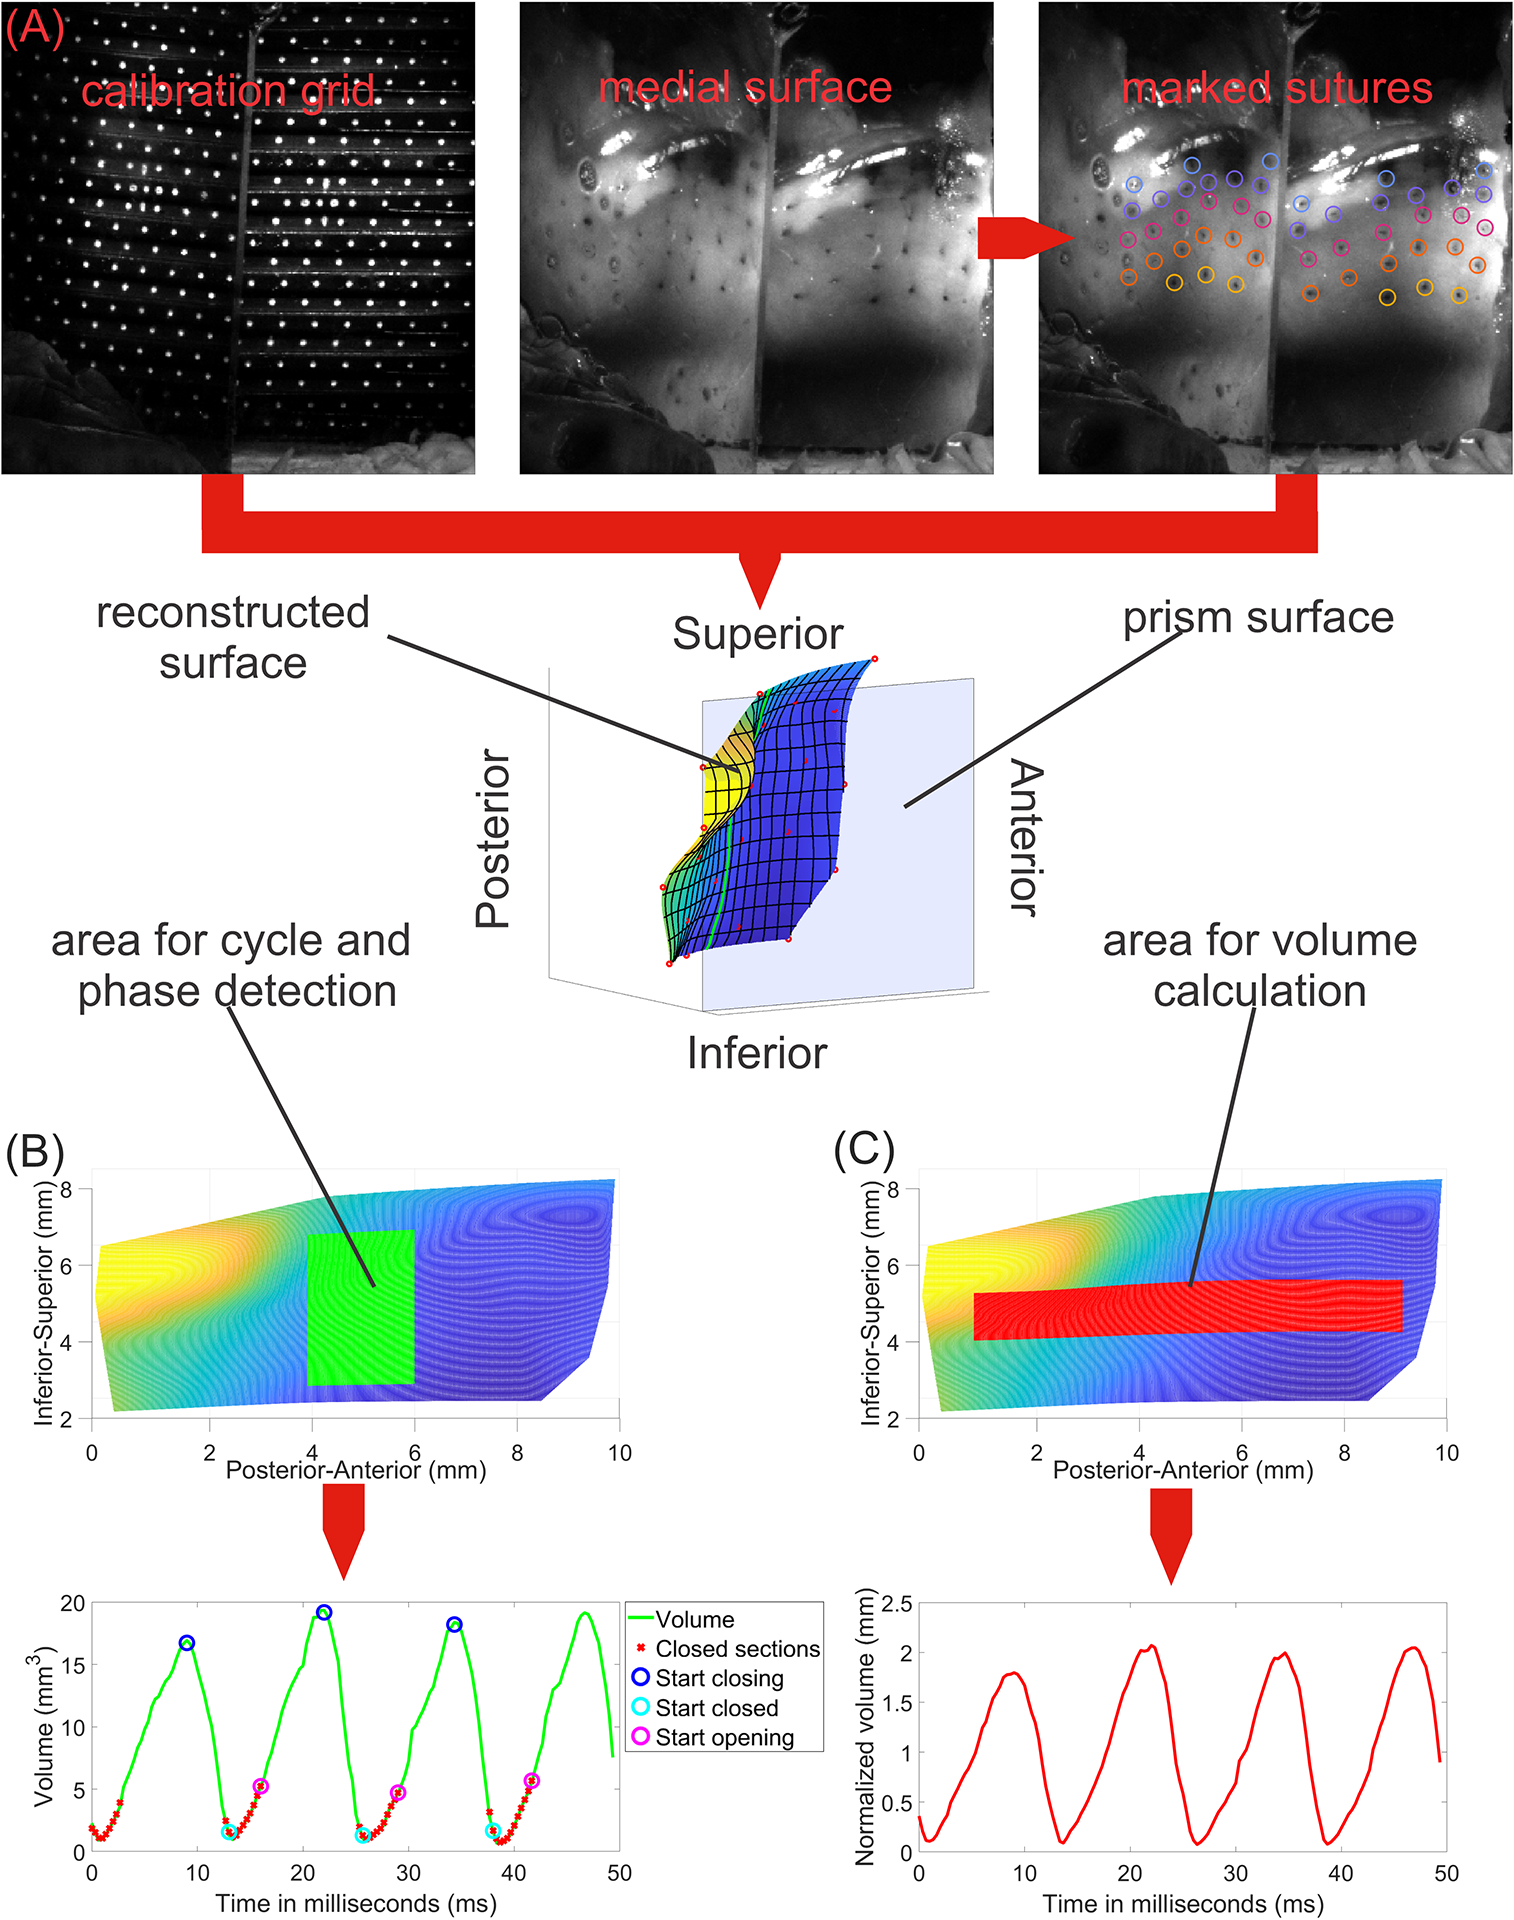
Schematic of 3D reconstruction methodology. A) Two views of the calibration grid and VF medial surface as seen by high-speed video (top row) with reconstruction (bottom row). B) Glottal cycle and phase evaluated from a mid-membranous superior-inferior slice. C) Glottal volume waveform calculated from an area spanning the anterior-posterior length of the vocal fold. These sections of the vocal fold were used for cycle and volume detection to focus on the most reliable and relevant parts.
Phonatory Neuromuscular Conditions Tested
The left SLN and RLNs were exposed and cuff electrodes (Ardiem Medical, Indiana, PA) were placed around the nerves for graded activation of cricothyroid (CT) and intrinsic adductor muscles, respectively.18 The posterior cricoarytenoid muscle nerve was divided to eliminate its abduction effects on neuromuscular activation. Each nerve was tested across 11 levels, with 10 levels of graded stimulation from threshold to maximum muscular contraction and one condition with no activation. In total, 121 unique neuromuscular activation combinations were tested (11 RLN × 11 SLN). VF medial surface oscillation was captured at 3,000 fps (Phantom v210, Vision Research Inc., Wayne, NJ), and acoustic signals were recorded using a microphone (Model 4128; Brüel & Kjær North America, Norcross, GA) mounted flush against the inner wall of the subglottic tube.
3D Reconstruction Method
Figure 1 illustrates the experimental design for landmark tracking, 3D reconstruction, and parameter extraction. The reconstruction space was calibrated using the calibration grid. VF surface was reconstructed using manually tracked ink landmarks across three continuous cycles of stable oscillation starting at approximately the same time point across all conditions using a custom software tool (GLabel, Friedrich Alexander University Erlangen-Nürnberg) by two reviewers (one for initial marking, one for review). 2D coordinates of landmarks that were temporarily obscured (e.g. due to glare or shadows) for up to three consecutive frames were linearly interpolated. Subsequently, the 3D positions of all tracked landmarks were reconstructed using a custom algorithm based on the work of Döllinger et al.20 Reconstruction error was calculated comparing optimal grid coordinates and reconstructed grid coordinates based on the calibration grid. Average error between reconstructed grid and calibration points was 0.026 mm, and maximum error (largest deviation between a reconstructed grid point and its expected ideal position) was 0.063 mm. Average error is expected to slightly increase with increasing distance from prism as the maximum calibrated depth was 0.5 mm. 3D surface shape between landmarks was then reconstructed using cubic spline interpolation.21 Due to the labor needed to accurately manually mark landmarks for analysis (about 16 hours per condition), we limited complete 3D reconstruction to 13 selected neuromuscular activation combinations that spanned across the SLN and RLN activation range to adequately provide an overview of the effects of RLN and SLN activation, marked with black dots in Figure 2.
Figure 2.

Muscle activation plots as a function of RLN and SLN stimulation level for acoustic parameters. (A) Average fundamental frequency (F0). (B) Average amplitude difference between the first two harmonics (H1-H2). (C) Average cepstral peak prominence (CPP). Black dots indicate conditions for which 3D surface reconstruction was performed. Some conditions with high SLN and low RLN activation did not phonate for adequate duration (colored gray), and some corrupted audio files (colored turquoise) could not be evaluated.
Parameters
Glottal cycles were detected using volume change between VF medial surface and glass plate. For cycle detection, a narrow mid-membranous section was chosen (20% of full anterior-posterior range, 60% of full superior-inferior range) to determine the closed phase reliably (Fig. 1B). Across this section, coronal cuts were taken from the medial surface. A frame was marked as “closed” if at least half of these cuts came closer than 0.02 mm to the glass prism. For volume calculation, a broad axial middle section (80% of full anterior-posterior range, 20% of full superior-inferior range) was chosen to capture relevant area of VF oscillation but exclude irrelevant and occasionally unreliable outer sections (Fig. 1C). From reconstructed cycles, three parameters were calculated: Open Quotient (OQ, (opening + closing phases) / cycle length)22,23, Closing Quotient (CQ, closing phase / cycle length)24, and normalized Glottal Volume (GV, volume between glass plate and surface section in Fig. 1C divided by length times width of detected surface section (red area in figure)). Averages for each activation condition were calculated.
Acoustic analysis was performed for all conditions from manually selected periods of stable phonation with identical window length across samples (650 ms). Cepstral peak prominence (CPP), fundamental frequency (F0), and the amplitude difference between the first two harmonics (H1-H2) were taken every 5 ms during the selected stable phonation using VoiceSauce (version 1.37)25 and averaged for each condition. CPP and H1-H2 are perceptually relevant acoustic measures of voice quality, as lower CPP values are associated with perceived breathiness26 and higher H1-H2 with breathiness.27,28 CPP was calculated based on the Straight F0 estimator.25 H1-H2 was calculated by subtracting the amplitude of the second harmonic from the amplitude of the first harmonic.
For all six parameters, Kendall correlation coefficients between parameter values and SLN and RLN levels were calculated, resulting in 12 correlation coefficients. The false discovery rate (the expected percentage of false positive tests) was controlled at 5% using the Benjamini–Yekutieli procedure29 to factor in potential unknown dependencies between parameters. All statistical analysis was completed in Matlab (version 9.10).
RESULTS
Acoustic Analysis
Muscle activation plots for acoustic parameters from 121 distinct neuromuscular activation conditions are presented in Figure 2. Range for average F0 was 61–97 Hz, for average CPP 17.8–25.5, and for average H1-H2 3.6–18.7 Hz. F0 and CPP increased and H1-H2 decreased significantly with both RLN and SLN activation, indicating a less breathy voice with more muscle activation (Table 1).
Table 1.
Tau coefficient and p-value from Kendall correlation between each metric and RLN and SLN activation. Range and standard deviation also included. Asterisk indicates statistically significant findings.
| F0 | H1-H2 | CPP | Closing Quotient (CQ) | Open Quotient (OQ) | Glottal Volume, normalized (mm) | |
|---|---|---|---|---|---|---|
| Tau coefficient for RLN (p-value) |
0.674 (<0.0001)* | −0.699 (<0.0001)* | 0.741 (<0.0001)* | −0.323 (0.560) | −0.098 (0.219) | −0.407 (0.288) |
| Tau coefficient for SLN (p-value) | 0.417 (<0.0001)* | −0.383 (<0.0001)* | 0.225 (0.015)* | −0.797 (0.004)* | −0.623 (0.030)* | −0.681 (0.015)* |
| Range (Standard Deviation) |
60.9 – 96.7 (8.07) | 3.58 – 18.7 (3.97) | 17.8 – 25.5 (2.15) | 0.242 – 0.423 (0.052) | 0.622 – 0.832 (0.063) | 31.6 – 77.9 (12.3) |
3D Reconstructions and Surface Shape Changes
Thirteen activation conditions spanning a range of RLN and SLN activation combinations were evaluated with 3D reconstruction of surface shape and GVW. For brevity and illustrative purposes, three activation conditions are presented hereafter: (1) SLN0/RLN1 to demonstrate vibration at low activation state, (2) SLN0/RLN5 to demonstrate effects of increased RLN activation, and (3) SLN10/RLN5 to demonstrate effects of adding SLN activation. Frame grabs of these three conditions are shown in Figure 3. Corresponding complete reconstructed vibratory cycles are provided in Supplemental Videos 3A–C.
Figure 3.
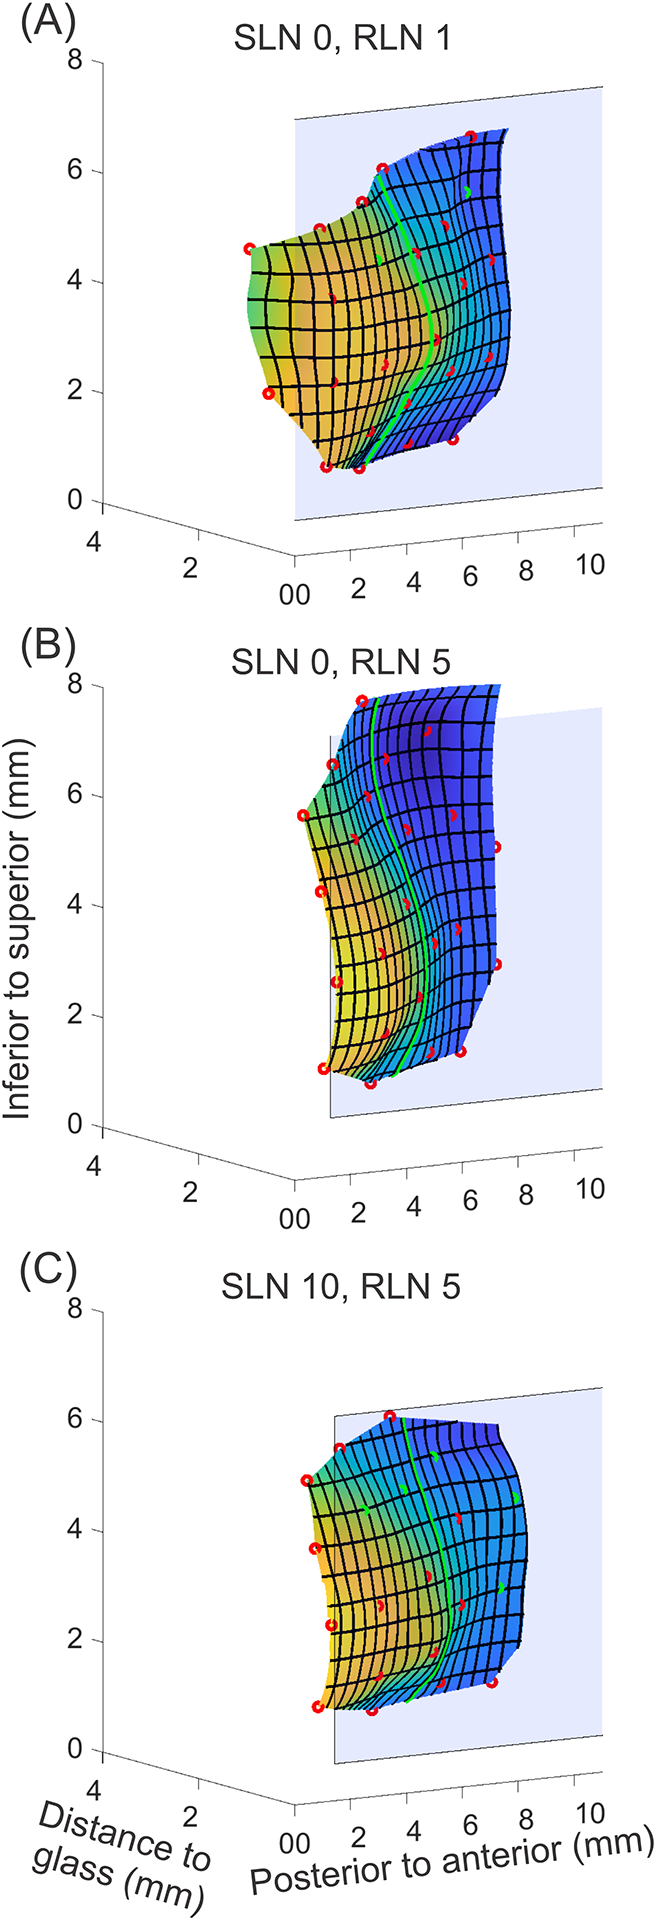
Still frame-grab images of medial surface 3D reconstruction of three illustrative activation conditions. (A) SLN0/RLN1, (B) SLN0/RLN5, and (C) SLN10/RLN5. The position of the glass plate is indicated by light blue plane. Yellow represents closer to glass plate, and blue represents farther away from glass plate. On the medial surface, red circles indicate landmarks that were observed and manually marked. Green circles indicate landmarks that were temporarily obscured and thus interpolated using cubic splines. The green line represents the middle of the reconstructed portion of the vocal fold in the anterior-posterior dimension (mid-membranous vocal fold). The corresponding complete reconstructed vibratory cycles are provided in Supplemental Videos 3A–C.
A granular view of the glottal closing and opening patterns in a mid-membranous coronal plane is shown in Figures 4A–C. At low muscle activation (Fig. 4A), the VF medial surface contact against the prism is small and mostly superior. The glottis is convergent throughout opening phase and divergent during closing, and closing occurs with a broader inferior lip. As RLN is increased (Fig. 4B), the glottis moves closer to the midline and assumes a thicker rectangular shape that can be seen as increased glottal contact at midline on the first frame of the opening phase. As the glottis opens, the medial surface progresses from convergent to dome shape. During closing, a more limited inferior glottal lip first starts to close and glottis becomes divergent. Quicker closing phase is also seen as fewer coronal cuts indicate shorter duration. As SLN is added (Fig. 4C), glottal contact shape at the beginning of opening is still rectangular but with decreased vertical height compared to without SLN. The opening phase is convergent with less dome shaped at the end, and the superior VF lip is thin. During closing, the glottis is divergent with a sharper inferior closing lip. Closing is even quicker with the addition of SLN stimulation.
Figure 4.
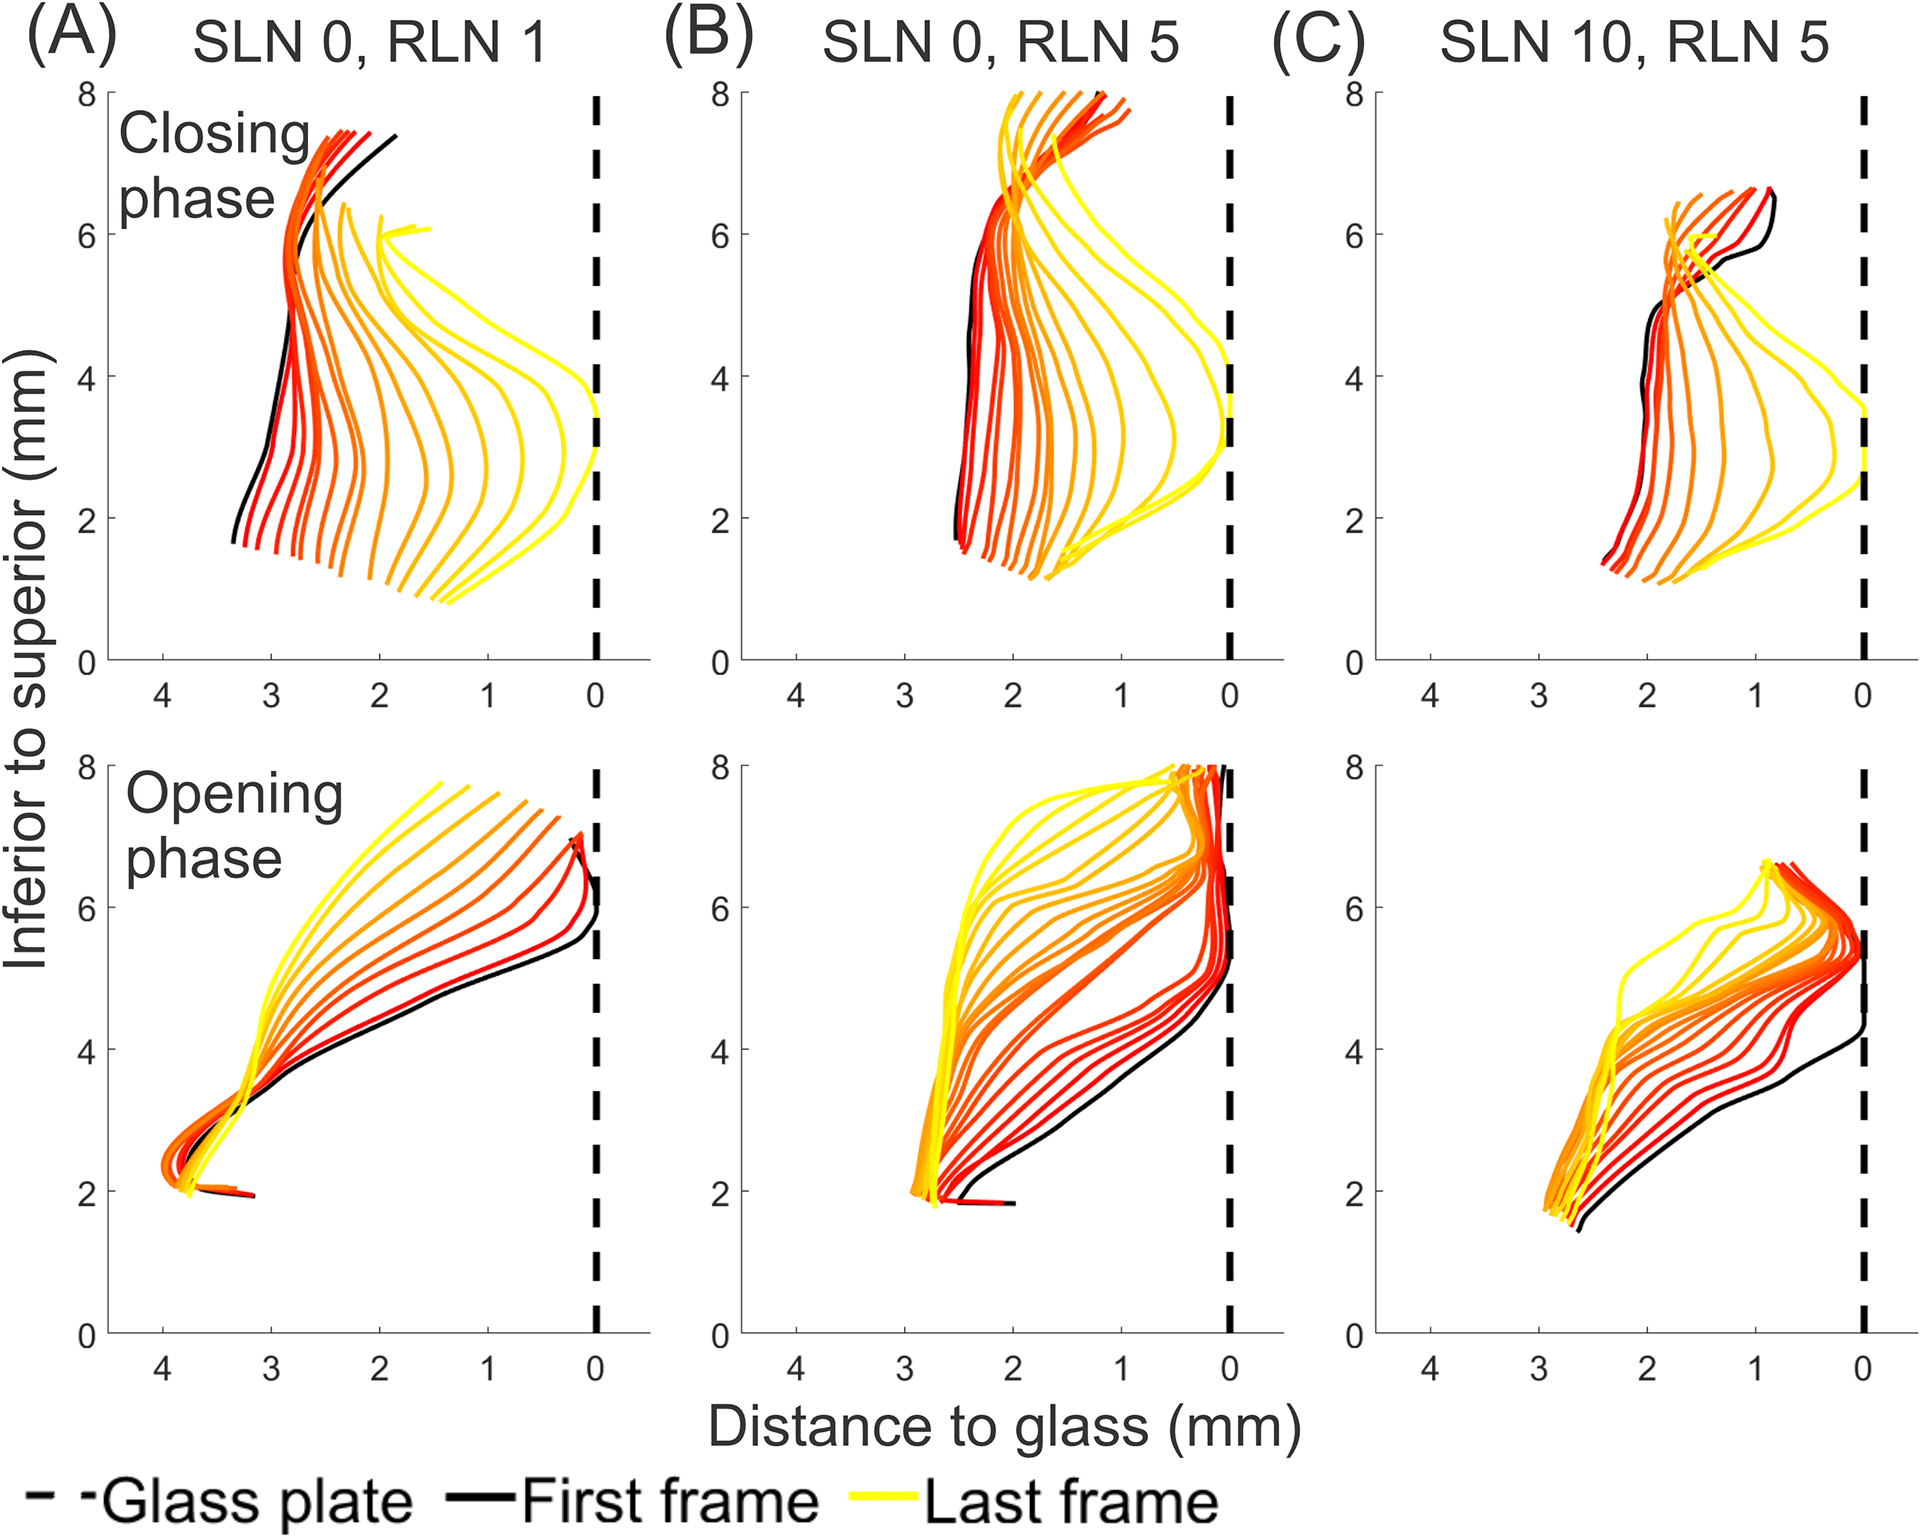
Medial surface reconstructions from a coronal view of the mid-membranous vocal fold during closing and opening phases. Each plot depicts medial surface shape for all frames within each phase. Reconstructions are from the following conditions: (A) SLN0/RLN1, (B) SLN0/RLN5, and (C) SLN10/RLN5. The glottis is divergent during closing and convergent during opening. SLN activation resulted in quicker closing phase.
To recreate the classical coronal view of glottal opening and closing pattern, a full larynx reconstruction was made by mirroring the left hemilarynx mid-membranous reconstruction onto the right side across the glass plate over one full oscillation cycle (Fig. 5A–C). Across all conditions, the glottis was convergent during opening and divergent during closing as both opening and closing occurred form inferior to superior. Videos of the reconstructed full larynx glottal cycles are provided in Supplemental Videos 5A–C.
Figure 5.
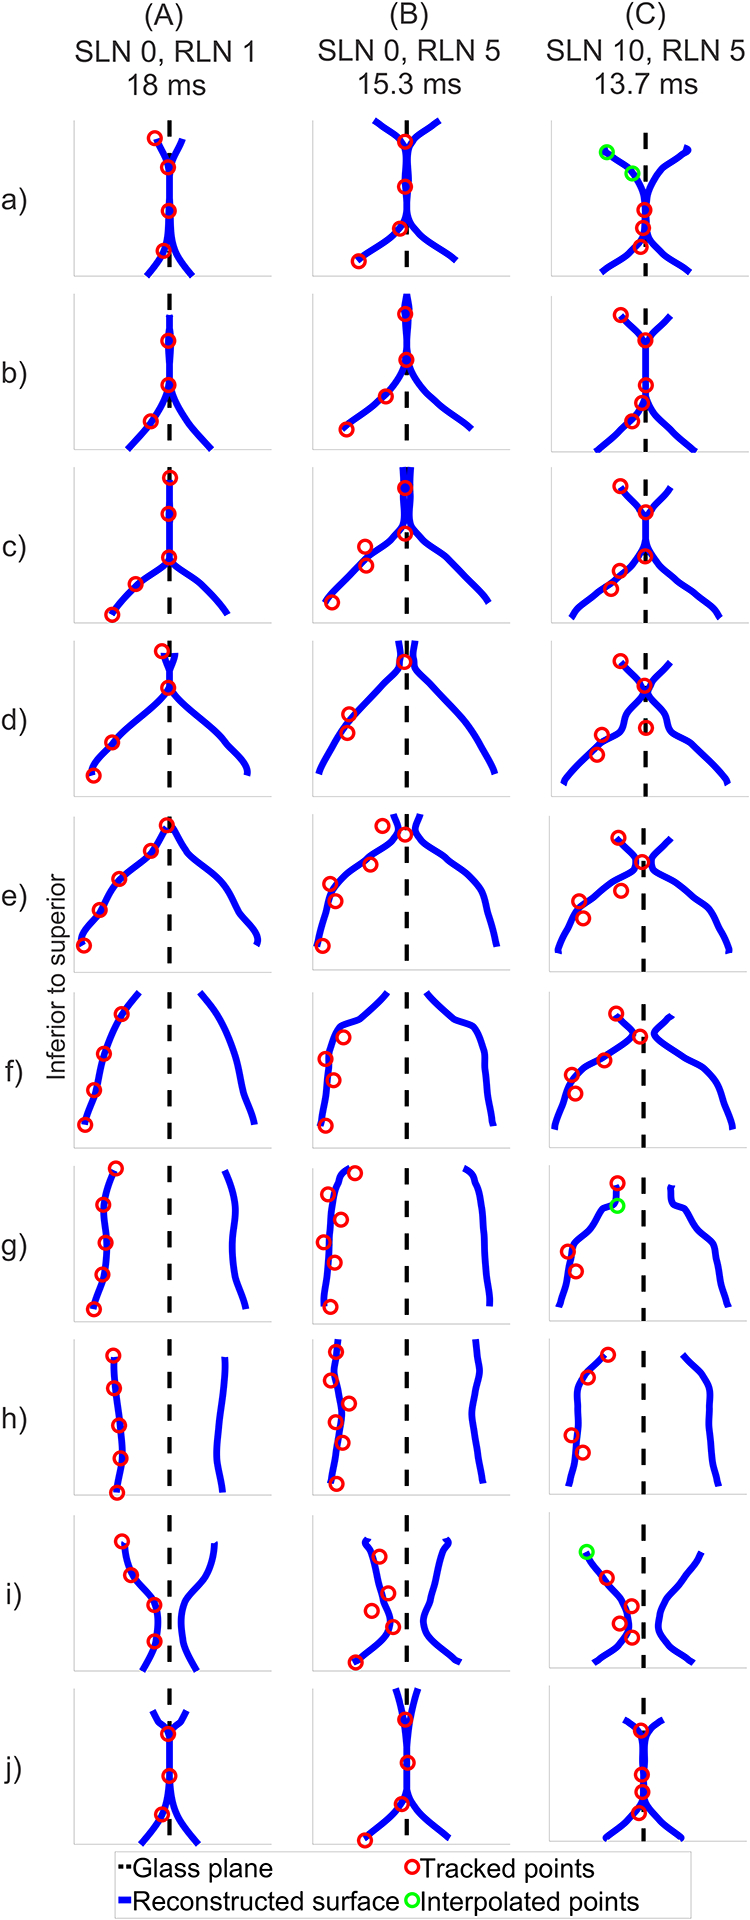
Full larynx mid-membranous coronal reconstructions, performed by mirroring the left vocal fold as the right vocal fold, for the three illustrative conditions. Coronal views of one full glottal cycle is presented. (A) SLN0/RLN1, (B) SLN0/RLN5, and (C) SLN10/RLN5. Red circles indicate landmarks that were observed and marked. Green circles indicate landmarks that were temporarily obscured and thus interpolated. Within each condition, a-j are equidistant from each other. Videos of the reconstructed full larynx glottal cycles are provided in Supplemental Videos 5A–C.
Glottal Volume Waveforms
In Figure 6, the GVW (calculated by combining normalized glottal volume for each frame in the glottal cycle) and its derivative are plotted across a glottal cycle. At low activation state (Fig. 6A), no skewing of GVW is present. As RLN activation is added (Fig. 6B), the waveform is reduced in height and skewed to the right. Addition of SLN activation (Fig. 6C) leads to further right skewing of the waveform, sharper maximal volume declination, and a statistically significant trend for decreased glottal volume.
Figure 6.
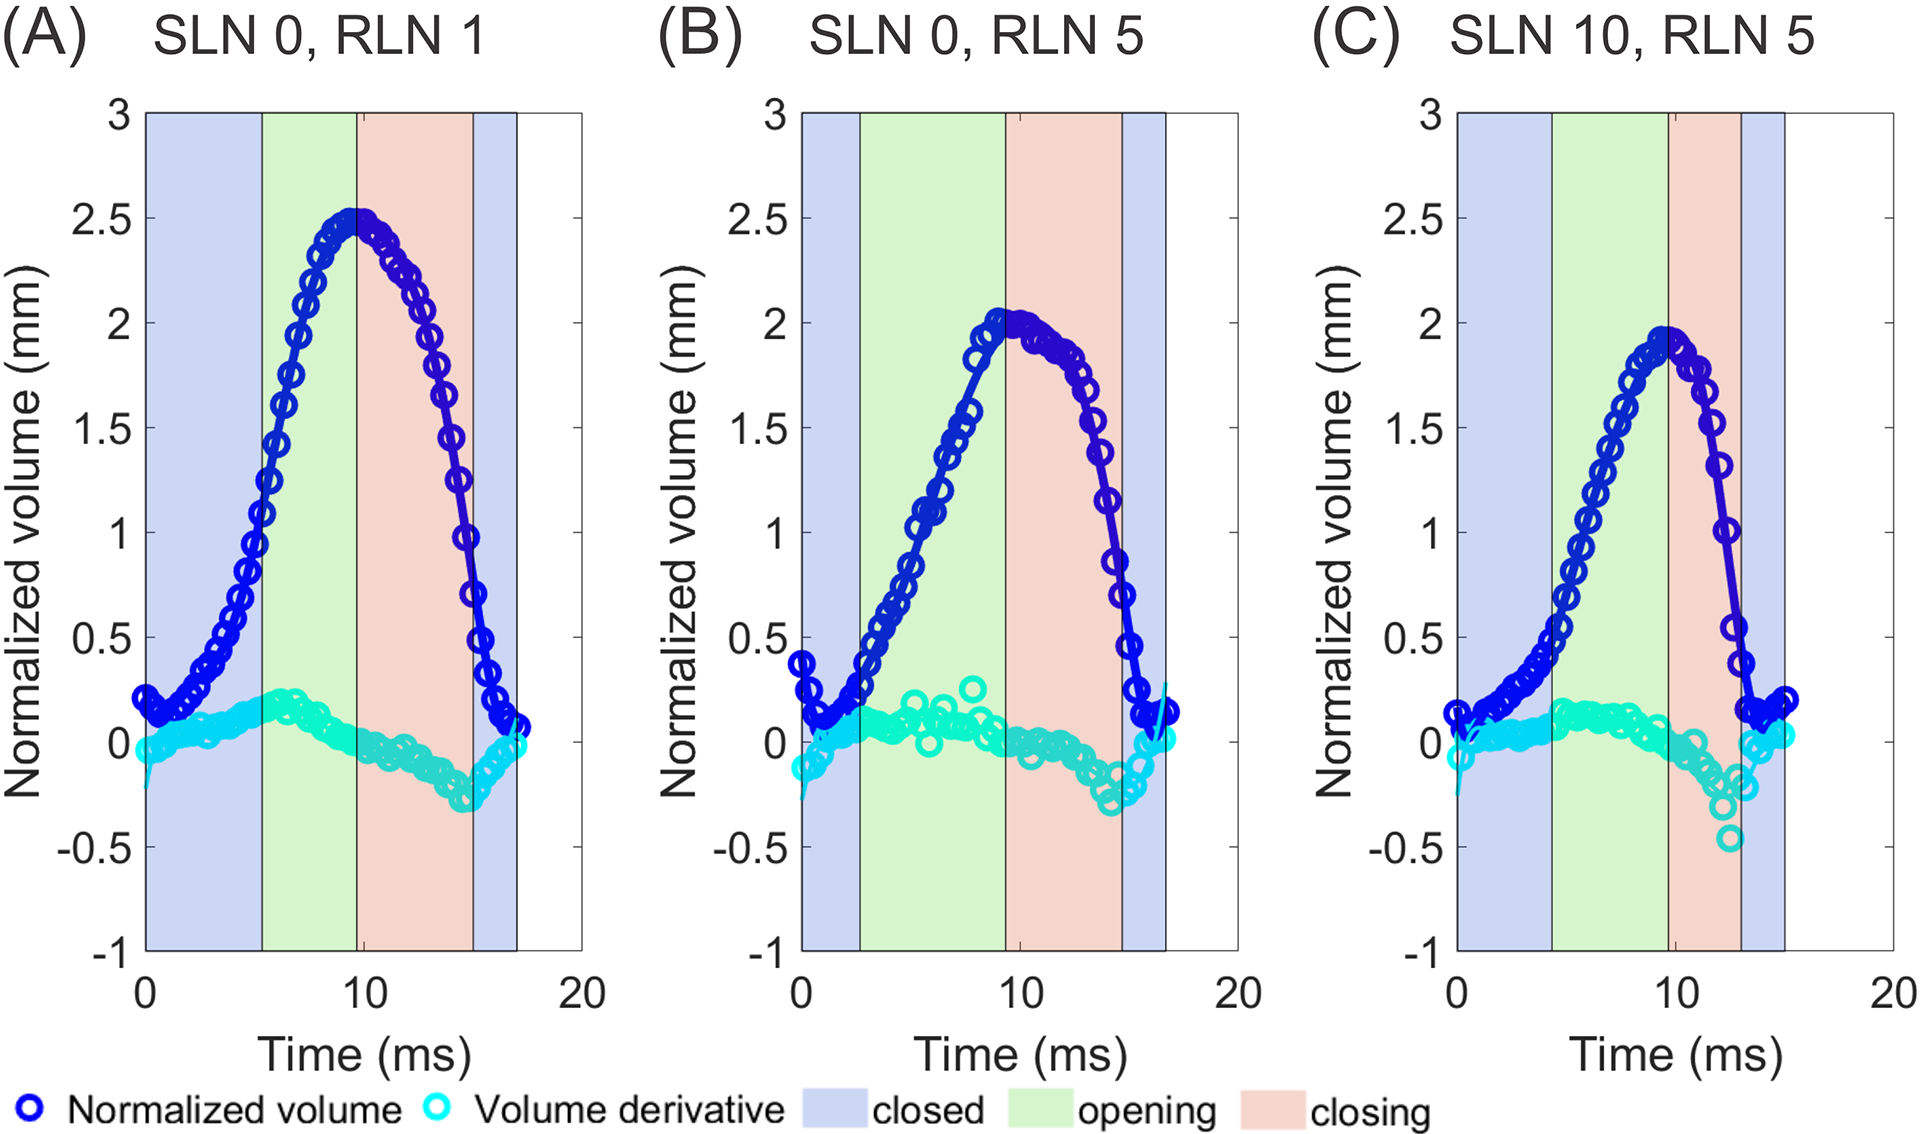
Glottal volume waveforms (GVW) and volume derivatives for three illustrative conditions: (A) SLN0/RLN1, (B) SLN0/RLN5, and (C) SLN10/RLN5. Neuromuscular activation results in right skewing and increase in closing speed, especially with SLN activation.
Trajectories of Medial Surface Landmarks
The paths of motion (lateral and vertical displacement trajectories) of four mid-membranous landmarks spanning the height of the VF medial surface across multiple cycles are presented in Figure 7. From inferior to superior, the trajectory changes from more linear to more elliptical across all conditions. With increased RLN activation, lateral amplitude decreases (Fig. 7B). With SLN activation, variability of motion decreases and the landmarks follow a tight trajectory and return precisely to the same location against the glass plate (Fig. 7C). The greatest lateral displacement occurs in the mid-lower VF medial surface and the greatest vertical displacement occurs at the superior lip.
Figure 7.
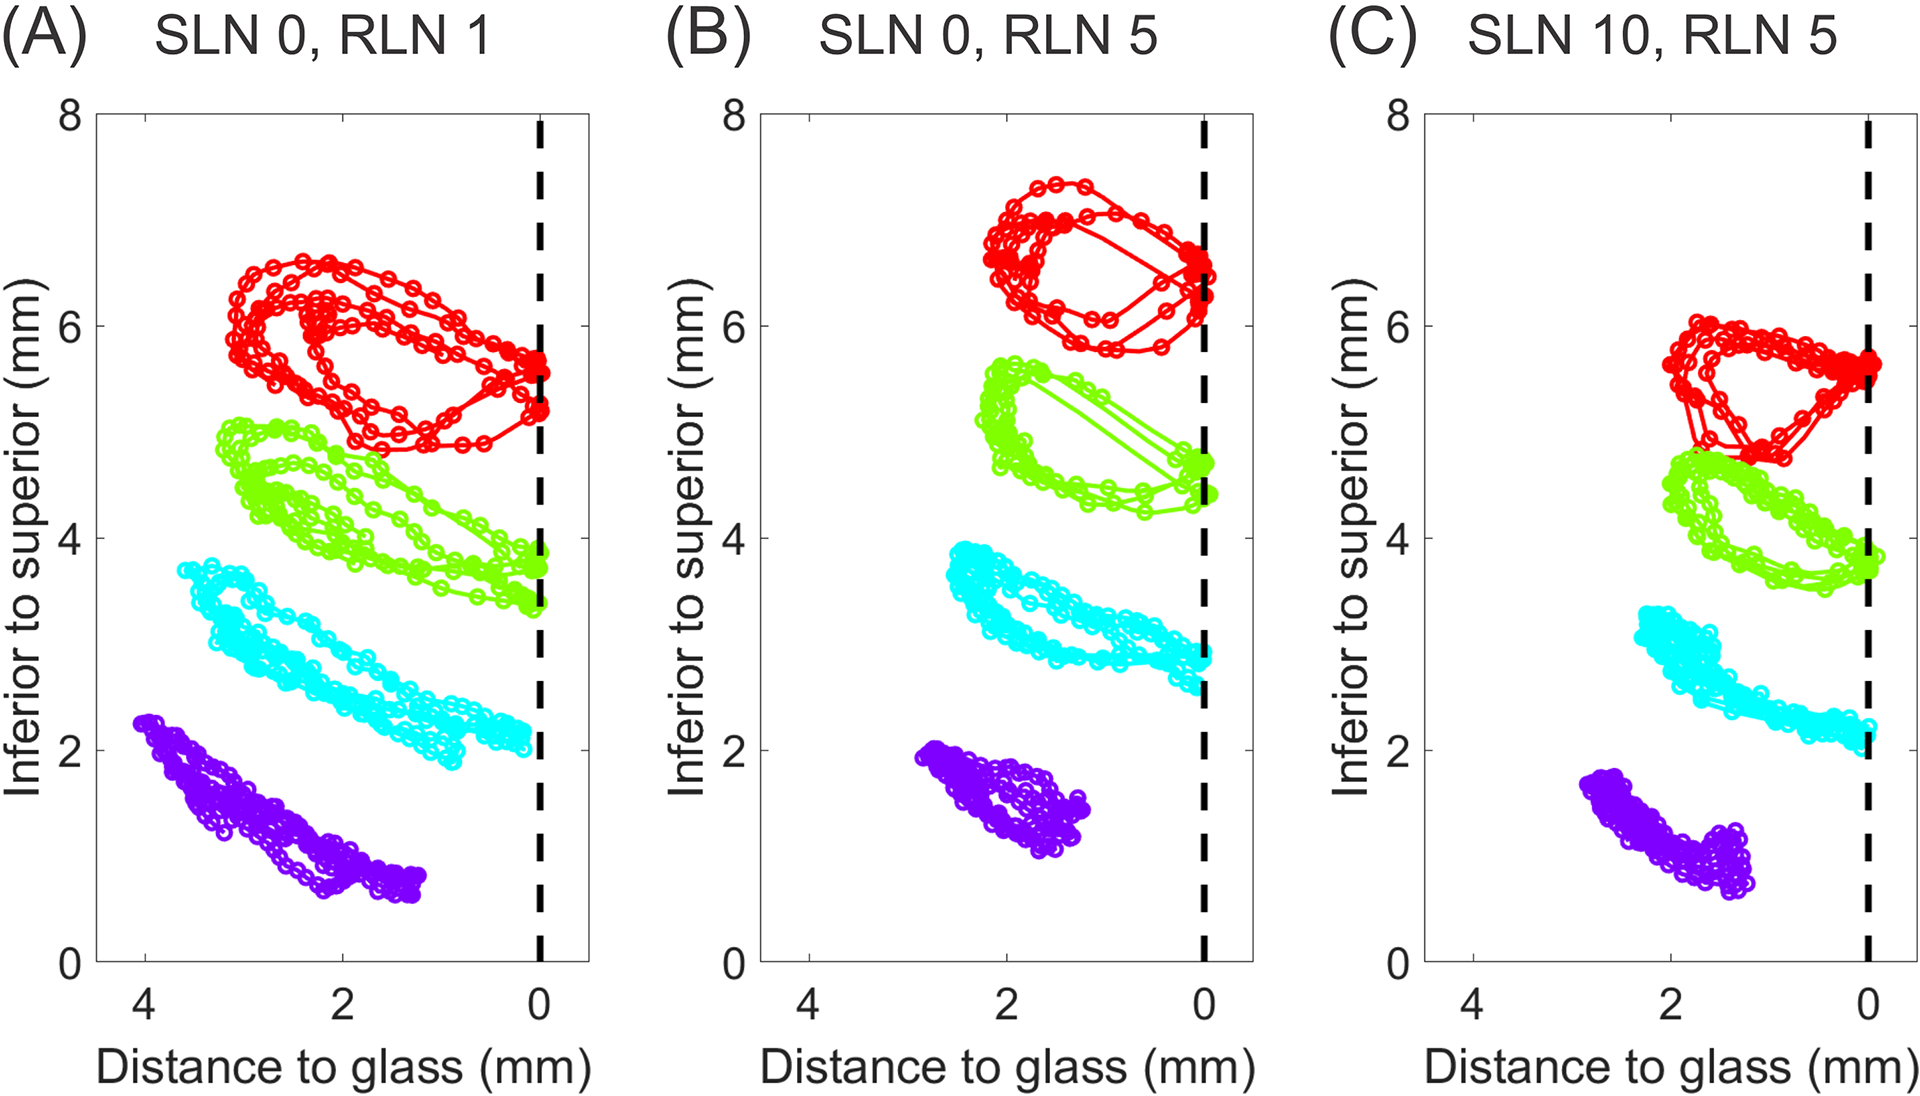
The spatiotemporal trajectories of the mid-membranous landmarks on the vocal fold medial surface in the coronal plane for the following conditions: (A) SLN0/RLN1, (B) SLN0/RLN5, and (C) SLN10/RLN5. Each color represents a unique landmark. The dashed line marks the location of the glass prism.
Statistical Evaluations
Both RLN and SLN had a significant effect on all three acoustic measures: F0 and CPP increased, and H1-H2 decreased significantly with RLN and SLN activation (Table 1). For reconstruction-based parameters, significant changes were observed only with SLN activation. Subjective trends and low to moderate correlations were observed for RLN activation.
DISCUSSION
The ultimate goal in voice research is to connect voice physiology with voice quality. The cyclical volume and velocity of airflow that passes through the glottis, particularly the skewing towards the closing phase, are correlated with acoustics of improved voice quality.2,5 The laryngeal neuromuscular complex sets the VF posture and stiffness for the respiratory system to act upon and excite to oscillation. This study investigates the relationship between laryngeal neuromuscular activation state, glottal shape, glottal volume waveform, and resulting acoustics. No flow was measured even though the GVW appears to be qualitatively similar to volume velocity waveforms. We examine the effects of RLN and SLN over 121 unique activation conditions. Using a novel method to reconstruct the 3D glottal shape and volume waveform, we demonstrate the effects of neuromuscular activation on glottal opening and closing, glottal volume, and acoustic measures of voice quality.
Previous attempts to characterize medial surface dynamics have faced methodological limitations, including obscured views of vibrating VFs and limited neuromuscular activation conditions.16,17 In this study, we achieved full visualization of the entire VF medial surface. Acoustic analysis revealed that neuromuscular stimulation accurately targeted both nerves in a graded manner. F0 and CPP increased and H1-H2 decreased significantly with increasing SLN and RLN activation. The accuracy of our 3D reconstruction approach afforded a previously unexplored level of granularity in evaluating neuromuscular control of glottal dynamics.
Although we did not measure flow, we directly measured glottal cycle volume change, which is intimately linked with the volume airflow passing through the glottis each cycle. GVW reflects direct measurements of glottal opening and closing, and we measured glottal volume change and dynamics of opening and closing phases with high accuracy. Although GVW is obtained from the volume between the prism and the VF medial surface, the observed right skewing of GVW is qualitatively similar to that of volume velocity waveforms.2,3 The speed of glottal closure is also assessed accurately with GVW.
A unique contribution of this study is demonstrating the effects of intrinsic laryngeal muscles on the skewing of glottal cycle phases. At threshold RLN activation, the opening and closing phases are approximately equal in shape and duration. Increasing RLN activation leads to right skewing of the GVW with a sharper negative peak of the volume derivative during the closing phase, indicating faster closing phase. With SLN activation, the skewing is more pronounced as reflected in a statistically significant trend towards both decreased closing quotient and open quotient. The CQ, OQ, and GVW data together are the first direct measurements from the VF medial surface that support the theoretical predictions put forth by Stevens that increased VF tension results in shorter closing phase and faster closing speed.2
Computational modeling suggests that the right skewing of volume velocity waveforms can result in both increased harmonics and loudness.2,3 Our acoustic data analysis demonstrates that SLN activation leading to faster closure significantly correlates with metrics of improved voice quality. The physiologic mechanism by which this occurs is likely related to changes in glottal shape, VF stiffness and tension, subglottal pressure requirements, and elastic recoil forces.
The spatiotemporal trajectories of the medial surface landmarks further reveal previously unseen aspects of VF vibratory patterns. At low neuromuscular activation, the VF landmarks travel further and take a variable elliptical course. As body stiffness is added with RLN stimulation, the lateral excursion is reduced. As cover tension is added with SLN stimulation, there is further reduction in lateral and vertical displacement, with less variable elliptical pathway. Reduced variability is reflected in improved acoustic metrics of voice quality. Surgical interventions that change shape and stiffness of the VF should avoid adversely affecting these areas of pliability.
While our findings are consistent with prior research on voice production physiology, study limitations include use of an animal larynx and specifically a hemilarynx. While the canine larynx has some anatomic differences from the human larynx, particularly in cover layer thickness,30 it is still an optimal model to study voice physiology.30,31 The hemilarynx phonation model may not completely resemble full larynx phonation, but it has been validated to exhibit very similar phonatory characteristics to the full larynx.32 Although hemilarynx phonation requires higher airflow for phonation, it is still the best existing technique that directly visualizes the entire vibrating medial surface. The technical challenges of hemilaryngeal phonation with graded stimulation and the need to minimize the use of vertebrate animals resulted in us gathering data from a single hemilaryngeal phonation experiment. Additional investigation in more animals is needed. Additionally, the absence of negative correlation between RLN stimulation and OQ may reflect limited data, as RLN stimulation expectedly decreased GVW amplitude. We highlight that this study successfully achieved graded RLN and SLN stimulation, significantly increased the number of neuromuscular activation conditions evaluated compared to prior studies, and provided high-quality multimodal data that informs theories of voice physiology.
CONCLUSION
In this study, we utilized a 3D reconstruction approach to visualize the VF medial surface during phonation in an in vivo canine hemilarynx, and we obtained direct measurements of glottal movement, glottal volume waveform, and resulting voice quality. We present the GVW as a correlate of laryngeal vibratory dynamics and highlight the importance of intrinsic laryngeal muscles in modulating medial surface dynamics to achieve improved voice quality.
Supplementary Material
Supplemental Videos 3A: The corresponding complete reconstructed vibratory cycles for: (A) SLN0/RLN1
Supplemental Videos 3B: The corresponding complete reconstructed vibratory cycles for: (B) SLN0/RLN5
Supplemental Videos 5A: Videos of the reconstructed full larynx glottal cycles for: (A) SLN0/RLN1
Supplemental Videos 3C: The corresponding complete reconstructed vibratory cycles for: (C) SLN10/RLN5.
Supplemental Videos 5B: Videos of the reconstructed full larynx glottal cycles for: (B) SLN0/RLN5
Supplemental Videos 5C: Videos of the reconstructed full larynx glottal cycles for: (C) SLN10/RLN5.
ACKNOWLEDGEMENTS
We thank Stefan Kniesburges, PhD for his feedback on the manuscript.
Funding:
This study was supported by the National Institute on Deafness and Other Communication Disorders (NIDCD) grant R01DC11300.
Footnotes
Level of Evidence: N/A, Basic Science
Accepted for Oral Presentation at the 143rd Annual Meeting of the American Laryngological Association, April 28–30, 2022, Dallas, Texas
Conflicts of Interest: The authors have no other funding, financial relationships, or conflicts of interest to disclose.
REFERENCES
- 1.Bless DM, Hirano M, Feder RJ. Videostroboscopic evaluation of the larynx. Ear Nose Throat J. 1987;66(7):289–296. [PubMed] [Google Scholar]
- 2.Stevens KN. Acoustic Phonetics. Cambridge (Mass.): The MIT Press; 1998. [Google Scholar]
- 3.Zhang Z Mechanics of human voice production and control. J Acoust Soc Am. 2016;140(4):2614. [DOI] [PMC free article] [PubMed] [Google Scholar]
- 4.Fant G Preliminaries to analysis of the human voice source. STL-QPSR. 1982;23(4):1–27. [Google Scholar]
- 5.Sulter AM, Wit HP. Glottal volume velocity waveform characteristics in subjects with and without vocal training, related to gender, sound intensity, fundamental frequency, and age. J Acoust Soc Am. 1996;100(5):3360–3373. doi: 10.1121/1.416977 [DOI] [PubMed] [Google Scholar]
- 6.Rothenberg M The glottal volume velocity waveform during loose and tight glottal adjustments. In: Rigault A, Charbonneau, eds. Proceedings of the 7th International Congress of Phonetic Sciences. Mouton – The Hague; 1971:380–388. Accessed December 13, 2021. http://www.rothenberg.org/Glottal/glottal.pdf [Google Scholar]
- 7.Rothenberg M A new inverse-filtering technique for deriving the glottal air flow waveform during voicing. J Acoust Soc Am. 1973;53(6):1632–1645. [DOI] [PubMed] [Google Scholar]
- 8.Rothenberg M Acoustic Interaction Between the Glottal Source and the Vocal Tract. In: Stevens KN, Hirano M, eds. Vocal Fold Physiology. University of Tokyo Press; 1981:305–328. Accessed October 10, 2021. http://rothenberg.org/Acoustic/Acousticpdf.pdf [Google Scholar]
- 9.Verneuil A, Berry DA, Kreiman J, Gerratt BR, Ye M, Berke GS. Modeling measured glottal volume velocity waveforms. Ann Otol Rhinol Laryngol. 2003;112(2):120–131. [DOI] [PubMed] [Google Scholar]
- 10.Lodermeyer A, Tautz M, Becker S, Döllinger M, Birk V, Kniesburges S. Aeroacoustic analysis of the human phonation process based on a hybrid acoustic PIV approach. Experiments in Fluids. 2017;59(1). doi: 10.1007/s00348-017-2469-9 [DOI] [Google Scholar]
- 11.Farbos de Luzan C, Oren L, Maddox A, Gutmark E, Khosla SM. Volume velocity in a canine larynx model using time‑resolved tomographic particle image velocimetry. Exp Fluids. 2020;61(2):63. [DOI] [PMC free article] [PubMed] [Google Scholar]
- 12.Elsinga GE, Van Oudheusden BW, Scarano F. Experimental assessment of tomographic-PIV accuracy. In: 13th International Symposium on Applications of Laser Techniques to Fluid Mechanics. 2006. [Google Scholar]
- 13.Herriott W, Farnsworth DW. High speed motion pictures of the vocal cords. The Journal of the Acoustical Society of America. 1938;9(3):274–274. [Google Scholar]
- 14.Baer T Investigation of Phonation Using Excited Larynxes. Dissertation. Massachusetts Institute of Technology; 1975. Accessed December 13, 2021. https://dspace.mit.edu/handle/1721.1/21325 [Google Scholar]
- 15.Yumoto E, Kadota Y, Kurokawa H. Tracheal view of vocal fold vibration in excised canine larynxes. Arch Otolaryngol Head Neck Surg. 1993;119(1):73–78. [DOI] [PubMed] [Google Scholar]
- 16.Doellinger M, Berry DA. Visualization and quantification of the medial surface dynamics of an excised human vocal fold during phonation. J Voice. 2006;20(3):401–413. [DOI] [PubMed] [Google Scholar]
- 17.Doellinger M, Berry DA, Berke GS. A quantitative study of the medial surface dynamics of an in vivo canine vocal fold during phonation. Laryngoscope. 2005;115(9):1646–1654. [DOI] [PubMed] [Google Scholar]
- 18.Chhetri DK, Neubauer J, Berry DA. Graded activation of the intrinsic laryngeal muscles for vocal fold posturing. J Acoust Soc Am. 2010;127(4):EL127–EL133. [DOI] [PMC free article] [PubMed] [Google Scholar]
- 19.Chhetri DK, Neubauer J, Bergeron JL, Sofer E, Peng KA, Jamal N. Effects of asymmetric superior laryngeal nerve stimulation on glottic posture, acoustics, vibration. Laryngoscope. 2013;123(12):3110–3116. [DOI] [PMC free article] [PubMed] [Google Scholar]
- 20.Döllinger M, Berry DA. Computation of the three-dimensional medial surface dynamics of the vocal folds. J Biomech. 2006;39(2):369–374. [DOI] [PubMed] [Google Scholar]
- 21.de Boor C A Practical Guide to Splines. New York, New York: Springer-Verlag; 1978. [Google Scholar]
- 22.Baken RJ, Orlikoff RF. Laryngeal Function. In: Baken RJ, Orlikoff RF, eds. Clinical Measurement of Speech and Voice. Cengage Learning; 1998:209–210. ISBN:1-5659-3869-0 [Google Scholar]
- 23.Timcke R, Leden H, Moore P. Laryngeal vibrations: measurements of the glottis wave. AMA Arch Otolaryngol. 1958;68(1):1–19. [DOI] [PubMed] [Google Scholar]
- 24.Holmberg EB, Hillman RE, Perkell JS. Glottal airflow and transglottal air pressure measurements for male and female speakers in soft, normal, and loud voice [published correction appears in J Acoust Soc Am 1989 Apr;85(4):1787]. J Acoust Soc Am. 1988;84(2):511–529. [DOI] [PubMed] [Google Scholar]
- 25.Shue YL, Keating P, Vicenik C, Yu K. VoiceSauce: A program for voice analysis. Proc. 17th ICPhS Hong Kong. 2011:1846–1849. [Google Scholar]
- 26.Hillenbrand J, Cleveland RA, Erickson RL. Acoustic correlates of breathy vocal quality. J Speech Hear Res. 1994;37(4):769–778. [DOI] [PubMed] [Google Scholar]
- 27.Klatt DH, Klatt LC. Analysis, synthesis, and perception of voice quality variations among female and male talkers. J Acoust Soc Am. 1990;87(2):820–857. [DOI] [PubMed] [Google Scholar]
- 28.Sundberg J, Gauffin J. Waveform and spectrum of the glottal voice source. STL-QPSR. 1078;19(2–3):35–50. [Google Scholar]
- 29.Benjamini Y, Yekutieli D The control of the false discovery rate in multiple testing under dependency. Ann. Stat 2001;29(4):1165–1188. [Google Scholar]
- 30.Garrett CG, Coleman JR, Reinisch L. Comparative histology and vibration of the vocal folds: implications for experimental studies in microlaryngeal surgery. Laryngoscope. 2000;110:814–824. [DOI] [PubMed] [Google Scholar]
- 31.Chhetri DK, Rafizadeh S. Young’s modulus of canine vocal fold cover layers. J Voice 2014;28:406–410. [DOI] [PMC free article] [PubMed] [Google Scholar]
- 32.Jiang JJ, Titze IR. A methodological study of hemilaryngeal phonation. Laryngoscope. 1993;103(8):872–882. [DOI] [PubMed] [Google Scholar]
Associated Data
This section collects any data citations, data availability statements, or supplementary materials included in this article.
Supplementary Materials
Supplemental Videos 3A: The corresponding complete reconstructed vibratory cycles for: (A) SLN0/RLN1
Supplemental Videos 3B: The corresponding complete reconstructed vibratory cycles for: (B) SLN0/RLN5
Supplemental Videos 5A: Videos of the reconstructed full larynx glottal cycles for: (A) SLN0/RLN1
Supplemental Videos 3C: The corresponding complete reconstructed vibratory cycles for: (C) SLN10/RLN5.
Supplemental Videos 5B: Videos of the reconstructed full larynx glottal cycles for: (B) SLN0/RLN5
Supplemental Videos 5C: Videos of the reconstructed full larynx glottal cycles for: (C) SLN10/RLN5.


