

Abstract
For a healthy society to exist, it is crucial for the media to focus on disease-related issues so that more people are widely aware of them and reduce health risks. Recently, deep neural networks have become a popular tool for textual sentiment analysis, which can provide valuable insights and real-time monitoring and analysis regarding health issues. In this paper, as part of an effort to develop an effective model that can elicit public sentiment on COVID-19 news, we propose a novel approach Cov-Att-BiLSTM for sentiment analysis of COVID-19 news headlines using deep neural networks. We integrate attention mechanisms, embedding techniques, and semantic level data labeling into the prediction process to enhance the accuracy. To evaluate the proposed approach, we compared it to several deep and machine learning classifiers using various metrics of categorization efficiency and prediction quality, and the experimental results demonstrate its superiority with 0.931 testing accuracy. Furthermore, 73,138 pandemic-related tweets posted on six global channels were analyzed by the proposed approach, which accurately reflects global coverage of COVID-19 news and vaccination.
Keywords: Sentiment analysis, News media, Deep learning, COVID-19, Vaccine
Introduction
The news media has an essential role in democratic societies, as the media is not just a news source; but it is a reference for timely information and a platform for discussion and criticism, which dramatically affects the formation of public opinion. News travels fast, and with every hour, a new story about education, science, technology, sports, and politics worldwide is published. The news represents an essential aspect of the media in our contemporary world. It always remains an effective way to follow up on events and their developments amid the considerable number of headlines attracted by the various forms of communication. Even though newspapers and televised programming are huge sources of information, social media platforms like Meta (formerly Facebook) and Twitter are becoming more relevant to news consumption and peer discussions [51].
These platforms act as one of the primary sources of information for the public, together with more traditional news media outlets. This is a massive shift in the world of media. Such platforms are becoming more common and are integral parts of society. In this sense, they have been identified as fundamental drivers of people’s perceptions and opinions, which directly impact their behavior. As a result, information is essential to contribution to people’s behavior in a digital society, and it can also help develop a deeper understanding of the phenomena underlying these behaviors. There is no doubt that the COVID-19 pandemic is the first of its kind in this modern era concerning size and impact, being that it affected the entire world, endangered health, and changed lives in several ways. As the impact of the COVID-19 pandemic was not only limited to health, but also exceeded into several areas, including economy, global politics, education, and culture [33]; with that, the effects of the pandemic may extend for several decades to come unless an effective solution appears that stops the spread and emergence of mutants from this virus. A global pandemic causes significant stress that amplifies general uncertainty across nations. Globally, as of February 12, 2022, COVID-19 has infected over 404 million people, has taken over 5.7 million human lives,1 and is continuously spreading. This pandemic has disrupted almost every aspect of social life throughout the world. Since December 2019, the media has been covering the worldwide spread of COVID-19, especially the number of deaths and cases, creating a social context that is almost impossible to avoid [53]. In the event of a pandemic, news, regardless of its form, is a vital source of information and provides public health updates regarding the pandemic. It reflects insight into how the pandemic affects jobs, health, the economy, and public life. The news may also reflect a growing sense of anticipation and anxiety that will likely affect mental health. Therefore, news sentiment has a profound influence on people’s lives, and it is a subject that cannot be ignored. It is also imperative to realize that the news media play a crucial role in shaping public perceptions and being a source of information.
Hence, it is crucial to investigate the emotions shaped by news sources to determine the nature of their spread over time. One of the most effective methods for identifying emotions expressed in unstructured texts is sentiment analysis, as it converts the information into a structured format. Moreover, the emotion process can be understood as an emergent dynamic process that arises from one’s subjective evaluation of significant events [49]. It is a continuously evolving mechanism that allows for increasingly flexible adaptation to environmental changes. Labeling sentiment methods is not just a technical issue; it also involves theoretical considerations. Many previous COVID-19 sentiment analysis studies mainly focused on lexicon-based methods that consider the role of nouns, adverbs, and adjectives [18, 19, 32, 34, 52]. Meanwhile, many studies used machine and deep learning models to perform sentiment analysis based on data labeled by lexicon models [4, 39] or models trained by public datasets [7, 14, 55]. Nevertheless, there was a disregard for the semantic impact of labeling sentiments related to COVID-19 news headlines, which can be misinterpreted, such as a negative or positive COVID-19 test result, which causes deviations in the sentiment analysis result. For instance, the news titled “Australian PM Deputy tests positive for COVID-19 after UK visit" has been interpreted as positive by unsupervised methods, even though it is a negative news item. Additionally, most studies were conducted on data related to the pandemic over a short time frame, which creates a gap in verification of sentiments regarding the focus on global COVID-19 news. As news about the pandemic is increasing every day, there is a need to know the general sentiment of the news media regarding COVID-19 and vaccines to analyze it over time and clarify the general perception of news coverage of the disease.
In this paper, we introduce a systematic approach to analyze the content of six global news channels, namely BBC, CGTN, CNN, DW, RT, and France24 from their respective countries, Britain, China, The United States, Germany, Russia, and France, respectively. We collected our data via Twitter, which has a rich way of interacting with the news, making sentiment analysis of text news very valuable to the application and making it possible to discover previously unknown information [16]. Thus, we investigate news coverage in spreading information about COVID-19 based on data from January 2020 to December 2021. As part of an effort to develop an effective model that can elicit public sentiment on COVID-19 news, we have adopted approaches based on deep learning to enhance the sentiment prediction mechanism for COVID-19 headlines. Additionally, we propose the Cov-Att-BiLSTM model based on BiLSTM and self-attention mechanisms at the training layer to acquire a high-level semantic representation of the news text. Furthermore, we evaluate our model against several deep and machine learning classifiers using different embedding methods and various metrics of categorization efficiency and prediction quality. Also, we discuss methodological issues in sentiment labeling for the COVID-19 pandemic and suggest an improved approach to sentiment labeling that considers the semantics associated with the sentiment in the text. Moreover, we investigate the efficiency of the proposed approach against the unsupervised labeling methods. Finally, we explore news media sentiments related to COVID-19 and vaccines and how they have evolved over time. The main contributions of our research can be summarized as follows:
A dataset of 73,138 COVID-19 news tweets collected from January 2020 to December 2021, which offers insights into developing and reopening a series of COVID-related studies in the media. It is continuously maintained and publicly available on GitHub.2
An improved approach to sentiment labeling has been proposed that considers the semantics associated with the sentiment in the text based on manual and unsupervised learning methods to avoid bias in labeling data.
A reliable and powerful model to predict the sentiments of news related to COVID-19 and its vaccine has been developed and verified based on a global large-scale pandemic news dataset. Metric results showed significant improvements over unsupervised labeling methods in manual label data.
A detailed comparison of several machine and deep learning classifiers for COVID-19 news sentiment analysis using recent embedding methods (Glove, Word2Vec, and FastText) has been performed. On all models, the embedding methods were evaluated in terms of the sentiment predictive and performance using statistical analysis and several metrics.
A comprehensive analysis of the sentiments reported by global news channels regarding COVID-19 and vaccine types has been conducted and discussed over time, as well as the media impartiality in reporting COVID-19 news across countries.
The rest of the paper is organized as follows: Background provides an overview and analytical discussion of news media and health sentiment analysis, and our motivation for this study. The subsequent section reviews related works of sentiment analysis classification and sentiment labeling methods for COVID-19 data. Then our data collection scheme, detailed information on data cleaning, and our proposed approach for data labeling are presented. Methods presents the neural network architecture of the proposed model and experiment configuration. The penultimate section presents and discusses the results of classification experiments and a comprehensive analysis of global news coverage of COVID-19. In the final section, we wrap up our work and discuss the future work.
Background
News media and health sentiment analysis
There has been a great development in the news industry and its production methods in the last decade of the last century. As a result of this development, there has been a major change in how news is presented, formulated, edited, and the form in which it reaches its audience. The press news media is no longer just an ordinary description of a specific event that receives attention, but also it has become a distinct industry with its unique characteristics. This industry entered and interacted with several factors that contributed to developing its methods, means, and delivery methods to the public. Hence, the news is an essential component of media production, whether on the radio or television, in the press, or satellite broadcasting networks. On the other hand, social media has evolved into a vital part of daily life and a powerful tool for analyzing information [20]. In addition, it is an integral part of the news source that people rely on, and it is easy and widely available for information exchange. The traditional media benefited from the tremendous expansion of social networks, which imposed a novel influence characterized by rapid spread and permanence.
The widespread popularity of Twitter has made it an effective platform for exchanging news, especially concerning emergency events, such as the COVID-19 pandemic. Thus, the news media has adopted this platform as a way to guide users to specific stories, events, and news, which may lead to a larger audience for news content. Additionally, Twitter can provide an alternative direct platform for traditional news organizations to reach a wider audience, especially young people who are less likely to watch TV and read newspapers, so it has become increasingly necessary for news organizations working 24-h to demonstrate a significant interest in social media.
Moreover, health issues receive a lot of media coverage, providing a unique and timely contribution to health crises by conveying information and events during crises, especially when a new pandemic emerges. Hence, understanding how health issues are covered in the news media and their sentiment analysis can help to gain valuable insights from news reports and allow for effective decision-making, monitoring, and analysis in real-time concerning the pandemic outbreak. Furthermore, emotions profoundly impact the way individuals think and behave as well as have the ability to influence a wide range of human activities [1]. Therefore, identifying the major sentiments of the news media and how they have evolved over time is useful to understand their main concerns during the pandemic regarding the media. This provides a record of their affinities, interests, and opinions that constitute an invaluable resource for evaluating events and news in times of crises. Also, public health organizations can benefit from sentiment management to spread reliable and accurate information through the news media [56].
Motivation
It is essential to note that health is not only a biological issue in itself but also a cultural, economic, and social issue simultaneously. Sentiment analysis can be widely used to monitor and explore pandemic-related news and other scenes, and it is an excellent complement to existing medical methods. Therefore, when analyzing sentiments associated with infectious diseases, different motivation levels and importance appear depending on who is doing it. For the media, the purpose is to obtain a better insight into the sentiments, emotions, and topics accompanying tweets related to the pandemic. This will help them assess and adjust their strategies, identify the audience’s needs, and thus effectively deliver news and information during crises. In addition, for health officials, public health support enables authorities to prevent outbreaks and avoid a large number of infections. Thus, reducing the cost of health care when applying a preventative rather than a curative approach. A major part of protecting lives is slowing the transmission of infection through increased public awareness to further control and reduce the spread of the disease. On the other hand, social scientists hope to investigate the behavior patterns, attitudes, and general concerns that the COVID-19 pandemic has triggered among individuals, communities, and cultures. Sentiments will facilitate studying, comparing, and interpreting different perspectives from communities, nations, and others.
Applicability
In recent years, there has been a substantial increase in the number of people actively involved on social media platforms, which provides a huge amount of data for continuous research [62]. Thus, comments, posts, reviews, retweets, likes and statuses are different ways of expressing opinions, making sentiment analysis behind them a promising area of research. Following is a brief discussion of some of the potential applications of our study. Although this paper is intentionally not intended to develop an entirely novel theory of sentiment analysis, there are two major contributions in this study that could contribute to future research on sentiment analysis. First, the presented data will allow researchers to conduct analysis at different levels to examine reasonable behavioral differences in global news coverage during the emergence of the COVID-19 pandemic. Second, the proposed approach can be adapted into a new theoretical framework for detecting and validating societal sentiments in healthcare research. On the other hand, academics can extend the current research by utilizing our comparisons and thus help develop and reopen a series of relevant public sentiment analysis studies. Furthermore, the model will also be extremely useful for practitioners who need to learn about society sentiments by applying the model directly to their dataset, as technology-supported sentiment analysis offers many opportunities to make instant decisions related to various topics.
Related work
Sentiment observation involves investigating people’s perceptions, attitudes, feelings, perspectives, and evaluative judgments regarding various entities [8]. Sentiment analysis is one of the most popular research areas, which uses various text mining techniques to identify and extract subjective information [46]. In recent years, it has grown rapidly, and many approaches have been developed, including lexicon-based, machine learning, and deep learning methods [62]. Lexicon-based approaches identify words with clear emotional content based on pre-configured lexicons that contain words with a variety of polarities, such as WordNet [38], AFINN [40], and SentiWordNet [15].
A sentiment analysis task can be considered a supervised or unsupervised approach to identifying sentiments. In the case of the supervised sentiment classification, it is necessary to label the dataset to determine which category the data belongs to (positive, negative, or neutral) [10]. Several different factors affect how emotional content, signs that convey emotion, and context are labeled. These include representational issues, consensus and disagreement, and links between states and events [12]. Emotional expression depends on the timing of event-related signs [48]. Without knowing about the circumstances that elicited an emotional expression, it is not easy to understand the meaning of the expression. The semantic approach offers ways of representing the meaning of a label, which is essential for using the label in functional models. It is imperative to recognize the state and what it may lead to, so using labels with that semantic structure is useful to provide the right classification.
Due to the difficulty of labeling data manually, researchers utilized some standard machine learning techniques in the sentiment analysis task, namely Linear Support Vector Machines (SVM), Logistic Regression (LR), K-Nearest Neighbors (KNN), Decision Tree (DT), and Bernoulli Naïve Bayes (BNB). Researchers have also applied Deep Learning (DL) techniques, namely LSTM, GRU, BiGRU, and BiLSTM, and achieved impressive results. Deep learning models facilitate the word embedding more robustly than other approaches and encode grammatical and semantic information more effectively, representing text content with highly accurate semantics [59].
Recently, several promising studies have suggested several different solutions to improve the accuracy of sentiment analysis by combining techniques such as embedding, attention, and topic modeling with DL models. Yadav and Vishwakarma [63] presented a deep language-independent Multilevel Attention-based Conv-BiGRU network (MACBiG-Net), that employs both embedding and attention mechanisms at sentence-level and word-level to extract the sentiments. Dai et al. [13] presented a hybrid semantic-topic co-encoding network with a semantics-driven topic encoder to combine topic embeddings and a forward self-attention network to classify social emotions based on their semantics. Zulqarnain et al. [70] have designed Two State Gated Recurrent Units (TS-GRU) with feature attention mechanisms to identify and categorize sentiment polarity using word-feature seizing.
In addition to that, the COVID-19 pandemic has motivated researchers in the area of sentiment classification to explore many issues. Several studies [2, 31] were conducted about the mental health problems among individuals due to the pandemic outbreak, which has led to various psychological effects. Similarly, several studies [17, 45, 57] have investigated people’s behavior, attitudes, and how they respond to crises by utilizing sentiment labels to analyze their opinions and sentiments during the pandemic. Correspondingly, several studies [23, 64] conducted a descriptive analysis of COVID-19 vaccines using sentiment analysis to determine public attitude toward vaccination and get a better understanding of their attitudes and concerns about the vaccine’s safety. Additionally, an investigation was conducted on news media using sentiment analysis [3, 18, 60] to examine the impact of news about events around citizens and its impact on their lives.
As part of the analysis of the sentiments provoked by the COVID-19 pandemic, several methods have been applied to label the sentiments. Various studies have used unsupervised methods and applied one data labeling method [47]; other studies employed two data labeling methods [19], while others employed three data labeling methods of agreement [18]. However, others resorted to using open-source data to train their models [7]. Additionally, researchers have used a manual approach to label sentiment [44]. Nevertheless, there was a disregard for the semantic impact of labeling sentiments related to COVID-19 data, which may be wrongly interpreted and cause deviations in the sentiment analysis result, such as a negative or positive COVID-19 test result. Additionally, these studies were conducted on data related to the pandemic over a short time frame, which creates a gap in the verification of sentiments regarding the diversity of COVID-19 data. Table 1 summarizes the primary keys of a variety of studies conducted on sentiment analysis of COVID-19 pandemic data, as well as the methods used to label the data.
Table 1.
Comparison of studies on data labeling methods related to COVID-19 pandemic
| Ref no. | Data source | Data volume | Duration of data | Data labeling method | Motivation of work |
|---|---|---|---|---|---|
| [47] | 293,597 | Apr 2020–May 2020 | Syuzhet | Developing a new public sentiment scenario framework based on sentiment polarity | |
| [32] | 2,678,372 | Nov 2020–Jan 2021 | Vader | Discover themes and temporal trends in tweets about COVID-19 vaccines as well as variations in sentiment over time | |
| [36] | 11,641 | Dec 2020–May 2021 | TextBlob | Analyzing the opinions and sentiments expressed by people regarding COVID-19 vaccine as revealed in their comments on Reddit | |
| [3] | 9705 | Jan 2020–Aug 2020 | Vader | Analyzing the opinions and sentiments expressed by official news headlines from Iran and Turkey using unsupervised learning approaches | |
| [39] | 90,000 | Feb 2020–Mar 2020 | TextBlob | Analyzing the opinions related to COVID-19 by focusing on Twitter users interacting and sharing social media during the early stages of the pandemic | |
| [5] | 14,000 | Mar 2020–Mar 2020 | Manual labelled | Analyzing the Arabic tweets about distance learning in Saudi Arabia during the COVID-19 outbreak and measuring the acceptance rate in this way by analyzing the sentiments of people’s tweets | |
| [4] | 125,906 | Dec 2020–Jul 2021 | Vader | Analyzing the responses from Twitter data to understand the diverse sentiments about the vaccination process | |
| [7] | 1,056,049 | Jan 2020–Apr 2020 | Model trained on Stanford Sentiment140 dataset | Analyzing COVID-19 tweets using a deep learning model based on fusion-based learning | |
| [28] | 458,116 | Non | TextBlob | Using deep learning algorithms to analyze COVID-19 tweets for sentiment analysis | |
| [68] | 94,707,264 | Jan 2020–May 2020 | Vader | Utilization of massive text data posted on Twitter to analyze sentiment dynamics during the influenza pandemic in New South Wales (NSW), Australia | |
| [44] | 11,960 | Jan 2020–Dec 2020 | Manual labelled | Analyzing COVID-19 tweets using ensemble machine learning classifiers | |
| [55] | 32,334 | Jan 2020–Nov 2020 | Receptiviti API | Analyzing Twitter data to detect the sentiment of citizens and toward technology before and after COVID-19 pandemic in smart cities | |
| [66] | 10,033 | Apr 2020–Jun 2020 | Jieba | Identifying characteristics and causes of virtual tourists’ sentiment during COVID-19 pandemic | |
| [52] | 592,838 | Jan 2020–Apr 2020 | TextBlob | Utilizing BERT model to analyze the sentiment of people regarding the impact of Coronavirus on social life | |
| [19] | 2741 | Apr 2020–Apr 2020 | TextBlob and VADER | To explore the sentiments of Indian people toward the nationwide lockdown that the Indian government enforced to reduce unemployment rate and the spread of COVID-19 | |
| [10] | Internet | Over 6.34 million | Mar 2020–May 2020 | AFINN | Using a composite set of textual evidence collected from a large number of online news sources for determining the current prevailing sentiment of the ongoing pandemic |
| [34] | Internet | 2575 | Apr 2020–Jun 2020 | VADER | Analyzing how headlines from COVID-19 have affected the global economy |
| [14] | Kaggle | 2867 | Apr 2020–Jul 2020 | IBM Watson Discovery | An AI-based time series analysis of news sentiment to restrict the spread of COVID-19 in Houston |
| [18] | Internet | 10,727 | Jan 2020–Dec 2020 | VADER, Textblob, and SentiWordNet | Analyzing COVID-19 news across four countries using topic modeling and sentiment analysis |
|
Our work |
73,138 | Jan 2020–Dec 2021 | VADER, Textblob, Roberta-base, and Manual labeling | Analyzing COVID-19 news across six global news channels using deep learning models and improving sentiment labeling by considering the semantics associated with the sentiments in COVID-19 data and developing a reliable model to predict news sentiments related to COVID-19. A detailed comparison of several machine learning and deep learning classifiers for COVID-19 sentiment analyses has been performed |
Data
Data collection and cleaning
Twitter datasets from BBC, CGTN, CNN, DW, RT, and France24 were gathered using Twitter API. All tweets posted by these channels between January 01, 2020, and December 31, 2021, were retrieved, including their original text and post time. Hence, we have collected 328,370 tweets from all channels, and all tweets are in English. We were able to identify COVID-19 tweets by filtering the tweets’ contents for words related to the pandemic, such as “Epidemic, Coronavirus, Quarantine, Vaccine", and “COVID-19", and the total number of tweets left is 73,138 tweets. Additionally, we looked for words related to the vaccine in the tweets’ content, such as vaccination, AstraZeneca, Pfizer, Sputnik, and Sinopharm. Table 2 shows a summary of the tweets collected from news channels.
Table 2.
Summary of tweets collected from news channels
| Tweet preference | Total | CNN | BBC | CGTN | DW | RT | France24 |
|---|---|---|---|---|---|---|---|
| All tweets | 328,370 | 79,833 | 27,649 | 78,785 | 30,349 | 75,263 | 36,491 |
| COVID-19 tweets | 73,138 | 19,943 | 5224 | 21,273 | 6858 | 10,818 | 9022 |
| Vaccine tweets | 10,184 | 2345 | 695 | 3075 | 1075 | 1901 | 1093 |
| All unique words | 620,601 | 181,593 | 69,670 | 176,752 | 74,128 | 179,964 | 120,382 |
| COVID-19 unique words | 165,029 | 56,610 | 17,289 | 58,646 | 21,410 | 37,915 | 34,752 |
Data cleaning and pre-processing were conducted using the NLTK3 library in Python. Data are cleaned to detect and remove incorrect or inconsistent tweets to improve the data’s quality [43]. The basic cleaning of the text is done by removing punctuation, URLs, and mentions. Meanwhile, for hashtags which typically represent topics, such as #Quarantine, #StayHome, we remove the character representing the hashtag, not the hashtag text. Then, we convert all uppercase to lowercase to avoid being confused with a different word because of the capitalization. In addition, all tabs and line breaks are replaced with a blank.
Data labeling
Labeled data are essential in any supervised machine learning approach, and it is tough to manually label the sentiments of a large number of news tweets. Several studies have used unsupervised methods based on lexicons and pre-trained models to identify sentiments in data, as shown in Table 1. The disadvantage of these methods is that they do not consider the text’s semantic meaning in some cases. Therefore, we propose a hybrid approach for labeling sentiments based on the unsupervised and manual labeling approaches.
Unsupervised labeling approach
Sentiments are labeled on the data using three pre-trained models, which are as follows:
- TextBlob4 is an efficient library for natural language processing that operates on Python and supports many tasks, including sentiment analysis. It computes the polarity score of text, a number in the range of [– 1, 1], to identify the type of sentiment expressed in the text based on Eq. 1.
where SentiT indicates the sentiment type and sp indicates the sentiment polarity.1 - Vader5 is a tool for analyzing sentiment using lexicons and rules [24]. It is designed specifically for sentiments expressed on social media platforms, but it can also process texts from other domains. It provides a compound score, a float that lies in the range of [– 1, 1], for identifying the sentiments in the text based on Eq. 2.
where SentiV indicates the sentiment type and cs indicates the compound score.2
where SentiRo indicates the sentiment type and lb indicates the model’s label for the tweet.
We have filtered all COVID-19-related tweets that contain any of the words (positive and negative). Due to the special semantic meaning of some tweets in the pandemic situation, which most unsupervised methods cannot capture, we will manually label the sentiments and discuss this issue in the manual labeling approach. Then, we kept the tweets in which the three models agreed on their label and ignored the tweets labeled differently. We only had 14,487 tweets remaining (Dataset1) for an unsupervised labeling approach and 2187 tweets remaining (Dataset2) for a manual labeling approach. We present a pseudo code for a detailed data labeling process phase in Algorithm 1.
Manual labeling approach
It is essential to realize that the semantic meaning of the words ‘positive’ and ‘negative’ is quite different when used in conjunction with information about the results of a COVID-19 test. The semantic interpretation generated when these words are used in daily life has a very different meaning compared to COVID-19. Therefore, most unsupervised sentiment classification models cannot predict the correct classification of this type of text. Manually labeling COVID-19-related tweets containing these words resolves the conflict. To label the tweets in Dataset2, two independent annotators familiar with both sentiment analysis and machine learning algorithms manually annotated processed tweets into positive, negative, and neutral. Then, we computed the human agreement for labeled tweets using Cohen’s Kappa coefficient (κ), which is a reliability coefficient for evaluating the accuracy of the agreement between two annotators who annotate I items into C mutually exclusive classes [11]. The definition of κ is based on Eq. 4.
| 4 |
where denotes the observed actual agreement among annotators, denotes the hypothetical probability of the chance agreement, and κ = 1 for the complete agreement between annotators. Cohen’s Kappa coefficient values were 93%, indicating that the annotation procedure was accurate and consistent. Then, we assigned disagreement-containing tweets to a third senior annotator, and we determined the final label of the tweet based on a majority vote. Table 3 shows samples of manual sentiment labeling for some tweets along with unsupervised methods.
Table 3.
Sentiment labels for tweets from manual labeling process
| Tweet | Manual | Vader | TextBlob | Roberta |
|---|---|---|---|---|
| Australia deputy PM tests positive for COVID-19 after UK visit | Neg | Pos | Pos | Neu |
| South African President Cyril Ramaphosa has tested positive for COVID-19 and is experiencing mild symptoms, his office said | Neg | Pos | Pos | Neu |
| Travelers entering Germany from abroad will now need to provide a negative COVID test—unless they’re vaccinated or have recovered | Pos | Neg | Neg | Neg |
| U.S. Vice President Mike Pence and his wife have tested negative for COVID-19, according to his press secretary | Pos | Neg | Neg | Neg |
| Students who wish to leave the locked-down campus will need a negative test taken within the last 48 h | Neu | Neg | Neg | Neg |
| What happens when you do not have any of the COVID-19 symptoms but you still test positive for the virus? | Neu | Neg | Pos | pos |
Methods
Here, we describe the proposed neural network architecture that takes advantage of the approach proposed by Zhou et al. [69], along with suggestions for adjusting hyper-parameters made by Yu and Zhu [65] to set value hyper-parameters of the adopted sentiment classification model. In detail, we describe the embedding methods used to learn the semantic information of the sentence and introduce our training dataset obtained through our labeling approach. Finally, we describe the comparison models and metrics used to measure the performance and prediction quality of COVID-19 sentiment news.
Neural network architecture
Here, we outline our approach to develop a model for sentiment prediction of COVID-19 news headlines based on deep learning to enhance sentiment prediction. The schematic diagram in Fig. 1 shows the six main layers of the adapted neural network. First, we use an embedding layer to embed higher-dimensional input words into lower-dimensional vectors, which helps capture their context. Then, we add two layers of BiLSTM, considering its efficiency in training, allowing us to train both sides of input sequences rather than just one and learn the local properties of the text. Afterward, the attention layer is added to determine the dependencies between the words by computing the essential weights of the words, which enhances the emotional relationship between segments of the sentence. Next, we add the hidden layer to improve the model’s accuracy. Finally, we use the SoftMax layer that predicts the multinomial probability distribution since the model must perform a multiclass classification task. Table 4 summarizes the symbols used in the proposed neural network architecture.
Fig. 1.

Neural network illustration of Cov-Att-BiLSTM
Table 4.
Key symbols and their notations
| Symbol | Definition |
|---|---|
| Output of the last LSTM unit | |
| Memory from the last LSTM unit | |
| Current input | |
| New updated memory from the LSTM unit | |
| Current output from the LSTM unit | |
| New candidate value of cell state | |
| Bias vector | |
| Parameter matrices | |
| Forgot gate, input gate, and output gate, respectively | |
| Logistic sigmoid function | |
| ReLU | Rectified linear unit function |
| Elementwise multiplication operator | |
| C | Number of classes |
| N | Number of samples |
| Predicted probability value | |
| Corresponding target value | |
| Input vector, (,...,) ∈ | |
| Corresponding target value | |
| Prediction probabilities for each class | |
| y | Ground-truth labels |
Embedding layer
The embedding function retains the meaning of the words in the text, the semantic similarity, and the relationships between the words. It transforms the human vocabulary into a numerical form by representing the word as a vector and storing many hidden associations between words. We investigate three different pre-trained embedding methods in the model: GloVe [42], FastText [26], and Word2Vec [37]. In this layer, text’s words ) are represented as a vector space Rd, where n is the number of words, and d is the size of the Embedding layer.
BiLSTM layer
Long Short-Term Memory (LSTM) is a special kind of Recurrent Neural Networks able to learn long-term steps [22] that operate strongly on multi-type of problems. LSTM is used to solve the exploding gradient problems and store information for longer periods as it has a chain-like structure.
Four interacting units compose the LSTM cell: a cell state, forgot gate, input gate, and output gate. In this layer, we use the Rectified Linear Unit activation function (ReLU) on input and hidden layers whose output is calculated according to Eq. 5.
| 5 |
The cell state unit maintains values over various time intervals, and the other three gates manage the transmission of information into and out of the cell [27]. Figure 1 illustrates the general structure of a single LSTM cell, and Eqs. (6), (7), (8), (9), (10) and (11) show how it works.
| 6 |
| 7 |
| 8 |
| 9 |
| 10 |
| 11 |
LSTM sequence model encodes the sequence’s representation only in the forward direction. Nevertheless, encoding the sequence in the backward direction also provides valuable results, so bidirectional LSTM (BiLSTM) is applied to get representations of a sequence in the forward and backward direction [50]. It expands the amount of input information possible to the network by combining two hidden LSTM layers of different directions to one output. The forward layer reads the input sequence in the forward direction () to generate , while the backward layer reads the input sequence in the reverse direction () to generate . With this method, the output layer can simultaneously get information from the backward and forward directions, and the output at time t of BiLSTM is calculated by connecting and through Eq. 12.
| 12 |
Attention layer
The attention layer enhances the relationship between the emotional elements and can establish an association among words by recognizing some significant words [67]. Moreover, it can provide information about the positioning among words to enhance their connection further. It assigns a weight to the words based on the attention calculation, which emphasizes the emotional words. By applying the attention mechanism to each representation of the BiLSTM layer from Eq. 12, the weight at corresponding to is computed through Eqs. 13 and 14 which calculate the importance of each word in the context position.
| 13 |
| 14 |
In the next step, the representation attention of the word is calculated by selecting a weighted sum of all the words through Eq. 15.
| 15 |
SoftMax layer
In this layer, the output activation function of SoftMax is used to predict the sentiments through Eq. 16.
| 16 |
Model setting
After applying the SoftMax activation function, the categorical cross-entropy loss function is used to estimate the loss of the sentiment classification model during training [35], and the loss value is calculated through Eq. 17.
| 17 |
Additionally, to decrease the categorical cross-entropy loss function, we use Adam’s optimization algorithm to adjust the weights of the network iteratively based on training data [29]. It calculates and adjusts the learning rate of each network weight separately as learning progresses, which leads to better performance with sparse gradient problems in natural languages.
On the other hand, the method of dropping out neurons is used to advance the model’s performance which is an effective way to regularize the neural network and to control overfitting by randomly omitting some neurons [21]. As a result, the nodes’ weights learned by backpropagation are somewhat insensitive to the weights of other nodes and can determine their outcome independently.
Comparison models
We conducted extensive experiments to compare our adopted sentiment classification model with many common classifiers. Specifically, we compared our adapted model to traditional machine learning classifiers, including SVM, DT, KNN, LR, and BNB. Additionally, we evaluated our model with general deep learning models, including LSTM and BiLSTM. The feature selection process uses word embedding methods (Glove, FastText, and Word2Vec) for all deep and machine learning classifiers. In the end, we evaluated our model with unsupervised learning methods for sentiments using Dataset2 taken from manual labeling.
Dataset and hyper-parameter settings
All of the labeled tweets from Dataset1 and Dataset2 have been combined and shuffled, and then the data was divided into training and testing with a ratio of 80 and 20%, respectively. In addition, we have taken 20% from the training set for the validation set. The distribution of sentiment classes for training, validation, and testing datasets are shown in Table 5. We checked the distribution of sentiments in the datasets according to the news channel, date, and sentiment, which was balanced.
Table 5.
Distribution of training, validation, and testing samples
| Dataset | Negative | Positive | Neutral | Total |
|---|---|---|---|---|
| Training | 4156 | 2385 | 4130 | 10,671 |
| Validation | 1015 | 592 | 1061 | 2668 |
| Testing | 1293 | 747 | 1295 | 3335 |
The hyper-parameter values of the sentiment classification model adopted in this study are set according to recommendations made by two studies [54, 65]. Tables 6 and 7 contain a list of the hyper-parameter settings for the proposed model and machine learning classifiers, respectively. As a point of emphasis, all deep-based models share the same hyper-parameters, and we build the features by averaging the word embedding vectors for all words in the text in machine learning classifiers.
Table 6.
Hyper-parameters of Att-BiLSTM proposed model
| Hyper-parameters | Value |
|---|---|
| Embedding dimension | 300 |
| BiLSTM layer | 128 |
| Dense layer | 32 |
| Learning rate | 0.001 |
| Dropout rate | 0.25 |
| Batch size | 64 |
| Epoch number | 8 |
Table 7.
Hyper-parameters of machine learning classifiers
| Classifier | Hyper-parameters | Value |
|---|---|---|
| SVM | C | 1 |
| SVM | Gamma | 1 |
| LR | Penalty | l2 |
| LR | C | 1 |
| KNN | Neighbors | 9 |
| DT | Depth | 20 |
| BNB | Alpha | 0.4 |
Evaluation metrics
Our model performance of sentiment classification is evaluated using four metrics, including Marco Accuracy, Marco Precision, Marco Recall, and Marco F1-score via the formulas 18, 19, 20, 21, respectively.
| 18 |
| 19 |
| 20 |
| 21 |
where C is number of classes, is true positive, is false positive, is false negative, and is true negative for each class Ci. We also evaluate the quality of sentiment prediction using three distance metrics, including Euclidean, Sϕrensen, and SquaredX2 [58] via the formulas 22, 23, 24, respectively.
| 22 |
| 23 |
| 24 |
Results and discussion
Classification experiment results
Here, we describe and discuss the classification performance of our proposed model compared to the other machine learning classifiers based on three base embedding methods. Table 8 shows the results of experiments conducted to investigate the performance of machine learning classifiers using different embedding methods. The performance results of all metrics on the testing dataset indicate that SVM, LR, KNN, BNB, and DT have ranks from 1 to 5, respectively, for all embedding methods. On the testing dataset, SVM and LR with Word2Vec achieve the highest F1 score with 0.865 and 0.857, respectively. There is a 5.3 and 5.5% performance improvement in SVM and LR classifiers, respectively, with Word2Vec compared to FastText and Glove.
Table 8.
Experiment results of the machine learning classifiers’ performance using different embedding methods
| Classifier | Embedding | Training | Testing | |||
|---|---|---|---|---|---|---|
| SVM | FastText | 0.831 | 0.819 | 0.818 | 0.808 | 0.812 |
| LR | FastText | 0.858 | 0.810 | 0.812 | 0.795 | 0.802 |
| KNN | FastText | 0.769 | 0.715 | 0.713 | 0.711 | 0.703 |
| BNB | FastText | 0.684 | 0.689 | 0.674 | 0.675 | 0.674 |
| DT | FastText | 0.629 | 0.576 | 0.563 | 0.555 | 0.558 |
| SVM | Glove | 0.831 | 0.819 | 0.818 | 0.808 | 0.812 |
| LR | Glove | 0.819 | 0.810 | 0.812 | 0.795 | 0.802 |
| KNN | Glove | 0.769 | 0.715 | 0.713 | 0.711 | 0.703 |
| BNB | Glove | 0.675 | 0.682 | 0.669 | 0.673 | 0.670 |
| DT | Glove | 0.629 | 0.576 | 0.563 | 0.555 | 0.558 |
| SVM | Word2Vec | 0.881 | 0.874 | 0.872 | 0.860 | 0.865 |
| LR | Word2Vec | 0.872 | 0.867 | 0.868 | 0.850 | 0.857 |
| KNN | Word2Vec | 0.809 | 0.752 | 0.757 | 0.744 | 0.740 |
| BNB | Word2Vec | 0.710 | 0.720 | 0.706 | 0.708 | 0.707 |
| DT | Word2Vec | 0.634 | 0.594 | 0.571 | 0.560 | 0.561 |
Table 9 shows the results of experiments conducted to investigate the performance of deep learning models using different embedding methods. Our Cov-Att-BiLSTM model achieves the highest accuracy on the validation dataset, achieving 0.930, 0.910, and 0.919 with FastText, Glove, and Word2Vec, respectively. Compared with other models, CovAtt-Bilstm achieves the highest Accuracy, Precision, Recall, and F1 score on the testing dataset. Cov-Att-BiLSTM model with Word2Vec achieves the highest Accuracy, Recall, and F1 score with 0.931, 0.923, and 0.926, respectively. With FastText, Cov-Att-BiLSTM model performs the most effectively, with a precision of 0.931 and a difference of 0.1% from Word2Vec. There is a performance improvement of Cov-Att-BiLSTM with Word2Vec by 1% in the F1 score compared to Glove.
Table 9.
Experiment results of the deep learning models’ performance using different embedding methods
| Classifier | Embedding | Training | Validation | Testing | |||
|---|---|---|---|---|---|---|---|
| LSTM | FastText | 0.925 | 0.906 | 0.910 | 0.912 | 0.898 | 0.904 |
| BiLSTM | FastText | 0.946 | 0.921 | 0.916 | 0.916 | 0.905 | 0.910 |
| Cov-Att-BiLSTM | FastText | 0.952 | 0.930 | 0.929 | 0.931 | 0.919 | 0.924 |
| LSTM | Glove | 0.920 | 0.903 | 0.910 | 0.904 | 0.911 | 0.907 |
| BiLSTM | Glove | 0.951 | 0.909 | 0.907 | 0.902 | 0.901 | 0.902 |
| Cov-Att-BiLSTM | Glove | 0.960 | 0.910 | 0.921 | 0.915 | 0.918 | 0.916 |
| LSTM | Word2Vec | 0.877 | 0.897 | 0.892 | 0.899 | 0.870 | 0.880 |
| BiLSTM | Word2Vec | 0.933 | 0.905 | 0.915 | 0.905 | 0.916 | 0.910 |
| Cov-Att-BiLSTM | Word2Vec | 0.943 | 0.919 | 0.931 | 0.93 | 0.923 | 0.926 |
Regarding F1 score based on Word2Vec, the comparison between Cov-Att-BiLSTM and SVM shows an improvement of 6.1%. Table 10 shows a comparison of the quality of sentiment prediction for different prediction quality metrics based on different embedding methods. According to the results, Cov-Att-BiLSTM model has the most accurate prediction quality, while SVM achieves the most accurate prediction quality among the machine learning classifiers. On the other hand, FastText with our model achieves the most accurate quality among all, with a slight difference from Word2Vec.
Table 10.
An overall comparison of sentiment prediction quality using different embedding methods
| Metrics | Embedding | LSTM | BiLSTM | Cov-Att-BiLSTM | LR | SVM | DT | KNN | BNB |
|---|---|---|---|---|---|---|---|---|---|
| Sϕrensen | Word2Vec | 0.156 | 0.123 | 0.090 | 0.286 | 0.193 | 0.478 | 0.317 | 0.307 |
| Sϕrensen | FastText | 0.141 | 0.102 | 0.084 | 0.306 | 0.201 | 0.458 | 0.338 | 0.334 |
| Sϕrensen | Glove | 0.115 | 0.117 | 0.095 | 0.346 | 0.266 | 0.519 | 0.396 | 0.330 |
| Word2Vec | 0.233 | 0.182 | 0.139 | 0.378 | 0.272 | 0.727 | 0.733 | 0.520 | |
| FastText | 0.201 | 0.162 | 0.137 | 0.405 | 0.284 | 0.703 | 0.747 | 0.562 | |
| Glove | 0.178 | 0.181 | 0.156 | 0.468 | 0.380 | 0.779 | 0.856 | 0.578 | |
| Euclidean | Word2Vec | 0.203 | 0.166 | 0.124 | 0.377 | 0.258 | 0.612 | 0.419 | 0.412 |
| Euclidean | FastText | 0.186 | 0.139 | 0.116 | 0.401 | 0.269 | 0.584 | 0.446 | 0.458 |
| Euclidean | Glove | 0.155 | 0.159 | 0.130 | 0.453 | 0.353 | 0.666 | 0.521 | 0.458 |
The sentiment analysis experiments show that using Cov-Att-BiLSTM with Word2Vec embedding method is better than FastText and Glove across the testing dataset, with a relatively small difference in prediction quality compared to FastText. We have finally chosen Word2Vec with Cov-Att-BiLSTM for predicting tweet sentiment across all news channels.
We perform a statistical analysis to demonstrate the importance of experimental results using robust statistical methods for measuring rank differences, including Kruskal–Wallis H test [30] and Wilcoxon signed-ranks test [61]. The Kruskal–Wallis test is conducted to evaluate the performance of embedding methods and all classifiers on the test dataset, which examines statistically significant differences between three or more independent groups. Table 11 summarizes the statistical analysis results, where null hypotheses are accepted if the P value > 0.05, which means there are no statistical differences between the groups. The Kruskal–Wallis tests indicate no difference in embedding methods between FastText, Glove, and Word2Vec, but it indicates differences in the performance of the classifiers.
Table 11.
A statistical analysis of experimental results based on the Kruskal–Wallis H test
| Independent groups | Measurement type | Kruskal–Wallis H test | Null hypothesis | |
|---|---|---|---|---|
| Statistic | P value | |||
| Embedding methods | ML | 3.3194 | 0.1902 | Accepted |
| DL | 1.3676 | 0.5047 | Accepted | |
| ML + DL | 0.8351 | 0.6587 | Accepted | |
| ML classifiers | ML | 53.2348 | 7.6102e-11 | Rejected |
| DL classifiers | DL | 23.4716 | 8.0023e-06 | Rejected |
Therefore, to analyze these differences, we use the Wilcoxon signed-ranks test, which evaluates statistically significant differences between two independent groups. Table 12 summarizes the statistical analysis results based on the Wilcoxon signed-ranks test, where null hypotheses are rejected between Cov-Att-BiLSTM and other models, which means that Cov-Att-BiLSTM has better performance than others. The Wilcoxon test indicates a difference between SVM and LR, which have the highest results among ML classifiers.
Table 12.
A statistical analysis of experimental results based on the Wilcoxon signed-ranks test
| Independent groups | Measurement type | Wilcoxon signed-ranks test | Null hypothesis | |
|---|---|---|---|---|
| Statistic | P value | |||
| SVM and LR | Embedding methods | 0 | 0.0004 | Rejected |
| BiLSTM and LSTM | Embedding methods | 16 | 0.0771 | Accepted |
| Cov-Att-BiLSTM and LSTM | Embedding methods | 0 | 0.0004 | Rejected |
| Cov-Att-BiLSTM and LSTM | Embedding methods | 0 | 0.0004 | Rejected |
The sentiment analysis experiments and statistical analysis show that using Cov-AttBiLSTM with Word2Vec embedding method is better than FastText and Glove across the testing dataset, with a relatively small difference in prediction quality compared to FastText. We have finally chosen Word2Vec with Cov-Att-BiLSTM for predicting tweet sentiment across all news channels.
Additionally, we analyzed the computational time cost of all models and Table 13 summarizes the time used per second (s) during training all models. All these measurements were conducted on a Windows 10 operating system with 2.20 GHz CPUs (Intel(R) Core (TM) i77500U) and 16 GB RAM. All deep and machine learning classifiers were constructed using the Keras and Scikit-Learn libraries in Python, respectively. In deep learning classifiers, the training time for LSTM is the lowest, while the models trained by word2vec have the lowest training time comparable to FastText and Glove. Besides, we can see that the attention layer in the Cov-Att-BiLSTM model increases the time complexity. In machine learning classifiers, the training time for LR, DT, and BNB is the same, while SVM and KNN have more training time than the aforementioned. The use of deep learning greatly increases the time required for training compared to machine learning. Still, considering the statistical analysis from Tables 11 and 12 and the efficiency from Tables 8 and 9, we find a significant improvement at the expense of time.
Table 13.
Time complexity of all models during training
| Model | Embedding method | ||
|---|---|---|---|
| Word2Vec | Glove | FastText | |
| Compute vectors | 81.34 | 35.78 | 265.31 |
| LSTM | 873 s | 879 s | 827 s |
| BiLSTM | 1529 s | 1589 s | 1832s |
| Cov-Att-BiLSTM | 2708 s | 3036 s | 3881 s |
| SVM | 225 s | 268 s | 240 s |
| LR | 7 s | 7 s | 7 s |
| KNN | 205 s | 227 s | 213 s |
| BNB | 4 s | 4 s | 4 s |
| DT | 8 s | 8 s | 8 s |
To validate whether our model can identify the most relevant parts of a text sequence, Fig. 2 shows the attention layer weights for several sentences in the form of a heatmap, where the model correctly predicted the sentiment labels. The normalized attention weights are displayed in the range of [0,1], and the actual sentiment label of each sentence is displayed at the left. Notably, the attention layer focused on selective parts of the sentence, which influenced the classifier’s decision.
Fig. 2.

A visual representation of attention weights in sample sentences
Additionally, we have checked the performance of our model against unsupervised learning models, including Vader, TextBlob, and ROBERTa in Dataset2, which is the manual-label tweets. Figure 3 shows a comparison of ROBERTa-base, Vader, TextBlob, and our model in terms of Accmarco, Premarco, Recmarco, and F1marco. In terms of F1 score, the results show that Cov-Att-BiLSTM approach outperforms the ROBERTa, Vader, and TextBlob approaches by 52, 67, and 66%, respectively. It is imperative to note that the comparison process reflects a systematic comparison based on the manner of sentiment classification used for epidemiological data and not necessarily a comparison based on the models’ design. In contrast to unsupervised methods, we have found significant results from our sentiment analysis approach applied to COVID-19 news data.
Fig. 3.
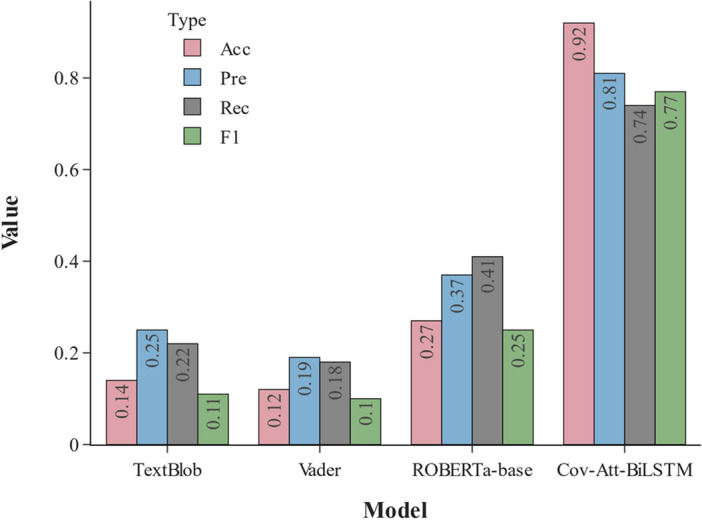
Performance comparison of ROBERTa-base, Vader, Textlob, and our model Cov-Att-BiLSTM in terms of Accmarco, Premarco, Recmarco, and F1marco in the manual-label dataset
News sentiment analysis of COVID-19 and vaccine
By analyzing different news media channels, we investigate the distribution of sentiment associated with each of them. Figures 4 and 5 show sentiment analysis of COVID-19-related news across all channels as bar charts with negative, positive, and neutral percentages. We divided the sentiment analysis process into two stages, the first stage is for all COVID-19-related tweets, and the second stage is only for vaccine-related tweets. This provides a deeper and more accurate understanding of the data and classification results of the proposed model. It also leads to many inferences that help interpret some news events.
Fig. 4.
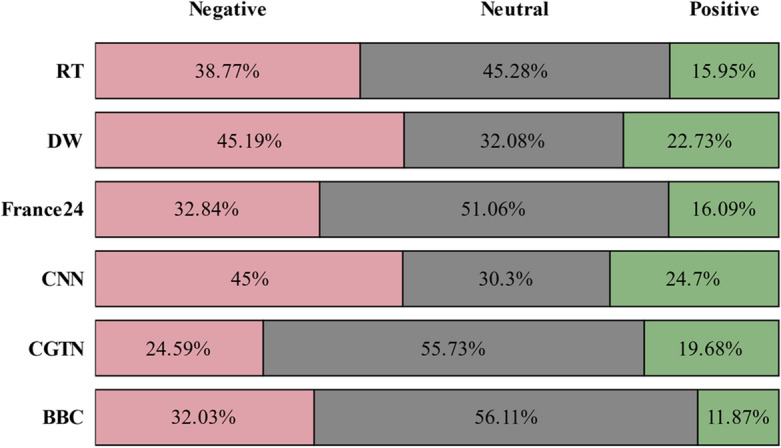
Distribution of COVID-19 news sentiments in news channels
Fig. 5.
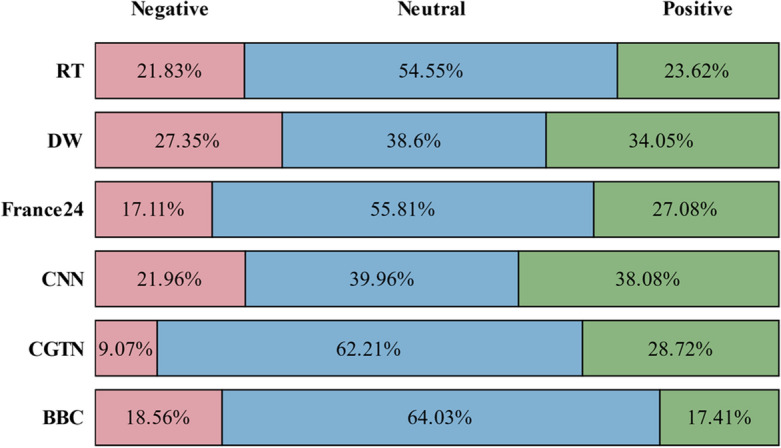
Distribution of vaccine news sentiments in news channels
As expected, since all tweets are pandemic-related news, negative tweet percentages related to COVID-19 are more than positive in all channels as shown in Fig. 4.
Additionally, we note that neutral tweets dominate on all channels except CNN and DW. Interestingly, both CNN and DW have the most positive and negative sentiments toward COVID-19 news compared to the rest of the channels. According to CNN sentiment analysis, positive and negative COVID-19 news sentiments are 24.7 and 45%, respectively. Meanwhile, in DW, positive and negative COVID-19 news sentiments are 22.73 and 45.19%, respectively. On the other hand, Fig. 5 shows that neutral sentiments of vaccine-related tweets dominate other sentiments across all channels.
Furthermore, positive sentiments toward vaccine-related tweets seem to outweigh negative sentiments in all channels except BBC, where positive and negative sentiments are almost equal. A notable observation is that CNN has the highest positivity rate in its coverage of vaccine news, while CGTN has the lowest negativity rate in its coverage of vaccine news. In our study of sentiment behavior, we further analyze these channels in the most detailed way possible. We investigate the most interesting findings in the negative category. Figure 6 shows the high-frequency word distribution of negativity sentiments for each channel. It is shown that words such as “CASE", “DEATH", “TOLL", “TESTED", “POSITIVE", “SPREAD", and “PANDEMIC” are prominently displayed. The names of the countries dominate, especially those to which the channels belong, such as “France", “Russia", “China", “US”, “Germany", and “UK", in France24, RT, CGTN, CNN, DW, and BBC, respectively. Generated word clouds allow us to see the negative side effects of these different words on the news at a glance.
Fig. 6.

Word clouds for the most frequently used words in COVID-19 negative news
Additionally, we correlate the temporal factor to the news reported during the two years to identify some facts that may have motivated these differences in time distribution by dividing each year into four quarters. Figures 7 and 8 show the distribution of COVID-19 and Vaccine sentiments over the quarters of the year in the news channels. As shown in Fig. 7, the second quarter of 2020 represents the greatest volume of COVID-19 news, particularly after three months of the emergence of the pandemic and its global spread. It is interesting to note the decline in the number of COVID-19 news tweets in successive quarters of 2020 and 2021, which we explain by the appearance of an information epidemic in the first and second quarters of 2020 that news channels attempted to draw attention to. In many countries, the pandemic has caused great economic damage [41]. It is imperative to point out that the health crisis has long-term and far-reaching repercussions for the global economy beyond traditional measures. World economic growth fell to – 3.1% in 2020, based on the October 2021 World Economic Outlook [25]. Moreover, global trade also declined 5.3% [9]. Since the second quarter of 2020, economic growth has declined sharply in most countries, picked up quickly in the third quarter, and has partly rebounded ever since [25].
Fig. 7.
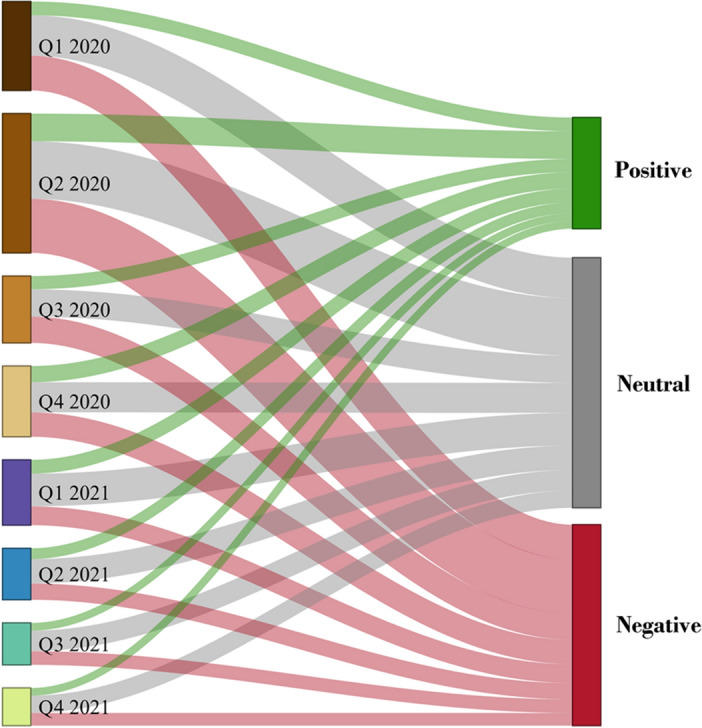
Distribution of COVID-19 tweet sentiments across news channels over the quarters of 2020–2021
Fig. 8.
Distribution of vaccine tweet sentiments across news channels over the quarters of 2020–2021
On the other hand, if we compare with Fig. 8, we find a slow escalation of news about vaccines during the first three quarters of 2020, as scientists were in the process of studying the disease and developing a vaccine for it. Information about vaccines increased dramatically in the last quarter of 2020, reached its peak in the first quarter of 2021, and then decreased slightly.
Media coverage of the events reflects the audience’s interest, which can be associated with a 5.9% increase in global economic growth by 2021 [9]. Looking at the sentimental aspect of the pandemic’s news tweets, we note that COVID-19-related negative news mainly concentrated in the first and second quarters of 2020 and then decreased significantly. In comparison, positive sentiment remained at the same level in the third and fourth quarters of 2020 and the first quarter of 2021. By analyzing the proportions of sentiments in each quarter separately, we find that sentiments have retained their proportion in each quarter empirically, with a bias toward neutral and negative sentiments over positive sentiments. Considering this information, we can conclude that the second quarter of 2020 was the peak period of news coverage regarding the pandemic. Comparatively, the first quarter of 2021 was the peak period for vaccine news. A global health strategy is more critical than ever with the ongoing pandemic. Therefore, to reduce the risk of COVID-19 variants becoming more dangerous, the global availability of vaccines, tests, and treatments is essential. Regarding vaccines, we investigated the sentiment distribution of the types of vaccines to determine how news media cover them. As previously described in filtering news tweets regarding vaccine types, we explore six global vaccines, including AstraZeneca, Pfizer, Moderna, Sinopharm, Sputnik, and Sinovac, that the World Health Organization has approved. A visual representation of the distribution of sentiments associated with each vaccine’s type is shown in Fig. 9, as we can see that the positive rate is significantly higher than the negative rate for all vaccines except the AstraZeneca vaccine, which is not significantly different.
Fig. 9.
Distribution of sentiments regarding vaccine types in news channels
The highest positive rate is in the Pfizer vaccine, while the lowest negative rate is in the Sinopharm vaccine, which also has the highest rate of neutral news. To verify these results and the classification efficiency of Cov-Att-BiLSTM model, we manually reviewed some vaccine type news and listed some examples in Table 14.
Table 14.
Sentiment samples for vaccine-type tweets based on Cov-Att-BiLSTM model
| Channel | Vaccine | Tweet | Sentiment |
|---|---|---|---|
| CNN | Sinovac | The lead scientist on China’s Sinovac vaccine trials in Indonesia died of suspected Covid-19 on Wednesday, Indonesian media said | Neg |
| BBC | AstraZeneca | AstraZeneca vaccine delays are “enormous problem”, Ireland’s deputy prime minister Leo Varadkar says | Neg |
| RT | Pfizer | URGENT:’Great day for science and humanity’: Pfizer says Covid-19 vaccine more than 90% effective in final trials | Pos |
| CGTN | Moderna | Moderna Inc. said Wednesday that it has made a new vaccine designed to target the strain of COVID-19 first identified in South Africa, which has shown some resistance to the company’s original vaccine | Pos |
| DW | Sinopharm | Half a million doses of the Sinopharm vaccine have arrived in Hungary, making it the first EU country to receive a Chinese vaccine | Neu |
| France24 | Sputnik | Russians living abroad travel to Moscow to get Sputnik V Covid-19 vaccine | Neu |
Media impartiality in reporting COVID-19 news across countries
Here, we use the Cov-Att-BiLSTM model to examine the impartiality of news channels and their coverage of COVID-19 news across different countries. Generally, the ratio of impartial news reporting on a country’s pandemic situation indicates the channels’ emotional inclination towards that country. Therefore, to gain insights into the global news channels’ coverage, we focus on their countries along with four countries, namely Brazil, India, Spain, and Italy, which have been strongly affected by the pandemic. We used the Spacy library in Python to extract the geopolitical entity locations in the COVID-19 news texts, and Table 15 summarizes COVID-19 news covering events across countries.
Table 15.
Summary of COVID-19 tweets collected from news channels covering events in different countries
| Country | Total | BBC | CGTN | CNN | DW | France24 | RT |
|---|---|---|---|---|---|---|---|
| Brazil | 1001 | 110 | 311 | 88 | 203 | 218 | 71 |
| China | 5704 | 175 | 3859 | 657 | 243 | 346 | 424 |
| France | 1974 | 86 | 255 | 60 | 139 | 1244 | 190 |
| Germany | 1651 | 63 | 179 | 69 | 1050 | 133 | 157 |
| India | 2024 | 410 | 519 | 215 | 404 | 234 | 242 |
| Italy | 1148 | 102 | 367 | 130 | 142 | 221 | 186 |
| Russia | 1080 | 57 | 319 | 47 | 109 | 62 | 486 |
| Spain | 648 | 75 | 203 | 44 | 86 | 146 | 94 |
| UK | 1659 | 125 | 544 | 318 | 168 | 207 | 297 |
| US | 8434 | 499 | 2921 | 3259 | 519 | 575 | 661 |
Figure 10 shows how news about the pandemic is distributed among countries. The middle part shows the ratio of neutral news coverage that prevailed over positive and negative coverage in most countries except India and Brazil. Taking another aspect of the principle of impartiality into consideration, we take a closer look at the ratio of negative articles and positive news during COVID-19 for different countries. Among the countries that have received the fewest ratio of negative media coverage is China, whereas Russia has received the most positive media coverage.
Fig. 10.

Distribution of sentiments regarding COVID-19 news in different countries
Nonetheless, we expand our approach to investigate the source of impartiality in the news about these countries. Figure 11 shows the distribution of negative, neutral, and positive coverage by the channels for each country. As expected, a significant proportion of the negative, neutral, and positive news coverage in France, China, the US, France, and Germany comes from its affiliated channels. In the UK, CNN and RT provided a significant proportion of the negative coverage regarding the pandemic, whereas CGTN provided a significant proportion of the positive and neutral coverage. According to the figure, the BBC monitors events in other countries differently than the rest of the channels, mainly since it focuses less on events in the UK than other countries, enhancing its impartiality in reporting news globally. Media reports about channel countries often differ from the actual situation. Therefore, comparing these channels’ coverage for Brazil, India, Italy, and Spain reveals more fairness. The media coverage of events in these countries appears to be consistent where there are no deviations.
Fig. 11.

Analysis of sentiments regarding COVID news coverage of channels in different countries. a Negative sentiments. b Natural sentiments. c Positive sentiments
Conclusion and future work
The COVID-19 pandemic has become one of the most serious health threats to humanity in recent decades. Researchers are relentlessly working to prevent the dangerous consequences of this pervasive pandemic. In this paper, as part of an effort to develop an effective model that can elicit public sentiment on COVID-19 news, we proposed the Cov-Att-BiLSTM model for sentiment analysis of COVID-19 news headlines using deep neural networks. To evaluate the performance of the proposed model, we used different embedding methods and various metrics of categorization efficiency and prediction quality against several machine learning classifiers. Experiments have demonstrated the superiority of our proposed model, which with Word2Vec achieved 0.931 testing accuracy. In addition, we discussed methodological issues in sentiment labeling for the COVID-19 pandemic and suggested an improved approach to sentiment labeling that considers the semantics associated with the sentiment in the text. We investigated the efficiency of the proposed approach against the unsupervised labeling methods, and the metrics results showed a significant improvement in performance with our model in manual-label data. Furthermore, the results illustrated depicts how news media covered the pandemic from January 2020 to December 2021 and how sentiments have changed over time. This paper has some limitations, as the proposed model was not compared to many innovative sentiment analysis models based on deep learning, the comparison was however, limited to machine learning classifiers along with LSTM and BiLSTM models. On the other hand, we only examined six news channels, which is a very small sample of the many news channels available, so we suggest interpreting our results with caution.
However, our approach was carefully planned, and we believe that our analysis provided an accurate reflection of how global channels covered the news of the COVID-19 pandemic and vaccination. Despite the study’s limitations, it still offers researchers and practitioners in the field of sentiment analysis and journalism much to think about. We hope that the proposed enhanced sentiment analysis model, along with the exclusive data, will support the research and development process within the healthcare field. Our future work will use topic modeling to investigate the significant themes of COVID-19 news and the public’s reaction to them through influence spread models. We will analyze global news channels’ strategies and their influence on public opinion from the perspective of news text sentiments.
Acknowledgements
The authors would like to thank the editors and anonymous reviewers for their valuable comments that have helped to improve the paper.
Funding
National Natural Science Foundation of China, 62172167, Bang Wang.
Data availability
The data that support the findings of this study are available from the corresponding author, Han Xu, upon reasonable request.
Declarations
Conflict of interest
On behalf of all authors, the corresponding author states that there is no conflict of interest.
Footnotes
Publisher's Note
Springer Nature remains neutral with regard to jurisdictional claims in published maps and institutional affiliations.
Contributor Information
Waseem Ahmad, Email: waseem.cath47@outlook.com.
Bang Wang, Email: wangbang@hust.edu.cn.
Philecia Martin, Email: phileciamartin@gmail.com.
Minghua Xu, Email: xuminghua@hust.edu.cn.
Han Xu, Email: xuh@hust.edu.cn.
References
- 1.Abercrombie G, Batista-Navarro R. Sentiment and position-taking analysis of parliamentary debates: a systematic literature review. Journal of Computational Social Science. 2020;3(1):245–270. doi: 10.1007/s42001-019-00060-w. [DOI] [Google Scholar]
- 2.Agarwal A, Agarwal B, Harjule P, Agarwal A. Predictive and preventive measures for Covid-19 pandemic. Singapore: Springer; 2021. Mental health analysis of students in major cities of India during COVID-19; pp. 51–67. [Google Scholar]
- 3.Ahmad W, Wang B, Han Xu, Minghua Xu, Zeng Z. Topics, sentiments, and emotions triggered by COVID-19-related tweets from iran and turkey official news agencies. SN Computer Science. 2021;2(5):1–19. doi: 10.1007/s42979-021-00789-0. [DOI] [PMC free article] [PubMed] [Google Scholar]
- 4.Alam, K. N., Khan, M. S., Dhruba, A. R., Khan, M. M., Al-Amri, J. F., Masud, M., & Rawashdeh, M. (2021). Deep learning-based sentiment analysis of COVID-19 vaccination responses from twitter data. Computational and Mathematical Methods in Medicine, 2021. [DOI] [PMC free article] [PubMed] [Retracted]
- 5.Aljabri M, Chrouf SM, Alzahrani NA, Alghamdi L, Alfehaid R, Alqarawi R, Alhuthayfi J, Alduhailan N, et al. Sentiment analysis of Arabic tweets regarding distance learning in Saudi Arabia during the COVID-19 pandemic. Sensors. 2021;21(16):5431. doi: 10.3390/s21165431. [DOI] [PMC free article] [PubMed] [Google Scholar]
- 6.Barbieri, F., Camacho-Collados, J., Neves, L., & Espinosa-Anke, L. (2020). Tweeteval: unified benchmark and comparative evaluation for tweet classification. arXiv preprint arXiv:2010.12421.
- 7.Basiri ME, Nemati S, Abdar M, Asadi S, Rajendra Acharrya U. A novel fusion-based deep learning model for sentiment analysis of COVID-19 tweets. Knowledge-Based Systems. 2021;228:107242. doi: 10.1016/j.knosys.2021.107242. [DOI] [PMC free article] [PubMed] [Google Scholar]
- 8.Caliskan C. How does a bit of everything American state feel about COVID-19? A quantitative twitter analysis of the pandemic in Ohio. Journal of Computational Social Science. 2021;5(1):19–45. doi: 10.1007/s42001-021-00111-1. [DOI] [PMC free article] [PubMed] [Google Scholar]
- 9.Caseloads, R. (2022). World economic outlook. World Economic Outlook.
- 10.Chakraborty A, Bose S. Around the world in 60 days: an exploratory study of impact of COVID-19 on online global news sentiment. Journal of Computational Social Science. 2020;3(2):367–400. doi: 10.1007/s42001-020-00088-3. [DOI] [PMC free article] [PubMed] [Google Scholar]
- 11.Cohen J. A coefficient of agreement for nominal scales. Educational and psychological measurement. 1960;20(1):37–46. doi: 10.1177/001316446002000104. [DOI] [Google Scholar]
- 12.Cowie R, Cox C, Martin J-C, Batliner A, Heylen D, Karpouzis K. Emotion-oriented systems. Heidelberg: Springer; 2011. Issues in data labelling; pp. 213–241. [Google Scholar]
- 13.Dai L, Wang B, Xiang W, Minghua X, Han X. Pacific-Asia conference on knowledge discovery and data mining. Cham: Springer; 2022. A hybrid semantic-topic co-encoding network for social emotion classification; pp. 587–598. [Google Scholar]
- 14.Desai PS. News sentiment informed time-series analyzing ai (Sitala) to curb the spread of COVID-19 in Houston. Expert Systems with Applications. 2021;180:115104. doi: 10.1016/j.eswa.2021.115104. [DOI] [PMC free article] [PubMed] [Google Scholar]
- 15.Esuli, A., & Sebastiani, F. (2006). Sentiwordnet: A publicly available lexical resource for opinion mining. In Proceedings of the fifth international conference on language resources and evaluation (LREC06).
- 16.Fire M, Goldschmidt R, Elovici Y. Online social networks: threats and solutions. IEEE Communications Surveys & Tutorials. 2014;16(4):2019–2036. doi: 10.1109/COMST.2014.2321628. [DOI] [Google Scholar]
- 17.Garcia K, Berton L. Topic detection and sentiment analysis in twitter content related to COVID-19 from Brazil and the USA. Applied Soft Computing. 2021;101:107057. doi: 10.1016/j.asoc.2020.107057. [DOI] [PMC free article] [PubMed] [Google Scholar]
- 18.Ghasiya P, Okamura K. Investigating COVID-19 news across four nations: a topic modeling and sentiment analysis approach. IEEE Access. 2021;9:36645–36656. doi: 10.1109/ACCESS.2021.3062875. [DOI] [PMC free article] [PubMed] [Google Scholar]
- 19.Gupta P, Kumar S, Suman RR, Kumar V. Sentiment analysis of lockdown in India during COVID-19: a case study on Twitter. IEEE Transactions on Computational Social Systems. 2020;8(4):992–1002. doi: 10.1109/TCSS.2020.3042446. [DOI] [PMC free article] [PubMed] [Google Scholar]
- 20.Havey NF. Partisan public health: How does political ideology influence support for COVID-19 related misinformation? Journal of Computational Social Science. 2020;3(2):319–342. doi: 10.1007/s42001-020-00089-2. [DOI] [PMC free article] [PubMed] [Google Scholar]
- 21.Hinton, G. E., Srivastava, N., Krizhevsky, A., Sutskever, I., & Salakhutdinov, R. R. (2012). Improving neural networks by preventing co-adaptation of feature detectors. arXiv preprint arXiv:1207.0580.
- 22.Hochreiter S, Schmidhuber J. Long short-term memory. Neural Computation. 1997;9(8):1735–1780. doi: 10.1162/neco.1997.9.8.1735. [DOI] [PubMed] [Google Scholar]
- 23.Hussain A, Tahir A, Hussain Z, Sheikh Z, Gogate M, Dashtipour K, Ali A, Sheikh A. Artificial intelligence–enabled analysis of public attitudes on facebook and twitter toward COVID-19 vaccines in the united kingdom and the united states: observational study. Journal of medical Internet research. 2021;23(4):e26627. doi: 10.2196/26627. [DOI] [PMC free article] [PubMed] [Google Scholar]
- 24.Hutto, C. J., & Gilbert, E. (2015). Vader: A parsimonious rule-based model for sentiment analysis of social media text. In Proceedings of the Eighth International AAAI Conference on Weblogs and Social Media.
- 25.Jackson, J. K. (2021). Global economic effects of COVID-19. Technical report, Congressional Research Service.
- 26.Joulin, A., Grave, E., Bojanowski, P., & Mikolov, T. (2016). Bag of tricks for efficient text classification. arXiv preprint arXiv:1607.01759.
- 27.Junwei K, Yang H, Junjiang L, Zhijun Y. Dynamic prediction of cardiovascular disease using improved LSTM. International Journal of Crowd Science. 2019;3(1):14–25. doi: 10.1108/IJCS-01-2019-0002. [DOI] [Google Scholar]
- 28.Kaur H, Ahsaan SU, Alankar B, Chang V. A proposed sentiment analysis deep learning algorithm for analyzing COVID-19 tweets. Information Systems Frontiers. 2021;23(6):1417–1429. doi: 10.1007/s10796-021-10135-7. [DOI] [PMC free article] [PubMed] [Google Scholar]
- 29.Kingma, D. P., & Ba, J. (2014). Adam: A method for stochastic optimization. arXiv preprint arXiv:1412.6980.
- 30.Kruskal WH, Wallis WA. Use of ranks in one-criterion variance analysis. Journal of the American statistical Association. 1952;47(260):583–621. doi: 10.1080/01621459.1952.10483441. [DOI] [Google Scholar]
- 31.Li S, Wang Y, Xue J, Zhao N, Zhu T. The impact of COVID-19 epidemic declaration on psychological consequences: a study on active Weibo users. International journal of environmental research and public health. 2020;17(6):2032. doi: 10.3390/ijerph17062032. [DOI] [PMC free article] [PubMed] [Google Scholar]
- 32.Liu S, Liu J. Public attitudes toward COVID-19 vaccines on English-language twitter: a sentiment analysis. Vaccine. 2021;39(39):5499–5505. doi: 10.1016/j.vaccine.2021.08.058. [DOI] [PMC free article] [PubMed] [Google Scholar]
- 33.Luo M, Guo L, Mingzhou Yu, Jiang W, Wang H. The psychological and mental impact of coronavirus disease 2019 (COVID-19) on medical staff and general public—a systematic review and meta-analysis. Psychiatry research. 2020;291:113190. doi: 10.1016/j.psychres.2020.113190. [DOI] [PMC free article] [PubMed] [Google Scholar]
- 34.Malik A, Javeri YT, Shah M, Mangrulkar R. Cyber-physical systems. Netherlands: Elsevier; 2022. Impact analysis of COVID-19 news headlines on global economy; pp. 189–206. [Google Scholar]
- 35.Martinez M, Stiefelhagen R. German conference on pattern recognition. NY: Springer; 2018. Taming the cross entropy loss; pp. 628–637. [Google Scholar]
- 36.Melton CA, Olusanya OA, Ammar N, Shaban-Nejad A. Public sentiment analysis and topic modeling regarding COVID-19 vaccines on the Reddit social media platform: a call to action for strengthening vaccine confidence. Journal of Infection and Public Health. 2021;14(10):1505–1512. doi: 10.1016/j.jiph.2021.08.010. [DOI] [PMC free article] [PubMed] [Google Scholar]
- 37.Mikolov, T., Sutskever, I., Chen, K., Corrado, G., & Dean, J. (2013). Distributed representations of words and phrases and their compositionality. arXiv preprint arXiv:1310.4546.
- 38.Miller GA. Wordnet: a lexical database for English. Communications of the ACM. 1995;38(11):39–41. doi: 10.1145/219717.219748. [DOI] [Google Scholar]
- 39.Naseem U, Razzak I, Khushi M, Eklund PW, Kim J. Covidsenti: a large-scale benchmark twitter data set for COVID-19 sentiment analysis. IEEE Transactions on Computational Social Systems. 2021;8(4):1003–1015. doi: 10.1109/TCSS.2021.3051189. [DOI] [PMC free article] [PubMed] [Google Scholar]
- 40.Nielsen, F. Å. (2011). A new anew: evaluation of a word list for sentiment analysis in microblogs. arXiv preprint arXiv:1103.2903.
- 41.Ntompras C, Drosatos G, Kaldoudi E. A high-resolution temporal and geospatial content analysis of twitter posts related to the COVID-19 pandemic. Journal of Computational Social Science. 2021;5(1):687–729. doi: 10.1007/s42001-021-00150-8. [DOI] [PMC free article] [PubMed] [Google Scholar]
- 42.Pennington, J., Socher, R., & Manning, C. D. (2014). Glove: Global vectors for word representation. In Proceedings of the 2014 conference on empirical methods in natural language processing (EMNLP) (pp. 1532–1543).
- 43.Rahm E, Do HH. Data cleaning: problems and current approaches. IEEE Data Eng. Bull. 2000;23(4):3–13. [Google Scholar]
- 44.Rahman M, Islam MN, et al. Sentimental analysis and deep learning. Singapore: Springer; 2022. Exploring the performance of ensemble machine learning classifiers for sentiment analysis of COVID-19 tweets; pp. 383–396. [Google Scholar]
- 45.Rahman MM, Md Nawaz Ali GG, Li XJ, Samuel J, Paul KC, Chong PHJ, Yakubov M. Socioeconomic factors analysis for COVID-19 us reopening sentiment with twitter and census data. Heliyon. 2021;7(2):e06200. doi: 10.1016/j.heliyon.2021.e06200. [DOI] [PMC free article] [PubMed] [Google Scholar]
- 46.Ruelens A. Analyzing user-generated content using natural language processing: a case study of public satisfaction with healthcare systems. Journal of Computational Social Science. 2021;5(1):731–749. doi: 10.1007/s42001-021-00148-2. [DOI] [PMC free article] [PubMed] [Google Scholar]
- 47.Jim Samuel M, Mokhlesur Rahman GG, Ali MN, Samuel Y, Pelaez A, Chong PHJ, Yakubov M. Feeling positive about reopening? New normal scenarios from COVID-19 us reopen sentiment analytics. IEEE Access. 2020;8:142173–142190. doi: 10.1109/ACCESS.2020.3013933. [DOI] [PMC free article] [PubMed] [Google Scholar]
- 48.Sander D, Grandjean D, Scherer KR. A systems approach to appraisal mechanisms in emotion. Neural Networks. 2005;18(4):317–352. doi: 10.1016/j.neunet.2005.03.001. [DOI] [PubMed] [Google Scholar]
- 49.Scherer KR. The dynamic architecture of emotion: evidence for the component process model. Cognition and Emotion. 2009;23(7):1307–1351. doi: 10.1080/02699930902928969. [DOI] [Google Scholar]
- 50.Schuster M, Paliwal KK. Bidirectional recurrent neural networks. IEEE transactions on Signal Processing. 1997;45(11):2673–2681. doi: 10.1109/78.650093. [DOI] [Google Scholar]
- 51.Sidana S, Amer-Yahia S, Clausel M, Rebai M, Mai ST, Amini M-R. Health monitoring on social media over time. IEEE transactions on Knowledge and Data Engineering. 2018;30(8):1467–1480. doi: 10.1109/TKDE.2018.2795606. [DOI] [Google Scholar]
- 52.Singh M, Jakhar AK, Pandey S. Sentiment analysis on the impact of coronavirus in social life using the Bert model. Social Network Analysis and Mining. 2021;11(1):1–11. doi: 10.1007/s13278-021-00737-z. [DOI] [PMC free article] [PubMed] [Google Scholar]
- 53.Stainback K, Hearne BN, Trieu MM. Covid-19 and the 24/7 news cycle: Does COVID-19 news exposure affect mental health? Socius. 2020;6:2378023120969339. doi: 10.1177/2378023120969339. [DOI] [Google Scholar]
- 54.Stang, M., Meier, C., Rau, V., & Sax, E. (2019). An evolutionary approach to hyperparameter optimization of neural networks. In International Conference on Human Interaction and Emerging Technologies, (pp. 713–718). Springer.
- 55.Troisi O, Fenza G, Grimaldi M, Loia F. Covid-19 sentiments in smart cities: the role of technology anxiety before and during the pandemic. Computers in Human Behavior. 2022;126:106986. doi: 10.1016/j.chb.2021.106986. [DOI] [PMC free article] [PubMed] [Google Scholar]
- 56.Tsao S-F, Chen H, Tisseverasinghe T, Yang Y, Li L, Butt ZA. What social media told us in the time of COVID-19: a scoping review. The Lancet Digital Health. 2021;3(3):e175–e194. doi: 10.1016/S2589-7500(20)30315-0. [DOI] [PMC free article] [PubMed] [Google Scholar]
- 57.Vatsa, D., & Yadav, A. (2022). An analytical insight of discussions and sentiments of Indians on omicron-driven third wave of COVID-19 using twitter data.
- 58.Wang, C., & Wang, B. (2020). Encoding sentences with a syntax-aware self-attention neural network for emotion distribution prediction. In CCF International Conference on Natural Language Processing and Chinese Computing (pp. 256–266). Springer.
- 59.Wang S, Zhou W, Jiang C. A survey of word embeddings based on deep learning. Computing. 2020;102(3):717–740. doi: 10.1007/s00607-019-00768-7. [DOI] [Google Scholar]
- 60.Wawrzuta D, Jaworski M, Gotlib J, Panczyk M. What arguments against COVID-19 vaccines run on Facebook in Poland: content analysis of comments. Vaccines. 2021;9(5):481. doi: 10.3390/vaccines9050481. [DOI] [PMC free article] [PubMed] [Google Scholar]
- 61.Wilcoxon F. Breakthroughs in statistics. NY: Springer; 1992. Individual comparisons by ranking methods; pp. 196–202. [Google Scholar]
- 62.Yadav A, Vishwakarma DK. Sentiment analysis using deep learning architectures: a review. Artificial Intelligence Review. 2020;53(6):4335–4385. doi: 10.1007/s10462-019-09794-5. [DOI] [Google Scholar]
- 63.Yadav A, Vishwakarma DK. A language-independent network to analyze the impact of COVID-19 on the world via sentiment analysis. ACM Transactions on Internet Technology (TOIT) 2021;22(1):1–30. doi: 10.1145/3475867. [DOI] [Google Scholar]
- 64.Yousefinaghani S, Dara R, Mubareka S, Papadopoulos A, Sharif S. An analysis of COVID-19 vaccine sentiments and opinions on twitter. International Journal of Infectious Diseases. 2021;108:256–262. doi: 10.1016/j.ijid.2021.05.059. [DOI] [PMC free article] [PubMed] [Google Scholar]
- 65.Yu, T., & Zhu, H. (2020). Hyper-parameter optimization: a review of algorithms and applications. arXiv preprint arXiv:2003.05689.
- 66.Zhang S-N, Li Y-Q, Ruan W-Q, Liu C-H. Would you enjoy virtual travel? The characteristics and causes of virtual tourists sentiment under the influence of the COVID-19 pandemic. Tourism Management. 2022;88:104429. doi: 10.1016/j.tourman.2021.104429. [DOI] [Google Scholar]
- 67.Zheng Z, Huang S, Weng R, Dai X-Y, Chen J. Improving self-attention networks with sequential relations. IEEE/ACM Transactions on Audio, Speech, and Language Processing. 2020;28:1707–1716. doi: 10.1109/TASLP.2020.2996807. [DOI] [Google Scholar]
- 68.Zhou J, Yang S, Xiao C, Chen F. Examination of community sentiment dynamics due to COVID-19 pandemic: a case study from a state in Australia. SN Computer Science. 2021;2(3):1–11. doi: 10.1007/s42979-021-00596-7. [DOI] [PMC free article] [PubMed] [Google Scholar]
- 69.Zhou, P., Shi, W., Tian, J., Qi, Z., Li, B., Hao, H., & Xu, B. (2016). Attention-based bidirectional long short-term memory networks for relation classification. In Proceedings of the 54th annual meeting of the association for computational linguistics (volume 2: Short papers) (pp. 207–212).
- 70.Zulqarnain, M., Ghazali, R., Aamir, M., & Hassim, Y. M. M. (2022). An efficient two-state gru based on feature attention mechanism for sentiment analysis. Multimedia Tools and Applications (pp. 1–26).
Associated Data
This section collects any data citations, data availability statements, or supplementary materials included in this article.
Data Availability Statement
The data that support the findings of this study are available from the corresponding author, Han Xu, upon reasonable request.