

Abstract
Mycolactone is a cytotoxic and immunosuppressive macrolide produced by Mycobacterium ulcerans and the sole causative agent of the neglected tropical skin disease Buruli ulcer. The toxin acts by invading host cells and interacting with intracellular targets to disrupt multiple fundamental cellular processes. Mycolactone’s amphiphilic nature enables strong interactions with lipophilic environments, including cellular membranes; however, the specificity of these interactions and the role of membranes in the toxin’s pathogenicity remain unknown. It is likely that preferential interactions with lipophilic carriers play a key role in the toxin’s distribution in the host, which, if understood, could provide insights to aid in the development of needed diagnostics for Buruli ulcer disease. In this work, molecular dynamics simulations were combined with enhanced free-energy sampling to characterize mycolactone’s association with and permeation through models of the mammalian endoplasmic reticulum (ER) and plasma membranes (PMs). We find that increased order in the PMs not only leads to a different permeation mechanism compared with that in the ER membrane but also an energetic driving force for ER localization. Increased hydration, membrane deformation, and preferential interactions with unsaturated lipid tails stabilize the toxin in the ER membrane, while disruption of lipid packing is a destabilizing force in the PMs.
Significance
Mycolactone is the sole causative agent of Buruli ulcer, a neglected tropical disease involving large necrotic lesions that can cause permanent disfigurement if left untreated. Due to its amphiphilic nature, the toxin hides from traditional diagnostic detection and the host immune system by associating with lipophilic carriers, including cellular membranes. Our work uses extensive all-atom simulations to query if the toxin has preferential interactions with different types of membranes. We find a clear preference for more disordered membranes, like the endoplasmic reticulum’s, via interactions with unsaturated lipid tails and membrane deformation. The revealed insights can be used to predict host cell distribution between different types of lipophilic carriers and to aid in the design of Buruli ulcer diagnostics.
Introduction
Buruli ulcer (BU) disease is a debilitating skin disease caused by the bacteria Mycobacterium ulcerans. The disease is characterized by large necrotic lesions that surprisingly lack pain and wound healing and can lead to permanent disfigurement and disability if left untreated (1,2,3). While treatments for BU disease exist and antibiotic treatment regimens have seen striking improvements in the last few years (4,5), early detection remains a significant challenge. This is partially because BU manifests in similar ways as other skin neglected tropical skin diseases (e.g., leprosy, leishmaniasis, and yaws) (6,7). Another challenge is the development of potential treatments for immunosuppressed individuals, such as patients with advanced HIV coinfection or who are undergoing immunosuppression treatments (5). Unlike other skin neglected tropical diseases, BU is caused by a single causative agent, an exotoxin produced by the bacteria called mycolactone. This cytotoxin is secreted by the bacteria and invades host cells, where it disrupts multiple cellular processes. Its effects include impaired immune response, cell adhesion, and pain perception, as well as cell death (8). Additionally, it evades the host immune system and is difficult to detect with antibodies—making the development of diagnostics challenging (9).
Although mycolactone was initially believed to passively permeate through membranes into host cytosol (10), simulations first predicted (11) and experiments shortly thereafter demonstrated (12,13) that it actually associates strongly with lipophilic structures such as cellular membranes, albumin, and lipoproteins. This is sensible given the toxin’s amphiphilic nature (Fig. S1) and potentially explains how being consistently carried in and transferred between lipophilic structures would effectively hide mycolactone from both innate immune processes and traditional antibody development (14). It would also explain why developed monoclonal antibodies are only effective when mixed with the toxin prior to cell exposure (14). Thus, understanding how mycolactone is distributed in and navigates the host system via lipophilic carriers would benefit the development of effective diagnostic assays, which is a noted priority of the World Health Organization (9). It would also provide fundamental insight into how bacterial amphiphiles, in general, interact with lipophilic carriers to evade the host immune system, localize, and cause disease.
Mycolactone’s effects have been shown to be mediated by its interactions with multiple cellular targets. The toxin is thought to cause analgesia through its interaction with the angiotensin II receptor, which is responsible for signal transduction in neurons involved in the perception of pain. The toxin binds to the angiotensin II receptor, triggering a signaling cascade that causes hyperpolarization of neurons, which inhibits their ability to send information, thus impairing the ability to feel pain (15,16). Skin ulceration observed in BU disease can be partially attributed to the toxin’s interaction with the Wiskott-Aldrich syndrome protein (WASP), a regulatory protein involved in the polymerization of actin filaments in the cytoskeleton, which enables cell adhesion to form cell tissue. The toxin binds to WASP with a high binding affinity and constitutively activates it, causing uncontrolled branching of actin filaments, defective cell adhesion, and skin ulceration (17,18). However, most of mycolactone’s cellular effects result from targeting the Sec61 translocon (19,20,21), a membrane-embedded protein complex that translocates newly synthesized polypeptides into the endoplasmic reticulum (ER) for processing. The toxin binds to the protein and inhibits its translocation mechanism, reducing the cell’s ability to produce many secreted and transmembrane proteins and leading to immunomodulation and cytotoxic effects (8). Single amino acid mutations in Sec61 have been identified that confer human cells broad resistance to mycolactone’s cytotoxic and immunomodulatory effects while not affecting the protein’s functionality (19).
An interesting possible contributing factor to mycolactone’s impact on so many cellular processes is its strong interaction with membranes. Studies using fluorescent derivatives of mycolactone reported its passive diffusion across membranes and uptake into the cytoplasm (10). However, our previous work quantified a strong free energy of association between the toxin and model phospholipid membranes, suggesting that what was previously thought of as cytosolic localization was more likely an association with the ER membrane and Sec61 translocon (11,22). This work further demonstrated that the toxin has a strong preference for the interfacial region below the lipid headgroups and that water molecules play a crucial role in stabilizing the polar groups of mycolactone during membrane association and permeation (22). While interacting with the membrane, mycolactone may also alter membrane properties. The toxin has been shown to perturb lipid organization in coarse-grained model membranes, suggesting it could change the formation of ordered domains (11). Experimental work using Langmuir monolayers to model the plasma membrane (PM) supports these computational predictions by demonstrating mycolactone’s interaction with the membrane at very low concentrations and the toxin’s effect on the formation of ordered microdomains (12). Collectively, these findings point to a nuanced role of membrane interactions that could be highly relevant to mycolactone’s localization and pathogenicity.
The complexity of small molecule-membrane interactions is partially due to the diversity of cellular membranes. The lipid composition of biological membranes varies at the organism, cell type, organelle, and bilayer-leaflet levels. Sphingolipids and sterols are considered eukaryotic lipids and differ in structure in vertebrates, plants, and fungi (23). The major phospholipid in cellular membranes, phosphatidylcholine, has distinct compositions in different tissues and cell types within an organism (24). Organelles within a cell vary significantly in lipid composition, and some are additionally asymmetric, with different lipid composition in each leaflet. The ER membrane lacks cholesterol, has more unsaturated phospholipids, and is relatively symmetrical (25). In contrast, the PM is richer in cholesterol and sphingolipids and is asymmetric with negatively charged phosphatidylserine lipids in the cytoplasmic leaflet (25,26). Accompanying the variations in lipid composition are different physical properties such as bilayer packing, thickness, and fluidity, which influence interactions with proteins and small molecules. Given this, it is likely that mycolactone has different interactions with different types of membranes that influence its host distribution and mechanism of pathogenicity.
This work aims to characterize the interaction of mycolactone B—the cytotoxic isoform of the toxin (27)—with different model membranes to better understand membrane-specific interactions and host cell distribution. We build upon previous work, where we characterized the association of the toxin with a pure 1,2-dipalmitoyl-sn-glycero-3-phosphocholine (DPPC) membrane (22), to focus on more realistic heterogeneous model membranes representative of the PM and ER membrane. We open by describing how we use all-atom molecular dynamics (MD) to simulate the membranes to identify the existence of, and cause behind, preferential membrane association. We employed transition-tempered metadynamics (TTMetaD) enhanced free-energy sampling in order to calculate the permeation free-energy profiles and characterize the association of the toxin with our model membranes. We then present the obtained free-energy surfaces, which show significantly different permeation mechanisms in the two membranes and an association preference for the ER membrane. The PM is shown to have more ordered lipids during toxin association, which limits stabilizing polar interactions with water molecules and lipid headgroups. In contrast, more flexible lipids in the ER membrane facilitate increased hydration and membrane reorganization during toxin association and permeation, contributing to the toxin’s preferential association. Our simulations reveal how mycolactone additionally increases the disorder in saturated lipid tails, disrupting lipid packing and decreasing stabilization in the PM relative to ER membrane. We close by discussing how these trends extend past the model membranes studied herein to suggest a framework for predicting the preferential association and localization of the toxin in the complex milieu of lipophilic carries in the host environment.
Materials and methods
TTMetaD
A substantial challenge for computational studies of biological processes is that most are too slow to be ergodically sampled in available MD simulation timescales. In most systems, relevant configurations are separated by free-energy barriers that are unlikely to be crossed without the aid of adaptive or enhanced sampling techniques, such as MetaD (28,29). In nontempered MetaD, Gaussian bias potentials are gradually added to the Hamiltonian system to nudge the system to new regions of phase space. These biases are usually applied to a combination of simple variables called collective variables (CVs). In principle, this bias accumulates as a summation of Gaussian functions deposited along the trajectory until all regions are equally sampled (i.e., diffusive motion along the CV has been obtained). However, the combined bias will oscillate around the desired free-energy profile (potential of the mean force [PMF]) instead of converging to it asymptotically. The addition of untempered Gaussian functions can also destabilize the system when too much energy is added. Well-tempered MetaD (WTMetaD) (30) was developed to address this issue and converge to the real free-energy surface. The bias added in WTMetaD is smoothly tapered to zero with a time-dependent quantity such that the bias height decreases exponentially with respect to the local bias energy. Dama et al. (31) demonstrated that WTMetaD indeed converges the bias potential asymptotically to a linearly scaled inverse of the underlying free energy.
Nevertheless, it can be challenging to determine the optimal rate of reducing the height of the bias before the simulation. Ideally, this rate should be proportional to the free-energy barrier to be crossed. This information is generally not known ahead of time. If one chooses a too rapid of a rate, the system may be trapped in local minima. Alternatively, selecting too slow of a rate can destabilize the system, as large biases shift sampling to high-energy irrelevant regions of phase space and cause errors in the resulting free-energy profile. TTMetaD (32) was developed to avoid these regimes. It is also smoothly convergent, like WTMetaD, but does not require previous knowledge of the barrier height (32). It only requires approximate locations of the minima on either side of the barrier. The local bias energy is replaced by a global property, , which is the minimal bias on the maximally biased path among all the continuous paths connecting the preselected basins in the CV space, according to
| (1) |
In Eq. 1, is the height of the Gaussian () divided by its deposition stride at time . The rate of reducing the height of the Gaussian bias is controlled by the parameter (tempering). is effectively the amount of the bias energy necessary to sample the transition state (TS) region. Before the basins are connected through the TS, remains at zero, and the Gaussian height is not tempered. Once the basins are connected, the TS region has been traversed, and the bias is aggressively tempered. Therefore, a simulation using TTMetaD efficiently fills the minima in the first step and then quickly tempers the bias to converge the free-energy surface.
In our study, two-dimensional (2D) PMFs were calculated because they were more efficient in converging the desired free-energy profiles and because of the increased fidelity in capturing important angular degrees of freedom previously demonstrated in membrane permeation simulations (22,33,34). The 2D PMF is calculated from the reverse of the average bias energy from the independent replicas and then (diagonally) symmetrized with respect to the center of the membrane and toxin orientation (the CVs). The minimum free-energy path represents the most probable pathway in the large ensemble of permeation processes, and it was calculated with the zero-temperature string method (35). Starting from ZCOM = −5.2 nm, θ = 1.5 radians and ending at ZCOM = 5.2 nm, θ = 1.5 radians, the initial path through the 2D landscape was spliced into 400 equidistant points. For the PM, additional end and start points were set for ZCOM = 0 nm, θ = 0 radians and ZCOM = 0 nm, θ = 3.14 radians since the string method cannot track the symmetry across theta. Each point was then evolved in up to 10,000 steps to a lower free energy using 1 fs timesteps until convergence was reached with a tolerance of 0.01 kJ. Note that with evolution the end points will also move to the nearest minimum free-energy well. Finally, the 1D PMFs were obtained from the free energy along each minimum free-energy path.
CVs
Identifying a set of CVs that appropriately identify the critical slow degrees of freedom that describe the motion of complex biological processes, such as membrane permeation, can be a significant challenge. In principle, the bias energy is deposited along the CV space to increase the speed of exploration of the free-energy surface. However, a poor choice of CVs can lead to slower convergence or even a complete divergence from the relevant regions of phase space. For simulations of permeation of small organic molecules through lipid membranes using TTMetaD, Sun et al. (34) showed that 2 CVs are often necessary. The first is typically a z-component distance (z, CV1) that describes the translation through the membrane, and the second describes the molecular orientation (θ, CV2). In our previous work on mycolactone (22), we tested the distance between the center of mass (COM) of the membrane to the COM whole molecule versus the COM of the lactone ring as possible CV1 values. The latter was used herein because it better delineated between configurations and demonstrated faster convergence. The orientational CV2 is herein defined as the angle between the vector connecting the hydroxyl groups of the Southern and Northern tails and the vector normal to the bilayer leaflet containing the lactone ring COM. Thus, the resulting free-energy surfaces are symmetric from negative to positive z and from 0 to pi. The two CVs are represented in Fig. 1.
Figure 1.
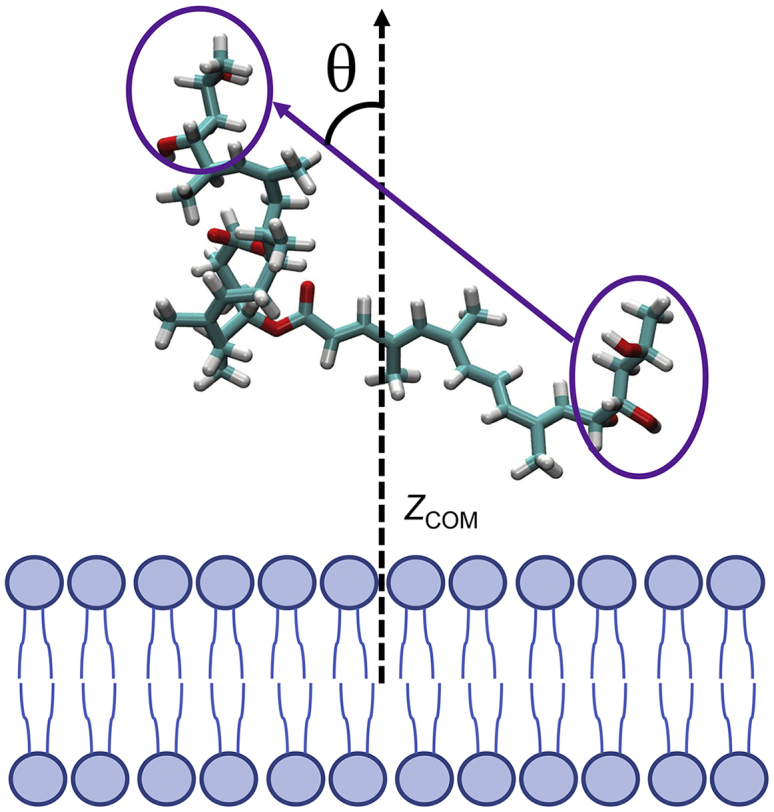
Collective variables used to define permeation where CV1 is the z-component of the distance between the COM of the membrane and that of the lactone ring (ZCOM), and CV2 is the angle θ between membrane normal and the vector connecting the hydroxyl groups of the Northern (left circle) and Southern chains (right circle). To see this figure in color, go online.
Computational protocol
The all-atom membrane systems were built using the CHARMM-GUI Membrane Builder for Mixed Bilayers (36), with a hydration ratio of 60 for each lipid. The ER bilayer consisted of 198 units of 1-palmitoyl-2-oleoyl-sn-glycero-3-phosphocholine (POPC) and 102 units of 1-palmitoyl-2-oleoyl-sn-glycero-3-phosphoethanolamine (POPE). In addition to 80 units of POPC and 64 POPE components, the PM also had 80 units of DPPC and 96 cholesterol molecules. These numbers were chosen to represent the phospholipid compositions of the PM and ER membrane in mammals (37) approximately. Although mammalian PMs are asymmetric bilayers, our model PM is symmetric due to the challenge of preparing stable, asymmetric model membranes suitable for biophysical studies (37,38). Likewise, existing force fields have been parametrized based on data from symmetric bilayers, thus adding a possibility of creating artifacts or significant differences in physical properties, like leaflet tension (39,40,41,42). Our PM lipid composition represents the outer cytoplasmic leaflet of mammalian PMs, which is approximately twofold more unsaturated than the inner leaflet (43). The dimensions of the simulation boxes were ∼9.6 × 9.6 × 9.3 and 8.4 × 8.4 × 10.4 nm for the ER and PM, respectively. For a comparison with previous work (11,22), an Amber-based force field (44) was used to describe each lipid for both bilayers with corrections to balance the hydrophobic and hydrophilic forces (45). The systems were then solvated using the TIP3P water model force field (46), heated to 310 K, and equilibrated for 250 ns until convergence was observed through property analysis (see Fig. S3). Subsequently, one mycolactone molecule was randomly inserted into the water. For each membrane system, four replicas of mycolactone were simulated. The toxin parameters were previously developed by Aydin et al. (22) and compared with the published results of López et al. (11). The time step to integrate the Newtonian equations of motion was 2 fs. The temperature was controlled by the canonical velocity-rescaling thermostat (47) at 310 K with a separate coupling time of 1 ps for each component (membrane – toxin and water). This temperature was chosen to mimic the human body temperature. The Berendsen barostat (48) was employed in a semiisotropic manner (xy directions coupled together while z direction was independent) to maintain the pressure at 1 bar with a coupling time every 5 ps. Under periodic boundary conditions, the long-range electrostatic interactions were calculated using the smooth particle mesh Ewald method (49) with a cutoff of 1.0 nm. The short-range interaction list was updated every 10 steps with a cutoff distance of 1.0 nm. A linear constraint solver—LINCS (50)—was also applied to all hydrogen bonds. In addition to the simulated systems with an enhanced sampling technique, all-atom MD simulations for both membranes systems were carried out in the absence of any biasing force to serve as a control and verify possible changes in the membrane properties.
All biased replicas were simulated for 5 μs using the GROMACS 2019.4 (51) patched with PLUMED 2.5.3 (52) to perform the enhanced method TTMetaD. Standard error bars were calculated along the average minimum free-energy path with replica/block averaging by taking the standard deviation between the four replicas divided by √N, where N is the number of replicas (53). Since the replicas are not symmetric with respect to the average minimum free-energy path, the error bars are also not symmetric. The same GROMACS version was used to perform the unbiased simulations for 1 μs and some of the analyses (area per lipid headgroup, membrane thickness, tail order parameter, COM distances). In order to investigate possible finite-size effects, we also performed unbiased simulations with larger membranes, doubling the number of lipids for each membrane. Python and Tcl in-house-developed scripts were used to do the 2D and 1D PMFs and hydration analysis. MDAnalysis (54,55) was used to read the trajectories and conduct contact analysis. Visualization of the simulation boxes and trajectories and generation of the figures were done with VMD (56).
Results and discussion
Toxin permeation
2D PMFs of the permeation process with each membrane obtained from TTMetaD simulations are shown in Fig. 2. The minimum free-energy path, traced by a black line, shows the most probable permeation pathway, while inserted snapshots show dominant configurations in a few key locations. Energy minima in the PMFs correspond to configurations where the polar hydroxyl groups at the ends of the mycolactone tails are hydrogen bonding with oxygen atoms in the lipid headgroups or glycerol. At the same time, the macrolide ring is buried in the hydrophobic region, interacting with lipid tails and cholesterol molecules. These observations are consistent with our previous computational work (22), where we characterized the interaction of mycolactone with a pure DPPC model membrane.
Figure 2.

2D permeation free-energy profiles through ER and PM. The minimum free-energy paths (black lines) track the most common permeation pathways. Bottom figures show representative configurations in the most stable regions. The toxin is colored by atom type, while lipid headgroups, tails, and cholesterol are colored green, gray, and purple, respectively. The membranes approximately span −2.0 < ZCOM < 2.0 nm. The free energy is shown in kilocalories per mole. To see this figure in color, go online.
However, the minimum free-energy paths also show a difference in the dominant permeation mechanism of the toxin through the two membranes. In the ER membrane, the toxin adopts a curved conformation (i.e., with both tails in the same region of z and θ ≃ 1.5 radians) at the interface below the lipid headgroups and permeates from one leaflet to the other by swapping the polar interactions of both of its hydrophilic tails from the lipid headgroups of one leaflet over to the opposite leaflet. This permeation pathway is facilitated by the deformation of the bilayer due to strong polar interactions between the toxin and lipid headgroups or water molecules (the role of hydration is further discussed below). Fig. 3 depicts the inward bend of the ER membrane that allows the toxin to continue its interactions with lipid headgroups and water molecules even at the center of the membrane. This magnitude of deformation and hydration is present in ∼30% of the conformations in this region; others have similar, but fewer, deep interactions with headgroups and/or water. In contrast, the permeation pathway observed in the PM has a higher and wider energy barrier in the center of the bilayer for curved conformations (0 nm, ∼1.5 radians in Fig. 2). Thus, the toxin more frequently takes a different path as it permeates, swapping the interaction of its tails with the lipid headgroups one at a time and adopting an extended configuration in the middle, where each tail interacts with opposite leaflet headgroups (with a CV2 angle of ∼0 or pi) before fully migrating to the opposite leaflet. To validate the free-energy landscapes of the 2D PMFs, the distributions of the CVs were analyzed in unbiased simulations of each membrane system. They were found to be consistent with the energy minima of the PMF of both systems (Fig. S2). Even in unbiased simulations of the PM, the toxin transitions between the curved and extended conformations, whereas, in the ER membrane, it remains in a curved conformation—consistent with the 2D PMFs.
Figure 3.

Representative configurations at ZCOM = 0 nm and angle = 1.5 radians (Fig. 2) showing how mycolactone causes more membrane curvature and hydration defects in the ER membrane (A) compared with the PM (B). Representations include toxin (atom type), water (blue), lipid headgroup phosphorus (red), lipid headgroup nitrogen (green), and cholesterol oxygen (yellow). Lipid tails are omitted for clarity. To see this figure in color, go online.
The difference in permeation mechanisms is likely due to the presence of cholesterol in the PM, which increases bilayer thickness and degree of order in the lipid tail region. Increased order in the PM limits the membrane deformation that stabilizes polar interactions in the pathway observed in the ER membrane (Fig. 2). An increased bilayer thickness would additionally demand a larger degree of deformation for the toxin to retain polar interactions through the membrane center. Lipid tail order parameters and bilayer thickness of the model membranes were analyzed to verify the effect of cholesterol on membrane properties. The tail order parameter () of each phospholipid is a measure of the ordering and orientation of the phospholipid tail with respect to the bilayer normal and was calculated using
| (2) |
where the is the angle between the vector of the bilayer normal and the C–H bond in the lipid. The membrane thickness was calculated as the average distance between the COM of the phosphates of the lipid headgroups of each leaflet. The results indicate that the PM is indeed thicker than the ER membrane (46.1 ± 1.3 vs. 39.2 ± 1.3 Å, respectively, where the ± indicates standard deviation) and more ordered (Figs. S3 and S4). The influence of cholesterol on membrane order and thickness, as well as an increased height and width of a permeation free-energy barrier, are consistent with previous membrane permeation studies (57,58,59).
Toxin-membrane association and hydration
In addition to a difference in the permeation mechanisms, the binding affinity of the toxin for the ER membrane is more favorable than it is for the PM. This is more obvious in the 1D PMFs shown in Fig. 4. While it is helpful to quantify this difference, a more relevant question is why—why is the toxin more stable in the ER membrane? The preference seems to be partially due to increased interactions with water in the ER membrane relative to the PM, minimizing unfavorable interactions between the hydrophobic lipid tails and polar moieties of the toxin. Water coordination was shown in our previous work (22) to play an important role in the association of mycolactone with lipid bilayers, satisfying polar interactions as the toxin migrates into hydrophobic tail regions. Thus, water coordination was analyzed by calculating the coordination number as a function of |ZCOM| (Fig. 5). The probability distribution was calculated by counting the number of water molecules in contact with the toxin and averaging over the upper and lower leaflets. This captures the relative hydration from when the toxin is in bulk water (−3.5 nm > ZCOM > 3.5 nm) to when the COM of the lactone ring is in the middle of the membrane (ZCOM = 0 nm). A contact is defined as any COM distance between an oxygen atom of water and any oxygen atom of mycolactone less than or equal to 3.04 Å.
Figure 4.

1D free-energy profiles of each system along the minimum free-energy path. The standard errors range from 0.06 to 1.22 kcal mol−1 for ER and 0.02 to 2.18 kcal mol−1 for PM. To see this figure in color, go online.
Figure 5.

Probability distribution of the number of water molecules interacting with mycolactone as a function of the toxin’s distance (along z) from the center of the membrane (|ZCOM|). To see this figure in color, go online.
Similar to results in our previous work (Fig. 7 in (22)), the toxin can interact with water molecules throughout permeation, even when the toxin is near the center of both membranes. Although the water molecules can also permeate to the center of the membrane (Fig. 8 in (22)), they are typically localized on one side of the membrane or the other, hydrogen bonding to the toxin’s hydroxyl and oxygen atoms. Never was a continuous water chain across the membrane observed. Notably, mycolactone shows a higher probability of coordinating with more water molecules in the ER membrane than in the PM. This is further supported by a stronger average interaction energy between the toxin and water molecules in the ER versus PM (−31.46 vs. −20.75 kcal/mol, respectively, as shown in Table 1). gmx energy was used to calculate these from the unbiased simulations using all configurations in the dominant minima in the free-energy landscape (Figs. 2 and S2). Increased hydration of the ER-membrane-associated toxin can also be attributed to the presence of cholesterol and more ordered lipids in the PM, rigidifying the bilayer and condensing the lipid tails and making it more difficult for the toxin to facilitate water penetration into the membrane. Interestingly, the other relevant interaction energies (toxin-toxin intramolecular interactions and toxin-lipid interactions) are more similar in the PM and ER (Table 1), suggesting that the toxin does not quite compensate for the lost water interactions in the PM. Summing these energies points to a stronger affinity for the ER membrane due to increased interactions with water.
Table 1.
Average interaction potential energy of mycolactone with different components of the system.
| Mycolactone interaction energies (kcal mol−1) | ||||
|---|---|---|---|---|
| Lipids | Water | Intramolecular | Total | |
| ER | −103.54 ± 0.37 | −31.46 ± 0.29 | −10.36 ± 0.16 | −145.36 |
| PM | −105.57 ± 0.41 | −20.75 ± 0.39 | −13.58 ± 0.19 | −139.90 |
Another contributing factor to the toxin’s preference for the ER membrane is the entropic cost of restricting the toxin’s conformational freedom in the more rigid PM. The more compact PM expectedly reduces the conformational freedom of the toxin in the bilayer. To estimate this effect, GROMACS tools (gmx covar and gmx anaeig) were used to estimate the configurational entropy of mycolactone based on Schlitter’s formula (60) and reported higher configurational entropy of the toxin in the ER membrane than in the PM (137.07 vs. 134.36 kcal mol−1, respectively, for TS). Although these estimates are approximate (e.g., they do not account for inherent entropic coupling between the toxin and membrane), the relative values suggest the toxin is more conformationally restricted in the PM.
Lipid-lipid interactions
To further investigate mycolactone’s effect on the physical properties of the ER and PM, tail order parameters were calculated for phospholipids near the toxin (within 5 Å) in unbiased simulations and compared with tail order parameters of membrane simulations without mycolactone (Figs. 6 and S5). In both membranes, the toxin disrupts the order of local lipids, but the effect is more significant in the PM. The larger decrease in tail order parameters near mycolactone in the PM suggests the toxin disrupts lipid packing more substantially in this membrane.
Figure 6.

Tail order parameters of POPC in the ER and PM unbiased simulations with and without the toxin. To see this figure in color, go online.
To see if this disruption has an additional ER-favoring enthalpic cost due to lost lipid-lipid interactions, the average enthalpic interaction energies for lipids were computed using gmx energy. Average lipid-lipid interaction energies were calculated from unbiased simulations of the ER and PM both with and without mycolactone, showing a slightly larger per-lipid enthalpic cost in the PM over the ER (0.70 vs. 0.16 kcal/mol) (Table S3). To focus on the local lipid disruption around the toxin, interaction energies were also calculated for lipids near the toxin (any atom within a cutoff of 20 Å) and far from the toxin (all atoms above a cutoff of 40 Å) (Table 2). Close to the toxin, the lipid-lipid interaction energies are substantially reduced, as expected. This disruption is again slightly larger for the PM (Δ(near-without) in Table 2). In addition, the lipid-lipid energies far from the toxin are increased, with a substantially larger disruption for the PM (Δ(near-far) in Table 2). This was at first counterintuitive and encouraged us to dig deeper to understand the origin of the near/far difference.
Table 2.
Average interaction potential energy between lipids of the ER membrane and PM in systems with the toxin and systems without.
| Lipid-lipid interaction energy (kcal mol-1) | |||||
|---|---|---|---|---|---|
| Near the toxina | Far from the toxinb | Δ(near-far) | Membrane without toxin | Δ(near-without) | |
| ER | −144.91 ± 0.69 | −209.16 ± 0.45 | 64.25 | −196.63 ± 0.04 | 51.72 |
| PM | −89.94 ± 0.14 | −169.37 ± 0.24 | 79.43 | −143.08 ± 0.10 | 53.14 |
Number of lipids near the toxin: 54 for ER, 90 for PM.
Number of lipids far from the toxin: 199 for ER, 116 for PM.
We first wanted to verify that these observations were not influenced by the size of our simulations. Thus, larger unbiased simulations were run for both the ER and PM systems. The systems were created by doubling the number of lipids and treated with the same computation protocol (see materials and methods). The analyses (Table S1–S3; Figs. S3 and S7) of these systems are consistent with the results described above and below, suggesting that size artifacts are not significantly altering the reported properties. The larger systems also enabled us to look for convergence to bulk-like properties far from the toxin. Indeed, above 60 and 80 Å, the lipid-lipid interactions energies approach the bulk values from the simulations without the toxin (Table S4).
We next probed whether or not mycolactone has preferential interactions with the specific lipid components making up our model membranes that might change its local environment. The lateral radial distribution function (RDF) of mycolactone was computed with respect to each lipid component in unbiased simulations. The RDFs from the ER membrane (Fig. S6) show a slight increase in the local density of POPC and a decrease in POPE lipids around the toxin. Given that these lipids share the same tails (one saturated and one monounsaturated), POPC is likely locally increased by the cost of packing defects. With the larger choline group, POPC would more effectively minimize the packing defects introduced by the toxin.
Interestingly, the PM RDFs (Figs. S6 and S8) show that the toxin pulls the same lipids (POPC and POPE) into its local interaction zone and pushes the saturated DPPC, as well as cholesterol, out. This effectively creates an ER-like local environment in the PM. Although POPC’s role in decreasing packing defects still contributes to this distribution, the main driving force is likely the toxin’s preference for unsaturated lipids, which is consistent with findings in a previous computational study (11). In that study, coarse-grained MD simulations were used to study the interaction of mycolactone with pure and mixed model membranes. The results suggested that in a membrane consisting of a ternary mixture of saturated lipids, unsaturated lipids and cholesterol, the toxin preferentially interacts with unsaturated lipids in a liquid-disordered domain over saturated lipids and cholesterol in a liquid-ordered domain.
The redistribution of lipids in the PM increases the packing of saturated lipids just outside of the local toxin environment, which explains the larger difference between near and far lipid-lipid interactions (Δ(near-far) in Table 2). In both membranes, there is an enthalpic cost locally and enthalpic gain distally. Cumulatively, however, the enthalpic cost is larger for the PM, with a difference per lipid of 0.69–0.70 kcal/mol for the PM compared with 0.13–0.16 kcal/mol for the ER (Table S3). Additionally, the toxin decreases local lipid order in both the PM and ER (entropically favorable) but increases tail order just outside of the toxin’s local environment in the PM (Fig. S5) (entropically unfavorable).
Collectively, our findings suggest that the energetic driving forces biasing the toxin to associate with ER over the PM are 1) more favorable water-toxin interactions in the ER, 2) increased entropy of the toxin itself in the ER compared with the PM, and 3) more disruption in local lipid packing (enthalpically unfavorable) concurrent with increased ordering of lipids in the region surrounding the toxin in the PM. Additionally, the cost of restructuring the lipid distribution could contribute to the decreased toxin affinity for the PM. Although it is unclear what magnitude each of these terms contributes to the difference in association affinities, the relative values point to the design principles discussed below.
It is important to consider that mycolactone’s preference for the unsaturated lipids of our model PM also suggests that the toxin would readily transition from the outer to the inner leaflet of mammalian PMs, which is less ordered and more unsaturated relative to the outer leaflet (43). A localization to the inner leaflet of the PM might facilitate transitions from the PM to the ER membrane via plasma-ER membrane contact sites (61) or to WASP, which is tethered to the inner leaflet of the PM.
Conclusions
This work focused on mycolactone, an amphiphilic exotoxin that causes the pathogenesis of BU disease by invading host cells and binding to intracellular targets to induce cell death. Our motivation was to better understand the toxin’s localization in the host to aid in the development of effective diagnostics and provide insight into the toxin’s pathogenesis. Previous experimental and computational work has reported a strong association affinity between mycolactone and lipid bilayers (11,12,22). The specificity of this interaction, however, was unclear. In this work, we characterized the interaction of mycolactone with heterogeneous model PM and ER membrane. Given the size of mycolactone and the depth of the association minima, we combined all-atom MD simulations with TTMetaD enhanced free-energy sampling in order to fully converge permeation free-energy profiles. The resulting free-energy profiles capture the anticipated strong association with both membranes, where dominant minima consist of configurations that satisfy polar and nonpolar interactions of the toxin well under the lipid headgroups.
Our simulations demonstrate that lipid composition influences both membrane association and permeation for mycolactone. The dominant permeation pathway observed in the PM involves an extension of the toxin’s two polar tails across the bilayer, while that in the ER membrane retains a curved c-shape conformation. This difference is due to the presence of cholesterol in the PM, which in turn causes increased rigidity and bilayer thickness. Thus, it is more difficult for the toxin to deform the PM and retain polar interactions with lipid headgroups and water molecules during permeation through the membrane mid-plane. The free-energy profiles also indicate a stronger affinity of mycolactone for the ER membrane, which can again be traced to the presence of saturated lipids and cholesterol in the PM. Increased order and lipid packing limit hydration and interactions with polar headgroups. The influence of hydration is significant, leading to an enthalpic bias toward the ER due to favorable toxin-water interactions that are stronger than the toxin-lipid and toxin-toxin intramolecular interaction energies, both of which slightly favor the PM. Additionally, the more rigid PM restricts the toxin’s conformational flexibility—contributing an entropic factor to the toxin’s preference for the ER membrane. Lastly, mycolactone disrupts lipid packing more so in the PM than in the ER, contributing an enthalpic preference for the ER. Perhaps most interesting, the toxin reorganizes the PM by drawing the unsaturated lipid components (POPC and POPE) into its local environment and pushing the saturated lipid (DPPC) and cholesterol out. Thus, diagnostic design principles should target disordered lipophilic carriers with unsaturated lipid components.
The predicted stronger affinity for the ER membrane is consistent with mycolactone’s rapid accumulation in the ER following cellular uptake and its primary targeting of the ER membrane-embedded Sec61 translocon. However, it is unlikely that equilibration alone explains the toxin’s trafficking to the ER membrane. Rather, some form of active uptake mechanism via endocytosis or lipid transfer proteins may also be at play. Moreover, the more considerable disruption of lipid-lipid interactions in the PM combined with the toxin’s preference for unsaturated lipids might suggest that mycolactone has a predilection for the PM inner leaflet and for liquid-disordered regions over liquid-ordered regions of biological membranes that exhibit lateral heterogeneity, which could play a role in the toxin’s trafficking to WASP near regions of actin branching.
Collectively, these findings provide a better understanding of mycolactone’s lipid-specific interactions and localization, which could facilitate the design of ideal lipophilic “sponges” with high toxin affinity as diagnostic or laboratory tools for BU disease. More generally, increasing our understanding of mycolactone may provide clues into how other pathogenic amphiphiles, a class of pathogen-associated molecular patterns that are more difficult to target, navigate host systems via lipophilic carriers. Future work should focus on asymmetric model membranes, how membrane curvature influences association, the interaction of the toxin with other lipophilic carriers such as lipoproteins and albumin, and potential active uptake mechanisms. In addition to theoretical modeling, experimental analyses of the toxin’s interactions with different lipophilic carriers, potentially with techniques using asymmetric giant unilamellar vesicles (62), will be of great value.
Author contributions
J.M.J.S., G.C.A.d.H., and J.D.M.N. designed the research. G.C.A.d.H. and J.D.M.N. performed the simulations and analyses. All authors interpreted the results and wrote the manuscript.
Acknowledgments
The authors thank Professor Rich Pastor and Jeffrey Klauda for helpful discussions. We gratefully acknowledge support from the National Institute of General Medicine of the National Institutes of Health under award number R35GM143117 and computational support from the Extreme Science and Engineering Discovery Environment supported by the National Science Foundation (grant no. ACI-1548562) under allocation MCB200018 as well as the Center for High Performance Computing at the University of Utah.
Declaration of interests
The authors declare no competing interests.
Editor: Siewert Jan Marrink.
Footnotes
Gabriel C.A. da Hora and John D.M. Nguyen contributed equally to this work.
Supporting material can be found online at https://doi.org/10.1016/j.bpj.2022.10.019.
Supporting material
and Tables S1–S4
References
- 1.George K.M., Chatterjee D., et al. Small P.L. Mycolactone: a polyketide toxin from Mycobacterium ulcerans required for virulence. Science. 1999;283:854–857. doi: 10.1126/science.283.5403.854. [DOI] [PubMed] [Google Scholar]
- 2.Walsh D.S., Portaels F., Meyers W.M. Buruli ulcer: advances in understanding Mycobacterium ulcerans infection. Dermatol. Clin. 2011;29:1–8. doi: 10.1016/j.det.2010.09.006. [DOI] [PubMed] [Google Scholar]
- 3.Chany A.C., Tresse C., et al. Blanchard N. History, biology and chemistry of Mycobacterium ulcerans infections (Buruli ulcer disease) Nat. Prod. Rep. 2013;30:1527–1567. doi: 10.1039/c3np70068b. [DOI] [PubMed] [Google Scholar]
- 4.Converse P.J., Almeida D.V., Nuermberger E.L., et al. Shortening buruli ulcer treatment with combination therapy targeting the respiratory chain and exploiting Mycobacterium ulcerans gene decay. Antimicrob. Agents Chemother. 2019;63 doi: 10.1128/AAC.00426-19. [DOI] [PMC free article] [PubMed] [Google Scholar]
- 5.Komm O., Almeida D.V., et al. Nuermberger E.L. Impact of dose, duration, and immune status on efficacy of ultrashort Telacebec regimens in mouse models of buruli ulcer. Antimicrob. Agents Chemother. 2021;65:e0141821. doi: 10.1128/AAC.01418-21. [DOI] [PMC free article] [PubMed] [Google Scholar]
- 6.Hotez P.J., Molyneux D.H., et al. Savioli L. Control of neglected tropical diseases. N. Engl. J. Med. 2007;357:1018–1027. doi: 10.1056/NEJMra064142. [DOI] [PubMed] [Google Scholar]
- 7.Hotez P.J., Kamath A. Neglected tropical diseases in sub-saharan Africa: review of their prevalence, distribution, and disease burden. PLoS Neglected Trop. Dis. 2009;3:e412. doi: 10.1371/journal.pntd.0000412. [DOI] [PMC free article] [PubMed] [Google Scholar]
- 8.Demangel C. Immunity against Mycobacterium ulcerans: the subversive role of mycolactone. Immunol. Rev. 2021;301:209–221. doi: 10.1111/imr.12956. [DOI] [PubMed] [Google Scholar]
- 9.World Health Organization 2017. https://www.who.int/news-room/fact-sheets/detail/buruli-ulcer-(mycobacterium-ulcerans-infection Buruli ulcer (Mycobacterium Ulcerans Infection)
- 10.Snyder D.S., Small P.L.C. Uptake and cellular actions of mycolactone, a virulence determinant for Mycobacterium ulcerans. Microb. Pathog. 2003;34:91–101. doi: 10.1016/s0882-4010(02)00210-3. [DOI] [PubMed] [Google Scholar]
- 11.López C.A., Unkefer C.J., et al. Gnanakaran S. Membrane perturbing properties of toxin mycolactone from Mycobacterium ulcerans. PLoS Comput. Biol. 2018;14:e1005972. doi: 10.1371/journal.pcbi.1005972. [DOI] [PMC free article] [PubMed] [Google Scholar]
- 12.Nitenberg M., Bénarouche A., et al. Girard-Egrot A.P. The potent effect of mycolactone on lipid membranes. PLoS Pathog. 2018;14:e1006814. doi: 10.1371/journal.ppat.1006814. [DOI] [PMC free article] [PubMed] [Google Scholar]
- 13.Tello Rubio B., Bugault F., et al. Guenin-Macé L. Molecular mechanisms underpinning the circulation and cellular uptake of Mycobacterium ulcerans toxin mycolactone. Front. Pharmacol. 2021;12:733496. doi: 10.3389/fphar.2021.733496. [DOI] [PMC free article] [PubMed] [Google Scholar]
- 14.Dangy J.P., Scherr N., et al. Pluschke G. Antibody-mediated neutralization of the exotoxin mycolactone, the main virulence factor produced by Mycobacterium ulcerans. PLoS Neglected Trop. Dis. 2016;10:e0004808. doi: 10.1371/journal.pntd.0004808. [DOI] [PMC free article] [PubMed] [Google Scholar]
- 15.Marion E., Song O.R., et al. Brodin P. Mycobacterial toxin induces analgesia in buruli ulcer by targeting the angiotensin pathways. Cell. 2014;157:1565–1576. doi: 10.1016/j.cell.2014.04.040. [DOI] [PubMed] [Google Scholar]
- 16.Song O.R., Kim H.B., et al. Brodin P. A bacterial toxin with analgesic properties: hyperpolarization of DRG neurons by mycolactone. Toxins. 2017;9:E227. doi: 10.3390/toxins9070227. [DOI] [PMC free article] [PubMed] [Google Scholar]
- 17.Sarfo F.S., Phillips R., et al. Simmonds R.E. Recent advances: role of mycolactone in the pathogenesis and monitoring of Mycobacterium ulcerans infection/Buruli ulcer disease. Cell Microbiol. 2016;18:17–29. doi: 10.1111/cmi.12547. [DOI] [PMC free article] [PubMed] [Google Scholar]
- 18.Leung D.W., Rosen M.K. The nucleotide switch in Cdc42 modulates coupling between the GTPase-binding and allosteric equilibria of Wiskott-Aldrich syndrome protein. Proc. Natl. Acad. Sci. USA. 2005;102:5685–5690. doi: 10.1073/pnas.0406472102. [DOI] [PMC free article] [PubMed] [Google Scholar]
- 19.Baron L., Paatero A.O., et al. Demangel C. Mycolactone subverts immunity by selectively blocking the Sec61 translocon. J. Exp. Med. 2016;213:2885–2896. doi: 10.1084/jem.20160662. [DOI] [PMC free article] [PubMed] [Google Scholar]
- 20.Hall B.S., Hill K., et al. Simmonds R.E. The pathogenic mechanism of the Mycobacterium ulcerans virulence factor, mycolactone, depends on blockade of protein translocation into the ER. PLoS Pathog. 2014;10:e1004061. doi: 10.1371/journal.ppat.1004061. [DOI] [PMC free article] [PubMed] [Google Scholar]
- 21.McKenna M., Simmonds R.E., High S. Mechanistic insights into the inhibition of Sec61-dependent co- and post-translational translocation by mycolactone. J. Cell Sci. 2016;129:1404–1415. doi: 10.1242/jcs.182352. [DOI] [PMC free article] [PubMed] [Google Scholar]
- 22.Aydin F., Sun R., Swanson J.M.J. Mycolactone toxin membrane permeation: atomistic versus coarse-grained MARTINI simulations. Biophys. J. 2019;117:87–98. doi: 10.1016/j.bpj.2019.05.012. [DOI] [PMC free article] [PubMed] [Google Scholar]
- 23.Hannich J.T., Umebayashi K., Riezman H. Distribution and functions of sterols and sphingolipids. Cold Spring Harbor Perspect. Biol. 2011;3:a004762. doi: 10.1101/cshperspect.a004762. [DOI] [PMC free article] [PubMed] [Google Scholar]
- 24.Harayama T., Eto M., et al. Shimizu T. Lysophospholipid acyltransferases mediate phosphatidylcholine diversification to achieve the physical properties required in vivo. Cell Metabol. 2014;20:295–305. doi: 10.1016/j.cmet.2014.05.019. [DOI] [PubMed] [Google Scholar]
- 25.Harayama T., Riezman H. Author Correction: understanding the diversity of membrane lipid composition. Nat. Rev. Mol. Cell Biol. 2019;20:715. doi: 10.1038/s41580-019-0171-x. [DOI] [PubMed] [Google Scholar]
- 26.Doktorova M., Symons J.L., Levental I. Structural and functional consequences of reversible lipid asymmetry in living membranes. Nat. Chem. Biol. 2020;16:1321–1330. doi: 10.1038/s41589-020-00688-0. [DOI] [PMC free article] [PubMed] [Google Scholar]
- 27.Gehringer M., Mäder P., et al. Altmann K.H. Configurationally stabilized analogs of M. Ulcerans exotoxins mycolactones A and B reveal the importance of side chain geometry for mycolactone virulence. Org. Lett. 2019;21:5853–5857. doi: 10.1021/acs.orglett.9b01947. [DOI] [PubMed] [Google Scholar]
- 28.Laio A., Gervasio F.L. Metadynamics: a method to simulate rare events and reconstruct the free energy in biophysics, chemistry and material science. Rep. Prog. Phys. 2008;71:126601. [Google Scholar]
- 29.Laio A., Parrinello M. Escaping free-energy minima. Proc. Natl. Acad. Sci. USA. 2002;99:12562–12566. doi: 10.1073/pnas.202427399. [DOI] [PMC free article] [PubMed] [Google Scholar]
- 30.Barducci A., Bussi G., Parrinello M. Well-tempered metadynamics: a smoothly converging and tunable free-energy method. Phys. Rev. Lett. 2008;100:020603. doi: 10.1103/PhysRevLett.100.020603. [DOI] [PubMed] [Google Scholar]
- 31.Dama J.F., Parrinello M., Voth G.A. Well-tempered metadynamics converges asymptotically. Phys. Rev. Lett. 2014;112:240602. doi: 10.1103/PhysRevLett.112.240602. [DOI] [PubMed] [Google Scholar]
- 32.Dama J.F., Rotskoff G., et al. Voth G.A. Transition-tempered metadynamics: robust, convergent metadynamics via on-the-fly transition barrier estimation. J. Chem. Theor. Comput. 2014;10:3626–3633. doi: 10.1021/ct500441q. [DOI] [PubMed] [Google Scholar]
- 33.Aydin F., Durumeric A.E.P., et al. Swanson J.M.J. Improving the accuracy and convergence of drug permeation simulations via machine-learned collective variables. J. Chem. Phys. 2021;155:045101. doi: 10.1063/5.0055489. [DOI] [PubMed] [Google Scholar]
- 34.Sun R., Dama J.F., et al. Voth G.A. Transition-tempered metadynamics is a promising tool for studying the permeation of drug-like molecules through membranes. J. Chem. Theor. Comput. 2016;12:5157–5169. doi: 10.1021/acs.jctc.6b00206. [DOI] [PubMed] [Google Scholar]
- 35.E W., Ren W., Vanden-Eijnden E. Simplified and improved string method for computing the minimum energy paths in barrier-crossing events. J. Chem. Phys. 2007;126:164103. doi: 10.1063/1.2720838. [DOI] [PubMed] [Google Scholar]
- 36.Jo S., Lim J.B., et al. Im W. CHARMM-GUI Membrane Builder for mixed bilayers and its application to yeast membranes. Biophys. J. 2009;97:50–58. doi: 10.1016/j.bpj.2009.04.013. [DOI] [PMC free article] [PubMed] [Google Scholar]
- 37.Doktorova M., Heberle F.A., et al. Marquardt D. Preparation of asymmetric phospholipid vesicles for use as cell membrane models. Nat. Protoc. 2018;13:2086–2101. doi: 10.1038/s41596-018-0033-6. [DOI] [PMC free article] [PubMed] [Google Scholar]
- 38.Guo H.-Y., Sun H.-Y., et al. Yu Z.-W. Fabrication of asymmetric phosphatidylserine-containing lipid vesicles: a study on the effects of size, temperature, and lipid composition. Langmuir. 2020;36:12684–12691. doi: 10.1021/acs.langmuir.0c02273. [DOI] [PubMed] [Google Scholar]
- 39.Doktorova M., Weinstein H. Accurate in silico modeling of asymmetric bilayers based on biophysical principles. Biophys. J. 2018;115:1638–1643. doi: 10.1016/j.bpj.2018.09.008. [DOI] [PMC free article] [PubMed] [Google Scholar]
- 40.Park S., Beaven A.H., et al. Im W. How tolerant are membrane simulations with mismatch in area per lipid between leaflets? J. Chem. Theor. Comput. 2015;11:3466–3477. doi: 10.1021/acs.jctc.5b00232. [DOI] [PMC free article] [PubMed] [Google Scholar]
- 41.Scott H.L., Kennison K.B., et al. Katsaras J. Model membrane systems used to study plasma membrane lipid asymmetry. Symmetry. 2021;13:1356. doi: 10.3390/sym13081356. [DOI] [PMC free article] [PubMed] [Google Scholar]
- 42.Blumer M., Harris S., et al. Bennett W.F.D. Simulations of asymmetric membranes illustrate cooperative leaflet coupling and lipid adaptability. Front. Cell Dev. Biol. 2020;8:575. doi: 10.3389/fcell.2020.00575. [DOI] [PMC free article] [PubMed] [Google Scholar]
- 43.Lorent J.H., Levental K.R., et al. Levental I. Plasma membranes are asymmetric in lipid unsaturation, packing and protein shape. Nat. Chem. Biol. 2020;16:644–652. doi: 10.1038/s41589-020-0529-6. [DOI] [PMC free article] [PubMed] [Google Scholar]
- 44.Case D.A., Cheatham T.E., III, et al. Woods R.J. The Amber biomolecular simulation programs. J. Comput. Chem. 2005;26:1668–1688. doi: 10.1002/jcc.20290. [DOI] [PMC free article] [PubMed] [Google Scholar]
- 45.Jämbeck J.P.M., Lyubartsev A.P. Derivation and systematic validation of a refined all-atom force field for phosphatidylcholine lipids. J. Phys. Chem. B. 2012;116:3164–3179. doi: 10.1021/jp212503e. [DOI] [PMC free article] [PubMed] [Google Scholar]
- 46.Jorgensen W.L., Chandrasekhar J., et al. Klein M.L. Comparison of simple potential functions for simulating liquid water. J. Chem. Phys. 1983;79:926–935. [Google Scholar]
- 47.Bussi G., Donadio D., Parrinello M. Canonical sampling through velocity rescaling. J. Chem. Phys. 2007;126:014101. doi: 10.1063/1.2408420. [DOI] [PubMed] [Google Scholar]
- 48.Berendsen H.J.C., Postma J.P.M., et al. Haak J.R. Molecular dynamics with coupling to an external bath. J. Chem. Phys. 1984;81:3684–3690. [Google Scholar]
- 49.Essmann U., Perera L., et al. Pedersen L.G. A smooth particle mesh Ewald method. J. Chem. Phys. 1995;103:8577–8593. [Google Scholar]
- 50.Hess B., Bekker H., et al. Fraaije J.G.E.M. LINCS: a linear constraint solver for molecular simulations. J. Comput. Chem. 1997;18:1463–1472. [Google Scholar]
- 51.Abraham M.J., Murtola T., et al. Lindahl E. Gromacs: high performance molecular simulations through multi-level parallelism from laptops to supercomputers. Software. 2015;1-2:19–25. [Google Scholar]
- 52.Tribello G.A., Bonomi M., et al. Bussi G. Plumed 2: new feathers for an old bird. Comput. Phys. Commun. 2014;185:604–613. [Google Scholar]
- 53.Bussi G., Tribello G.A. In: Biomolecular Simulations: Methods and Protocols. Bonomi M., Camilloni C., editors. Springer New York; 2019. Analyzing and biasing simulations with PLUMED; pp. 529–578. [DOI] [PubMed] [Google Scholar]
- 54.Gowers R, Linke M, …, Beckstein O MDAnalysis: a python package for the rapid analysis of molecular dynamics simulations.Python in Science Conference 98-105.
- 55.Michaud-Agrawal N., Denning E.J., et al. Beckstein O. MDAnalysis: a toolkit for the analysis of molecular dynamics simulations. J. Comput. Chem. 2011;32:2319–2327. doi: 10.1002/jcc.21787. [DOI] [PMC free article] [PubMed] [Google Scholar]
- 56.Humphrey W., Dalke A., Schulten K. VMD: visual molecular dynamics. J. Mol. Graph. 1996;14 doi: 10.1016/0263-7855(96)00018-5. 33–8, 27–28. [DOI] [PubMed] [Google Scholar]
- 57.Bennett W.F.D., MacCallum J.L., Tieleman D.P. Thermodynamic analysis of the effect of cholesterol on dipalmitoylphosphatidylcholine lipid membranes. J. Am. Chem. Soc. 2009;131:1972–1978. doi: 10.1021/ja808541r. [DOI] [PubMed] [Google Scholar]
- 58.Shinoda W. Permeability across lipid membranes. Biochim. Biophys. Acta. 2016;1858:2254–2265. doi: 10.1016/j.bbamem.2016.03.032. [DOI] [PubMed] [Google Scholar]
- 59.Cao Z., Zhang X., et al. Zhou Y. Different effects of cholesterol on membrane permeation of arginine and tryptophan revealed by bias-exchange metadynamics simulations. J. Chem. Phys. 2019;150:084106. doi: 10.1063/1.5082351. [DOI] [PubMed] [Google Scholar]
- 60.Yokogawa D., Ikegami T. A robust approach to calculate entropy change based on density functional theory in the energy representation. J. Chem. Phys. 2009;131:221101. doi: 10.1063/1.3272029. [DOI] [PubMed] [Google Scholar]
- 61.Quon E., Sere Y.Y., et al. Menon A.K. Endoplasmic reticulum-plasma membrane contact sites integrate sterol and phospholipid regulation. PLoS Biol. 2018;16:e2003864. doi: 10.1371/journal.pbio.2003864. [DOI] [PMC free article] [PubMed] [Google Scholar]
- 62.Enoki T.A., Feigenson G.W. Asymmetric bilayers by hemifusion: method and leaflet behaviors. Biophys. J. 2019;117:1037–1050. doi: 10.1016/j.bpj.2019.07.054. [DOI] [PMC free article] [PubMed] [Google Scholar]
Associated Data
This section collects any data citations, data availability statements, or supplementary materials included in this article.
Supplementary Materials
and Tables S1–S4