Abstract
Chaperones tapasin and transporter associated with antigen processing (TAP)-binding protein related (TAPBPR) associate with the major histocompatibility complex (MHC)-related protein 1 (MR1) to promote trafficking and cell surface expression. However, the binding mechanism and ligand dependency of MR1/chaperone interactions remain incompletely characterized. Here in vitro, biochemical and computational studies reveal that, unlike MHC-I, TAPBPR recognizes MR1 in a ligand-independent manner owing to the absence of major structural changes in the MR1 α2-1 helix between empty and ligand-loaded molecules. Structural characterization using paramagnetic nuclear magnetic resonance experiments combined with restrained molecular dynamics simulations reveals that TAPBPR engages conserved surfaces on MR1 to induce similar adaptations to those seen in MHC-I/TAPBPR co-crystal structures. Finally, nuclear magnetic resonance relaxation dispersion experiments using 19F-labeled diclofenac show that TAPBPR can affect the exchange kinetics of noncovalent metabolites with the MR1 groove, serving as a catalyst. Our results support a role of chaperones in stabilizing nascent MR1 molecules to enable loading of endogenous or exogenous cargo.
On the surface of nucleated cells in jawed vertebrates, class I major histocompatibility complex (MHC-I) molecules present a diverse repertoire of 8–15 residue peptide antigens derived from the endogenous proteome1. Intracellular assembly and trafficking of peptide/MHC-I (pMHC-I) complexes allow for their surveillance by CD8+ cytotoxic T lymphocytes in a process critical for immune homeostasis and recognition of invading pathogens or developing tumors1. In an analogous process, the nonclassical MHC-I-related protein 1 (MR1) presents small molecule ligands derived from the endogenous and exogenous metabolome to innate-like mucosal-associated invariant T (MAIT) or MR1-restricted T (MR1T) lymphocytes2. While MR1’s function in the immune system remains to be fully characterized, it is known to be important for recognition of microbial infections, distinguishing cancerous from healthy cells and regulation of autoimmune disease3-5. Known MR1 ligands include vitamin B9 metabolites such as 6-formylpterin/acetyl-6-formylpterin (6-FP/Ac-6-FP), vitamin B2 metabolites such as 5-(2-oxopropylideneamino)-6-d-ribitylaminouracil (5-OP-RU) and drug-like compounds6-9. An important feature of the pyrimidine- (for example, 5-OP-RU) and pterin-based potent antigens (for example 6-FP) is their covalent association with the MR1 groove via Schiff base formation to the side chain of K43 (refs. 6,9). Weaker antigens, such as ribityl lumazine derivatives and the drug diclofenac (DCF), are known to associate noncovalently with the A’ pocket leading to reduced fold stability and may downregulate MR1 surface expression through competition with other ligands7,8. Recent studies suggest that MR1 can display a much broader range of ligands, including gut microbial and cancer-specific metabolites that could serve as internal sensors for disease3,10.
The MHC-I antigen processing and presentation pathway has been studied in a plethora of functional, biochemical and structural studies1. The assembly of nascent MHC-I molecules with peptide and β2m occurs in the endoplasmic reticulum and is facilitated by dedicated molecular chaperones: tapasin, which is restricted within the endoplasmic reticulum-resident peptide-loading complex (PLC), and the homologous, PLC-independent transporter associated with antigen processing (TAP)-binding protein related (TAPBPR)11,12. For classical MHC-I, peptide loading alters chaperone recognition surfaces, particularly at the α2-1 helix and a3β2m interface, triggering chaperone release from the complex13-15. Nuclear magnetic resonance (NMR) studies have shown that the dynamic plasticity of the MHC-I groove, modulated by the bound peptide and amino acid polymorphisms, is an important feature for chaperone recognition16,17. In addition to stabilizing peptide-deficient MHC-I molecules, chaperones can directly exchange peptides that are captured by the MHC-I groove in a process known as editing13,18-20. Transport of high-affinity ligands to the endoplasmic reticulum triggers folding and translocation of MR1 to the cell surface, while ligand exchange can also occur outside the endoplasmic reticulum to stimulate presentation of MR1 molecules21,22. A pioneering study by McWilliam et al. has shown that tapasin and TAPBPR act as stabilizers of distinct MR1 conformations in the endoplasmic reticulum to promote ligand loading and trafficking to the cell surface23. However, a direct interaction of MR1 molecules with chaperones has yet to be established using an in vitro system. As a result, critical questions of how chaperones recognize MR1 molecules, and whether they may interfere with the ligand loading process, remain to be addressed.
Here, using a panel of 12 known compounds of diverse chemical scaffolds and MR1 functional outcomes, we characterize empty and ligand-loaded MR1–TAPBPR interactions. In contrast to peptide/MHC-I, our data show a lack of TAPBPR discrimination between ligand-loaded from ligand-deficient MR1 molecules. We additionally provide an integrative model of the MR1–TAPBPR complex, which reveals that molecular chaperones use a universal scaffolding surface to chaperone nascent MR1 and MHC-I molecules. Finally, we use a synthetic compound based on the DCF scaffold and 19F-detected Carr–Purcell–Meiboom–Gill (CPMG) NMR experiments to provide direct evidence that chaperones affect the binding rates of noncovalent metabolites in the MR1 groove. Our results support a multi-faceted role for molecular chaperones on MR1 maturation and ligand loading.
Results
Ligands modulate MR1 stability and conformational plasticity.
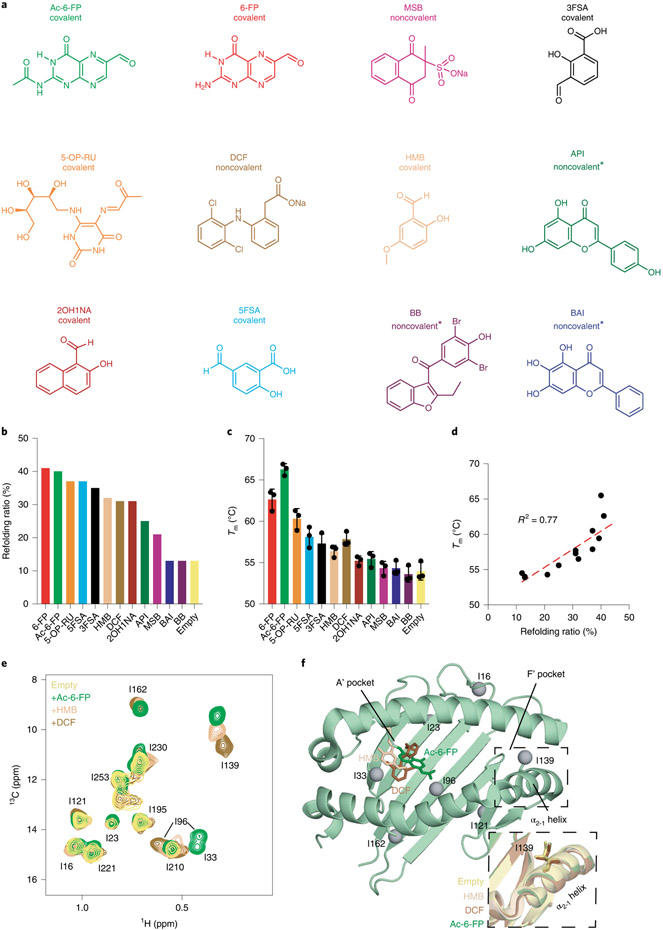
We expressed a soluble MR1 construct (human platform MR1, hpMR1) composed of the human ligand binding groove (α1 and α2 platform domain) with bovine α3 domain and bovine β2m (bβ2m) (Supplementary Fig. 1a-c)24. In contrast to hMR1, hpMR1 molecules can be prepared at milligram quantities in empty or ligand-bound forms6,24. We explored assembly of hpMR1 with a range of ligands, such as vitamin B9 metabolites (Ac-6-FP, 6-FP), vitamin B2 metabolites (5-OP-RU) and drugs or drug-like molecules (Fig. 1a, Supplementary Fig. 2a-d and Supplementary Table 1)8,9,25. Refolding in the presence of ligand increased refolding yields by up to 30% relative to the empty molecule (Fig. 1b and Supplementary Fig. 2b), and liquid chromatography–mass spectrometry (LC–MS) confirmed the expected occupancy of the hpMR1 groove in empty and ligand-bound states (Extended Data Fig. 1). Covalent ligands exhibited the largest enhancement with a refolding ratio of up to 41% relative to the 13% for empty hpMR1/bβ2m (Fig. 1b and Supplementary Fig. 2b), while noncovalent ligands increased yields to a lesser extent (Fig. 1b and Supplementary Fig. 2b). Differential scanning fluorimetry (DSF) showed a similar trend where an increase of up to 12 °C in melting temperature (Tm) was observed (Fig. 1c and Supplementary Fig. 2c). Refolding ratios and Tm values correlated (R2 = 0.77, Fig. 1d and Supplementary Fig. 2d). Tm values measured for hpMR1-bβ2m match those reported using hMR1–hβ2m complexes, validating the use of the chimeric construct for biochemical/ligand screening assays25. The wide range of thermal stabilities of hpMR1 molecules refolded with different covalent ligands (for example, Tm of 65.5 °C for Ac-6-FP versus 55.3 °C for 2-hydroxy-1-naphthaldehyde (2OH1NA)) suggests that Schiff base formation is not the only determinant of ligand selection, with complementary hydrophobic interactions with MR1 A’ pocket residues contributing to the binding free energy. This is supported by analysis of the buried surface area of different ligands in the MR1 groove from available X-ray structures of MR1–T cell receptor (TCR) complexes with TCR atoms removed (Supplementary Fig. 3). To obtain a quantitative estimate for equilibrium constants for interactions of noncovalent ligands with hpMR1, we used surface plasmon resonance (SPR). We measured dissociation constants in the 30–50 μM range, which correlated with thermal stabilities (Supplementary Fig. 4a-f). Taken together, these findings reveal a range of effects induced by ligand binding in biochemical properties of MR1 molecules.
Fig. 1 ∣. Ligand dependence of MR1 stability and conformational plasticity.
a, Chemical structures of MR1 ligands tested. The status of linkage to MR1 K43 is noted as covalent (if Schiff base formed) or noncovalent (if unlinked). Full compound names are summarized in Supplementary Table 1. Metabolites with unknown linkages are noted with predicted linkages with asterisks (metabolites without a freely available aldehyde or ketone are not predicted to form Schiff base with the amine of MR1 K43). b, Refolding ratio (%) of properly folded hpMR1 relative to the aggregate peak obtained from SEC following in vitro refolding with bβ2m in the presence and absence (empty) of ligands. c, Melting temperature (Tm, °C) obtained from DSF of refolded empty and ligand-bound hpMR1/bβ2m. Data are mean ± s.d. for n = 3 technical replicates. d, Correlation plot of Tm versus refolding ratio. The coefficient of determination from linear regression (dotted line, R2) is shown. e, 2D 1H-13C HMQC spectra of 10 μM Ile 13Cδ1-labeled hpMR1 (natural isotopic abundance bβ2m) in the absence (empty) and presence of 2 mM Ac-6-FP, HMB or DCF added ligands, recorded at a 1H field of 600 MHz at 25 °C. All samples contain 0.5% DMSO-d6. f, Ile-δ1 methyl groups (gray spheres) mapped onto the MR1 groove. Ligands shown as sticks are Ac-6-FP (PDB ID 4PJ5, dark green, TCR removed), HMB (PDB ID 5U2V, beige, TCR removed) or DCF (PDB ID 5U1R, brown, TCR removed). The dotted box highlights the position of the I139 side chains (shown as sticks) in X-ray structures of different ligand-bound MR1 complexes relative to empty hMR1R9H (PDB ID 6W9V, yellow, TCR removed).
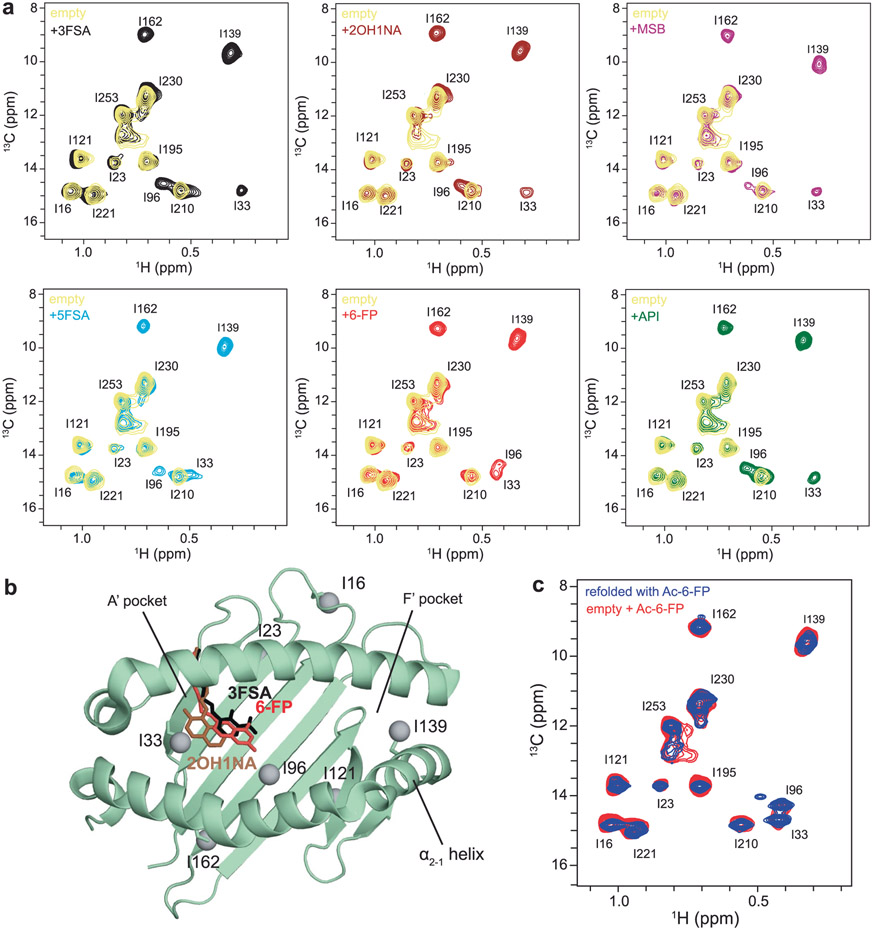
To examine whether different ligands influence the structure and conformational plasticity of the MR1 groove, we first performed a solution NMR characterization of the 44 kDa Ac-6-FP–hpMR1–bβ2m complex. Stereospecific NMR assignments of AILV side chain methyl (Ala 13Cβ, Ile 13Cδ1, Leu 13Cδ1/13Cδ2, Val 13Cγ1/13Cγ2) labeled hpMR1 refolded with natural isotopic abundance bβ2m in the presence of Ac-6-FP were obtained using a panel of samples and experiments (Extended Data Fig. 2a-d). High quality two-dimensional (2D) 1H-13C methyl heteronuclear single quantum coherence (HMQC) spectra of empty hpMR1 were obtained, where several methyl resonances corresponding to I33, I96, I139, I162 were broadened beyond detection, likely due to conformational exchange on the intermediate NMR timescale (Fig. 1e, empty). Similar behavior has been observed for peptide-free MHC-I molecules13,26. NMR titrations confirmed stoichiometric complex formation for Ac-6-FP and 2-hydroxy-5-methoxybenzaldehyde (HMB), while DCF associates with a KD of 32.5 μM in agreement with our SPR measurements (Supplementary Figs. 4a and 5a,b). Saturation of hpMR1 with 200-fold excess ligand rescued the attenuated NMR methyl resonances and resulted in ligand-dependent chemical shift perturbations (CSPs) of the δ1 methyl resonances of I33 and I96, positioned near the A’ pocket, and I139 on the α2-1 helix, distal to the ligand binding site (Fig. 1e,f and Extended Data Fig. 3a,b). Methyl HMQC spectra of Ac-6-FP bound hpMR1 generated from in vitro refolding were identical to those prepared from ligand titration (Extended Data Fig. 3c). While the chemical shift changes induced by ligand binding on the Cδ1-methyl resonances of I33 and I96 (within the A’ pocket) are consistent with interactions observed in previously solved X-ray structures of ligand–MR1–TCR complexes, ligand binding also affects the environment of I139 on the α2-1 helix suggesting the presence of either a long-range allosteric effect, or a secondary, non-covalent binding site (Fig. 1f). One caveat is that the influence of TCR docking on the structure of the α2-1 helix in different ligand–MR1 grooves is unknown because the corresponding free ligand–MR1 structures have not yet been solved.
TAPBPR chaperones MR1 in a ligand-independent manner.
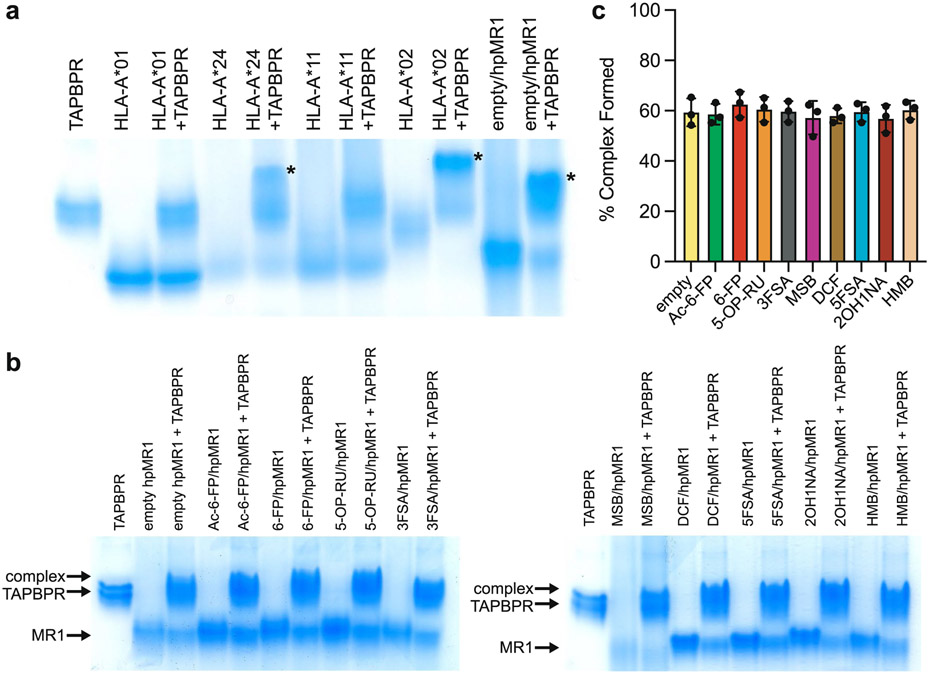
For a direct comparison between TAPBPR recognition of MR1 versus MHC-I (Supplementary Fig. 6), the interaction of peptide-deficient MHC-I or ligand-deficient hpMR1 with TAPBPR was examined using a native gel shift assay27. HLA-A*01:01 and HLA-A*11:01 showed no difference in electrophoretic mobility on ultraviolet (UV) irradiation (Extended Data Fig. 4a), but HLA-A*24:02, HLA-A*02:01 and hpMR1 showed evidence of complex formation with TAPBPR (Extended Data Fig. 4a, asterisk). Assays performed using hpMR1/bβ2m refolded with different ligands revealed that the MR1/TAPBPR complex also formed in the presence of ligand, and was independent on the identity of the bound ligand (Extended Data Fig. 4b,c).
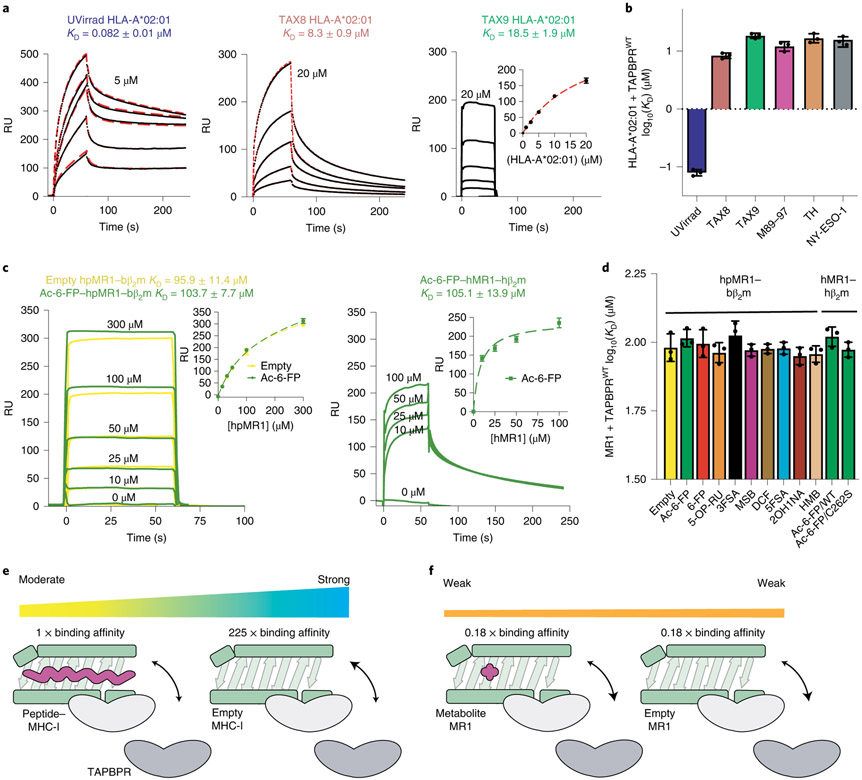
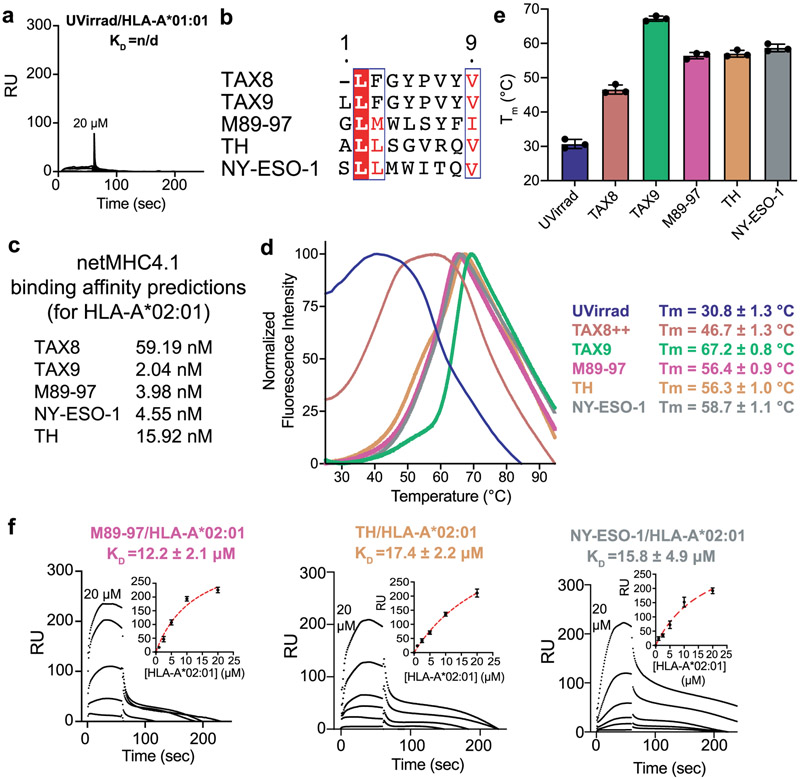
To obtain quantitative descriptions of interactions we used SPR27. Control experiments showed no interaction between HLA-A*01:01 and TAPBPR (Extended Data Fig. 5a), as previously established13,27. We examined TAPBPR binding to HLA-A*02:01 (herein called A02) refolded with a moderate affinity peptide TAX8 (LFGYPVYV) and a panel of high-affinity peptides including TAX9 (LLFGYPVYV)28, M89-97 (GLMWLSYFI), TH (ALLSGVRQV) and NY-ESO-1 (SLLMWITQV) (Extended Data Fig. 5b,c). We also used an A02 sample refolded with a photolabile peptide29 to evaluate TAPBPR interactions with empty MHC-I. DSF experiments revealed that UV-treated A02 was highly destabilized (Tm = 30.8 °C), compared to moderately stable TAX8/A02 (Tm = 46.7 °C) and highly stable TAX9/A02 (Tm = 67.2 °C), with M98-97/A02, TH/A02 and NY-ESO-1/A02 displaying Tm values in the range from 56 to 58 °C (Extended Data Fig. 5d,e). In agreement with previous studies focusing on the murine H2-Dd allotype13,14, SPR confirmed that TAPBPR binding to classical MHC-I was highly dependent on groove peptide occupancy (Fig. 2a). We observed an increase of the KD by nearly two orders of magnitude (0.082 versus 18.5 μM, Supplementary Table 2) for empty versus TAX9 peptide bound A02 (Fig. 2a,b). TAPBPR recognized A02 complexes prepared with other high-affinity peptides with a similar KD to TAX9-bound A02 (Fig. 2b, Extended Data Fig. 5f and Supplementary Table 2). We also observed a twofold increase in binding affinity of TAPBPR with the partially destabilized TAX8/A02, relative to TAX9/A02 (KD of 8.3 versus 18.5 μM, Fig. 2d,e), which is attributed to an increased dissociation rate constant (kd), relative to a peptide-deficient molecule (0.02 versus 0.004 s−1) (Supplementary Table 2). Taken together, these results support that the main determinant for TAPBPR recognition of properly conformed HLA-A*02:01 molecules is peptide occupancy of the MHC-I groove, rather than specific features of the bound peptide. However, chemical properties of peptides captured in the MHC-I groove may fine-tune interactions, likely via changes in protein dynamics of surfaces that are recognized by TAPBPR16.
Fig. 2 ∣. Biochemical characterization of TAPBPR interactions with empty or loaded MHC-I versus MR1.
a, Representative SPR sensorgrams for varying concentrations of UV-irradiated HLA-A*02:01/hβ2m as well as non-UV-irradiated (UVirrad) TAX8/HLA-A*02:01/hβ2m and TAX9/HLA-A*02:01/hβ2m flowed over a streptavidin chip coupled with TAPBPRWT-biotin. The concentration of analyte for the top sensorgram is noted. Fits from surface bound (TAX9) or kinetic (TAX8, UVirrad A*02:01) analysis are shown with dotted red lines. Data are mean ± s.d. for n = 3 technical replicates. b, The log-scale comparison of SPR determined KD values for TAPBPRWT interacting with HLA-A*02:01 exhibiting different groove occupancies. Data are mean ± s.d. for n = 3 technical replicates. c, SPR sensorgrams for varying concentrations of (left) empty (yellow) or Ac-6-FP (green) loaded hpMR1–bβ2m and (right) Ac-6-FP loaded hMR1/hβ2m flowed over a streptavidin chip coupled with TAPBPRWT-biotin. The analyte concentration of each sensorgram is noted. The insets show fits from surface bound analysis. Data are mean ± s.d. for n = 3 technical replicates. d, The log-scale comparison of SPR determined KD values for TAPBPR interacting with hpMR1 exhibiting different groove occupancies. Also shown are KD values for TAPBPR interacting with Ac-6-FP bound wild-type (WT) or C292S hMR1. Data are mean ± s.d. for n = 3 technical replicates. e,f, Schematic summary of the fold change in affinity of TAPBPR for empty versus peptide-loaded MHC-I (e) or empty versus metabolite-loaded MR1 (f). 1× represents the measured affinity of TAPBPR for peptide/MHC-I.
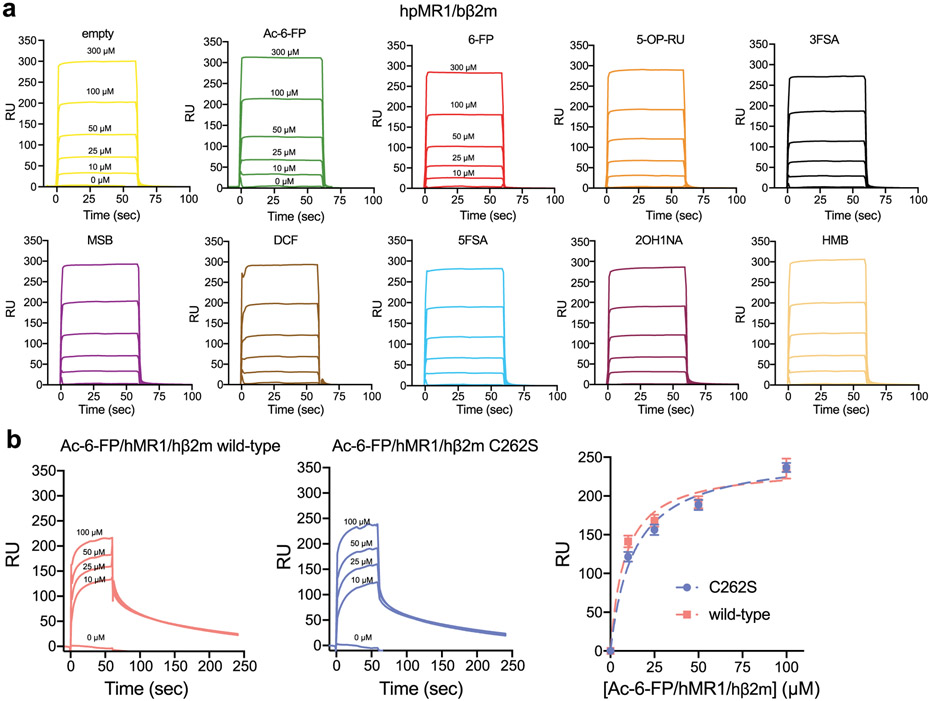
We determined the KD between TAPBPR with empty or Ac-6-F-P-bound hpMR1–bβ2m to be 95.9 and 103.7 μM, respectively (Fig. 2c, left, Extended Data Fig. 6a and Supplementary Table 2). Similarly, we measured KD values of roughly 100 μM for TAPBPR interaction with hMR1-hβ2m constructs, revealing similar affinities to the chimeric hpMR1 construct (Fig. 2c, right, Extended Data Fig. 6b and Supplementary Table 2). SPR performed between TAPBPR and a panel of hpMR1–bβ2m molecules refolded with different ligands revealed KD values in the 90 to 100 μM range (Fig. 2d, Extended Data Fig. 6a and Supplementary Table 2). We also examined the interaction between Ac-6-FP–hpMR1–bβ2m with TAPBPR at pH values representing different subcellular compartments: pH 7.2 (cytosol and endoplasmic reticulum), pH 6.5 (Golgi network and recycling endosome) and pH 5.5 (late endosome) (Supplementary Fig. 7a)30. DSF revealed TAPBPR and hpMR1 exhibit similar thermal stabilities between pH values of 5.5 and 7.2, confirming the presence of properly conformed molecules (Supplementary Fig. 7b). The hpMR1–TAPBPR interaction persisted across pH 7.2, 6.5 and 5.5 (Supplementary Fig. 7c), suggesting the possibility of chaperoning throughout the cellular trafficking pathway. Together, these data provide evidence that, while the TAPBPR interaction with classical MHC-I molecules is highly dependent on the peptide occupancy, the MR1–TAPBPR interactions are ligand independent (Fig. 2e,f).
MR1 exhibits a unique dynamic profile compared to MHC-I.
The interaction of Tapasin and TAPBPR with MHC-I molecules is highly dependent on conformational changes sampled by the peptide binding groove at timescales ranging from nanoseconds to milliseconds13,16,31. To compare the dynamic profiles of empty versus ligand-bound hpMR1 relative to an analogous MHC-I system, we used all-atom molecular dynamics (MD) simulations. The variance of Cα─Cα distances between representative residues spanning the hpMR1 or A02 grooves were computed from 100–200 ns MD simulation trajectories (Supplementary Figs. 8a and 9a). Representative conformations sampled in our MD simulations revealed that the empty A02 groove extended outward in an ‘open’ state, with pronounced changes at the C’, E’ and F’ pockets near the α2-1 helix, which deforms the F-pocket and inhibits peptide binding (Supplementary Figs. 8b-d and 9b-d). Unexpectedly, the empty hpMR1 groove exhibited a relatively static F’ pocket and instead collapsed inward to adopt a ‘closed’ conformational state at groove regions spanning M72-N146 and W69-Y152, a change that restricted availability of the A’ pocket to incoming metabolites (Supplementary Figs. 8b-d and 9b-d). Both Ac-6-FP or 6-FP-bound hpMR1 and TAX9-bound A02 exhibited reduced conformational variations at both the A and F pockets compared to their respective empty complexes (Supplementary Figs. 8b,e,f and 9b,e,f). Taken together, our results highlight differences in conformational dynamics sampled by empty versus ligand-bound molecules that may explain our observed peptide-dependent release of TAPBPR for MHC-I, and lack of metabolite-dependent release of TAPBPR for MR1.
TAPBPR recognizes similar MR1 and MHC-I epitopes.
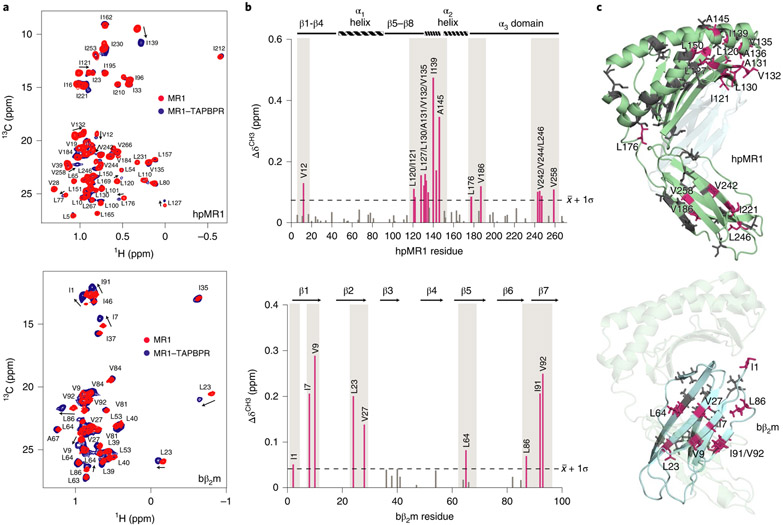
We used solution NMR to map the interaction of the 89 kDa Ac-6-FP–hpMR1-bβ2m-TAPBPR complex. Titration of threefold excess TAPBPR into hpMR1/bβ2m revealed saturated binding (Fig. 3a). CSPs mapped onto a RosettaCM model of Ac-6-FP–hpMR1–bβ2m revealed affected hpMR1 sites on the α2-1 helix, the pleated β-sheet on the floor of the groove and the α3 domain (Fig. 3b,c, top). For bβ2m, we identified a contiguous molecular surface located at the interface with the α3 domain (Fig. 3b,c, bottom). These surfaces affected by complex formation with TAPBPR are analogous to those identified by solution NMR for MHC-I (refs. 13,16-18).
Fig. 3 ∣. TAPBPR recognizes conserved interaction surfaces on MHC-I and MR1.
a, 2D 1H-13C methyl HMQC of 100μM free (red) or TAPBPR-bound (blue) Ac-6-FP/ILVproS labeled hpMR1/bβ2m (top) or Ac-6-FP/hpMR1/AILV labeled bβ2m (bottom) recorded at a 1H field of 600 MHz at 25 °C. b, CSP (ΔδCH3, ppm) analysis for methyl NMR resonances corresponding to residues of hpMR1 (top) or bβ2m (bottom) on TAPBPR binding. Dotted line represents the mean + s.d. Affected residues are colored warm pink. Gray boxes highlight interacting surfaces. c, CSPs plotted onto a RosettaCM model of hpMR1/bβ2m (PDB template 4PJ5, TCR removed). Methyl-bearing residues affected on TAPBPR binding on hpMR1 (top) or bβ2m (bottom), are shown in warm pink and unaffected residues in gray. hpMR1 and bβ2m are colored green and cyan, respectively.
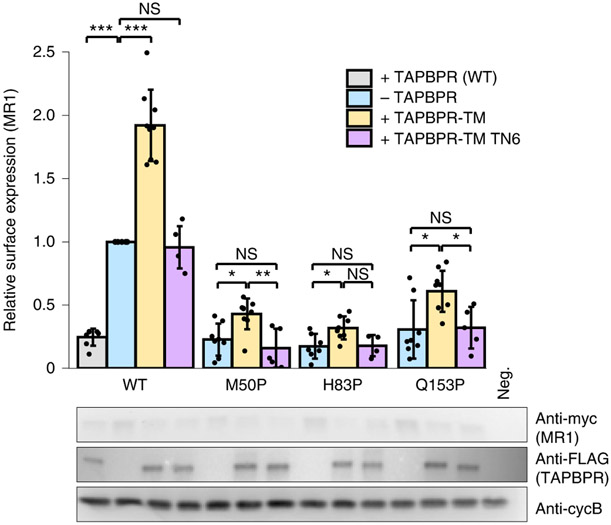
We further explored the MR1–TAPBPR interaction in human cells over-expressing hMR1. Cotransfection with TAPBPR resulted in MR1 being retained intracellularly, whereas cotransfection with TAPBPR-TM, which allows trafficking to the plasma membrane16,32, increased surface MR1 levels (Fig. 4 and Extended Data Fig. 7a,b). The increase in surface localization of MR1 was completely lost for the TN6 mutant of TAPBPR-TM12. Since TAPBPR has been shown to chaperone misfolded MHC-I (ref. 16), we tested three mutants of MR1 with proline substitutions at residues M50, H83 and Q153 to disrupt α-helical secondary structure elements in the α1-1, α1-2 and α2-2 helices, respectively. All proline mutants of MR1 were poorly expressed at the cell surface, consistent with intracellular retention due to improper folding. However, all proline mutants could be trafficked to the cell surface when over-expressed with TAPBPR-TM, albeit at lower levels relative to the wild-type MR1 (Fig. 4). As observed for the wild-type molecule, the functional interaction for proline mutations of MR1 was lost for the TAPBPR-TM TN6 mutant. Overall, our cell-based data further support TAPBPR sharing common characteristics in its physical association with properly conformed and misfolded molecules adopted by either MR1 or MHC-I.
Fig. 4 ∣. Indirect assessment of TAPBPR/MR1 interactions in cells.
Wild-type or proline mutants of human MR1 (x axis), with an extracellular c-myc tag, were expressed in Expi293F cells without or with FLAG-tagged TAPBPR, TAPBPR-TM or TAPBPR-TM TN6. Top, surface levels of MR1, measured by flow cytometry (representative data and gating strategy shown in Extended Data Fig. 7). Statistical significance was assessed using one-way ANOVA: NS, not significant; *P < 0.05, **P < 0.01, ***P < 0.001. A full list of P values is noted in the Methods. Bottom, western blots show total protein expression. Anti-cyclophilin B is a loading control. Neg., vector-only transfected cells. Data are mean ± s.d. from the following number of independent experiments: N = 4, MR1 H83P + TAPBPR-TM TN6; N = 5, MR1 Q153P + TAPBPR-TM TN6, MR1 M50P + TAPBPR-TM TN6, MR1 + TAPBPR-TM TN6; N = 7, MR1 + WT TAPBPR, MR1 H83P-TAPBPR; N = 8, MR1 M50P-TAPBPR, MR1 H83P + TAPBPR-TM, MR1 Q153P-TAPBPR; N = 9, MR1 -TAPBPR, MR1 + TAPBPR-TM, MR1 M50P + TAPBPR-TM, MR1 Q153P + TAPBPR-TM.
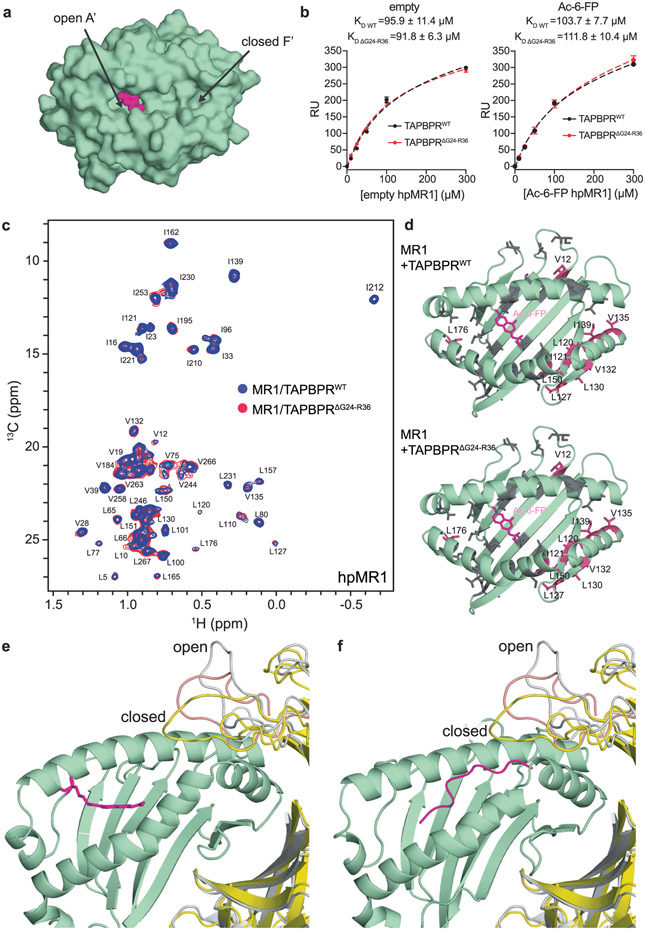
Finally, we used SPR and NMR to address whether the TAPBPR G24-R36 loop drives interactions with MR1 molecules18 (Extended Data Fig. 8a). The binding affinities of TAPBPRWT or TAPBPRΔG24-R36 for empty or Ac-6-FP bound hpMR1 were identical, with observed KD in the 90–100 μM range (Extended Data Fig. 8b and Supplementary Table 2). Further, MR1/TAPBPR complexes prepared with either TAPBPRWT or TAPBPRΔG24-R36 showed identical 2D 1H-13C methyl HMQC spectra and CSPs relative to the free hpMR1 state (Extended Data Fig. 8c,d). Together, these findings support the lack of a stable interaction between the TAPBPR G24-R36 loop and the floor of the MR1 groove in solution, in agreement with results using classical MHC-I (ref. 18) (Extended Data Fig. 8e,f), although it may interact with the MR1 groove transiently.
Integrative modeling of the 89 kDa MR1–TAPBPR complex.
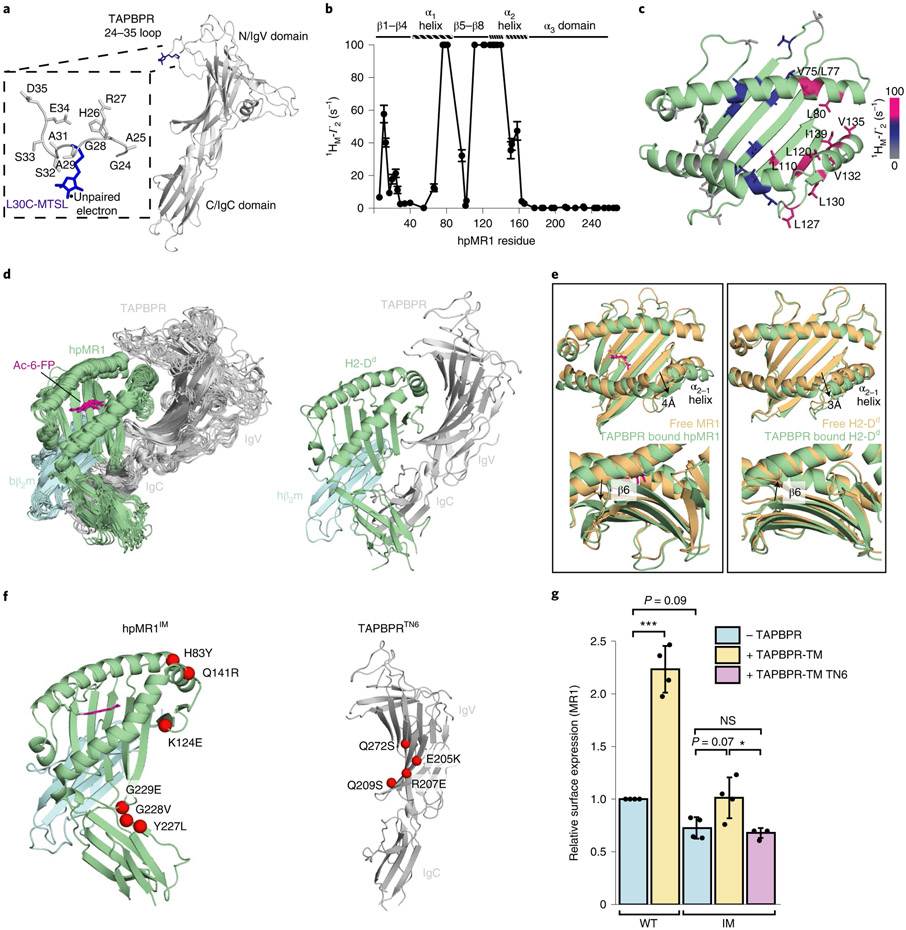
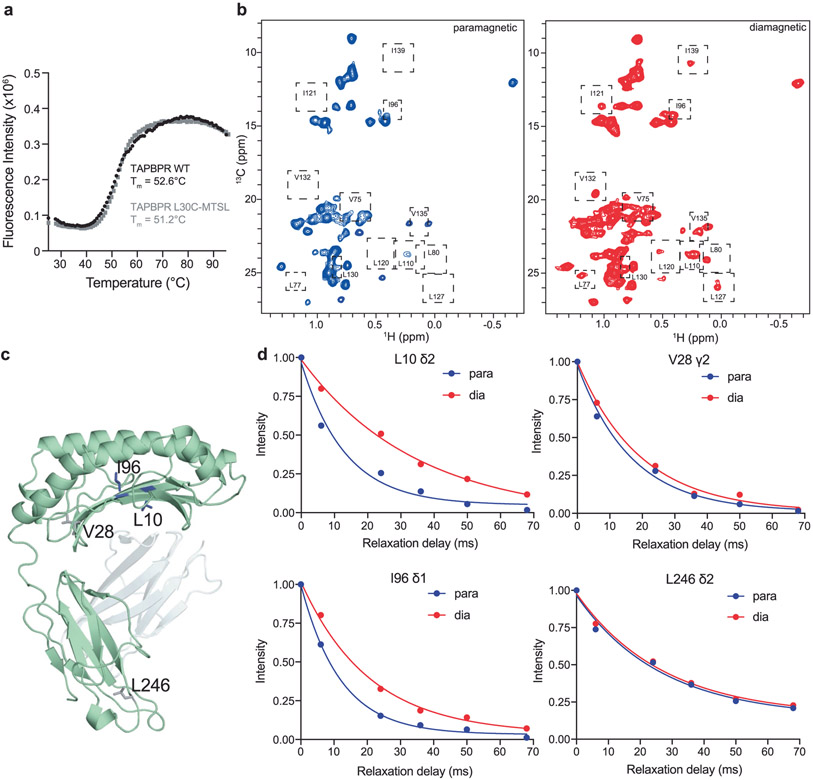
To obtain a structural model for the hpMR1–TAPBPR complex we used an integrative approach. NMR-derived CSPs obtained from solution NMR (Fig. 3) for hpMR1 or bβ2m and functional TAPBPR residues extracted from the literature14,15 were used as constraints to guide docking using HADDOCK33, starting from a randomized orientation of the subunits (Supplementary Tables 3 and 4). Next, paramagnetic relaxation enhancement (PRE) experiments34 were used to obtain medium- and long-range (up to 30 Å) distance restraints between the TAPBPR G24-R36 loop and ILVproS methyl residues of the hpMR1 groove. PRE datasets were recorded by using an MTSL (S-(1-oxyl-2,2,5,5-tetramethyl-2,5-dihydro-1H-pyrrol-3-yl)methyl methanesulfonothioate) nitroxide spin probe attached to the L30C mutant of TAPBPR (Fig. 5a and Supplementary Fig. 10a). Control DSF and one-dimensional (1D) 1H NMR experiments revealed that the L30C mutation of the TAPBPR G24-R36 loop and subsequent attachment of MTSL did not alter the thermal stability or protein fold relative to the TAPBPRWT molecule (Supplementary Fig. 10b and Extended Data Fig. 9a). Methyl proton (1HM-Γ2) PRE rates were determined for each methyl group (Extended Data Fig. 9b-d) and mapped onto the RosettaCM model of Ac-6-FP–hpMR1–bβ2m, revealing PRE effects for residues in the F’ pocket and moderate PRE effects for the middle of the MR1 groove (Fig. 5b,c). Altogether a total of 34 1HM-Γ2 PRE rates were measured and used as distance constraints for structure refinement in explicit solvent, all-atom MD simulations, which provided an ensemble of ten lowest-energy structures satisfying all CSP, PRE and functional constraints (Fig. 5d and Supplementary Tables 5 and 6)35,36.
Fig. 5 ∣. Comparison of the molecular features of TAPBPR-bound MR1 versus MHC-I.
a, Structural model of L30C-MTSL in the TAPBPR G24-R36 loop. b, Intermolecular 1HM-Γ2 PRE rates (s−1) of ILVproS methyl resonances corresponding to hpMR1 residues while in complex with TAPBPRL30C-MTSL. PREs that are too large to measure accurately (> 100 s−1) are plotted at 100 s−1. Error bars were derived from five Monte Carlo fitting procedures. c, Intermolecular 1HM-Γ2 PRE rates (s−1) plotted onto a RosettaCM model of hpMR1–bβ2m (PDB template 4PJ5, TCR removed). PRE effects are color-coded on the basis of strength: 0–10 s−1 shown in gray, 10–60 s−1 in blue and ≥ 100 s−1 shown in warm pink. 1HM-Γ2 PRE rates are listed in Supplementary Table 5. d, Left, an ensemble of the ten lowest-energy structural models of the Ac-6-FP–hpMR1–bβ2m–TAPBPR complexes from restrained MD simulations and right, X-ray structure of the H2-Dd–hβ2m–TAPBPR complex (PDB ID 5WER). e, Superposition of the groove of free (orange) and TAPBPR-bound (green with Ac-6-FP in magenta) MR1 versus H2-Dd. Arrows denote (top) widening of the groove at the α2-1 helix and (bottom) rearrangement of the pleated β-sheet of the floor of the antigen binding groove. f, Mutant proteins used. Left, mutations on hpMR1 at TAPBPR interacting surfaces, resulting in the hpMR1IM construct. Right, mutations on TAPBPR at hpMR1 interacting surfaces, resulting in the TAPBPRTN6 construct. g, Surface expression of mutant MR1IM was poorly responsive to TAPBPR-TM coexpression. Data are mean ± s.d. from N = 4 independent experiments. Statistical significance was determined by one-way ANOVA with Tukey test: *P < 0.05, ***P < 0.001. A full list of P values is noted in the Methods.
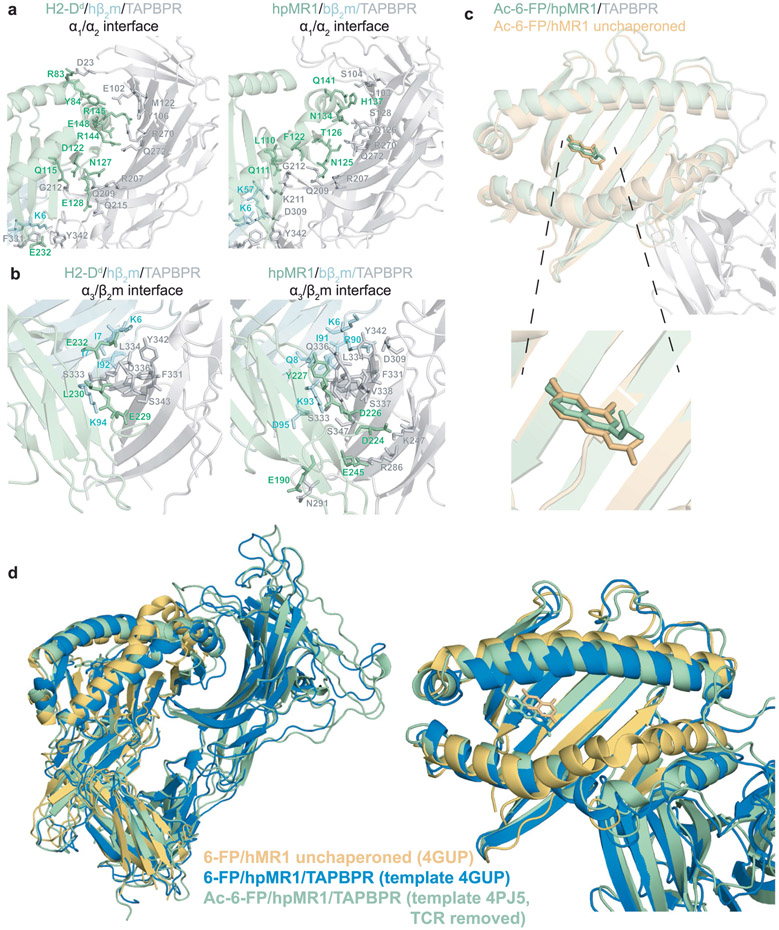
The overall orientation of the hpMR1, bβ2m and TAPBPR components in our refined MD/NMR ensemble resembles the X-ray structures of H2-Dd–hβ2m–TAPBPR and H2-Db–hβ2m–TAPBPR complexes (Fig. 5d)14,15. Our models reveal TAPBPR induced conformational changes to the MR1 heavy and light chains including (1) a roughly 4 Å widening of the α2-1 helix, (2) the TAPBPR jack hairpin affecting the pleated β-sheet of the groove (strands β6, β7 and β8) and (3) a global rearrangement of the α3–β2m interface (Fig. 5e and Supplementary Fig. 11a), similar to the MHC-I–TAPBPR structures14,15. The TAPBPRΔG24-R36 loop does not enter the MR1 groove throughout the 100 ns MD refinement (Fig. 5d), consistent with our NMR results (Extended Data Fig. 8c)18. The MR1/TAPBPR interface has a buried surface area of 2,007 Å2 comparable to 1,988 Å2 for the H2-Dd–TAPBPR interface, both within the expected range for a physiologically relevant protein complex. A total of 25 hydrogen bonds stabilize the MR1–TAPBPR interface (Extended Data Fig. 10a,b and Supplementary Table 7). Several TAPBPR residues known to interact with MHC-I–β2m also contribute to complex formation with MR1–β2m, although important polar contacts with the MHC-I heavy chain α1 helix, such as MHC-I Y84–TAPBPR E102, are lacking in the MR1–TAPBPR complex (Extended Data Fig. 10a,b). The conformation of Ac-6-FP in the TAPBPR-bound MR1 A’ pocket is highly similar to the conformation observed in the X-ray structure of unchaperoned hMR1 (Extended Data Fig. 10c). The overall conformation of MR1–TAPBPR complexes built and refined using the different MR1 structural templates (Protein Data Bank (PDB) 4PJ5, TCR atoms removed or PDB 4GUP) were perfectly superimposable, revealing that calculations performed using both structural templates resulted in the identical molecular orientations (Extended Data Fig. 10d).
To validate our model, we designed a mutant hpMR1 molecule (hpMR1IM), and used a previously characterized inactive TAPBPR mutant (TAPBPRTN6) (Fig. 5f). DSF experiments revealed mutant hpMR1IM and TAPBPRTN6 proteins were each properly conformed (Supplementary Fig. 11b). We found a complete loss of binding between hpMR1IM with TAPBPRWT or between hpMR1WT with TAPBPRTN6 by SPR, in agreement with our model of the complex structure (Supplementary Fig. 12a). Cell surface expression of full-length human MR1IM was also poorly responsive to TAPBPR-TM coexpression (Fig. 5g and Supplementary Fig. 12b).
TAPBPR affects the kinetics of noncovalent metabolite binding.
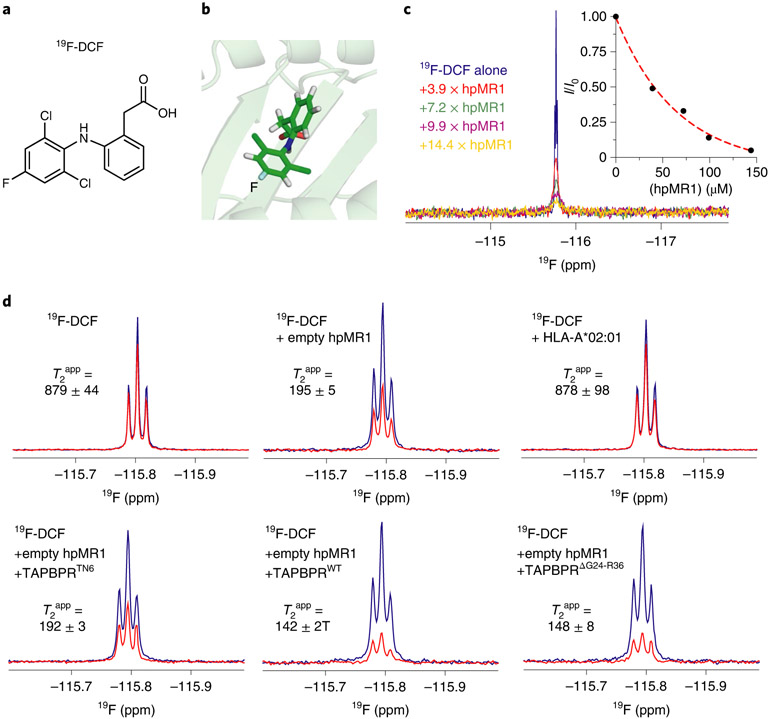
To address whether TAPBPR could influence binding of noncovalent metabolites to the MR1 groove, we developed a new 19F-labeled compound based on the noncovalent ligand DCF8 (19F-DCF, Fig. 6a,b). The 1D 19F NMR titrations of 19F-DCF with empty hpMR1 showed attenuation of the 19F resonance corresponding to free DCF, with an apparent KD of 36.1 μM (Fig. 6c). Thus, incorporation of 19F into the 2,6-dichlorophenyl moiety does not alter binding to hpMR1. The lack of changes in 19F chemical shift on hpMR1 titration suggests either that binding to hpMR1 is slow on the NMR timescale, where the resonance corresponding to the bound state is broadened beyond detection as the total size of the system increases from 308 to 44 kDa, or that the magnetic environment of 19F is similar in the free and hpMR1-bound forms.
Fig. 6 ∣. TAPBPR influences ligand residence times in the MR1 groove.
a, Chemical structure of in-house synthesized 19F-DCF. b, Structural model of 19F-DCF in the hpMR1 groove (template PDB ID 5U1R, TCR removed). c, 1D 19F NMR spectra of 10 μM 19F-DCF titrated with increasing concentrations of empty hpMR1/bβ2m, recorded using a TCI probe without 1H decoupling. A plot of NMR signal intensity (I/I0) as a function of hpMR1 concentration is shown. Data were collected at 25 °C at a 1H field of 600 MHz. d, 1D 19F CPMG NMR spectra of 500 μM 19F-DCF in the presence or absence of 5 μM empty hpMR1-bβ2m or 5 μM UVirrad HLA-A*02:01–hβ2m. Also shown are experiments where 10 μM TAPBPRWT, TAPBPRTN6 or TAPBPRΔG24-R36 were added. The T2app values (ms) were estimated from Rint, which represents the change in NMR signal intensity between spectra acquired with short (80 ms CPMG duration, blue spectrum) versus long (240 ms CPMG duration, red spectrum) relaxation filters using a broadband 19F CPMG experiment collected at 25 °C at a 1H field of 600 MHz. The NMR signal is split because our NMR probe is not capable of performing simultaneous 19F detection and decoupling of nearby 1H spins.
We next performed 19F-detected CPMG experiments, which provide direct measurements of chemical exchange between a free and bound forms on the intermediate (μs to ms) timescale37. The signal intensity ratio of experiments recorded using a short/long CPMG relaxation delay (Rint) are used to estimate an apparent transverse relaxation rate, R2app (1/T2app), which includes any chemical exchange contribution, Rex (ref. 37). In the presence of exchange between a free and a bound form, Rex depends on the kinetic exchange rate constant (kex) defined as the sum of the association and dissociation rate constants. We performed independent 1D 19F CPMG experiments to evaluate binding to MR1 in the absence or presence of different TAPBPR constructs. Free 19F-DCF had a T2app value of 879 ms, consistent with its molecular size (Fig. 6d)37,38. The addition of small amounts (<5%) of empty hpMR1 resulted in a significant decrease in T2app to 195 ms, indicative of enhanced relaxation due to chemical exchange with the MR1-bound state (Fig. 6d). Control experiments recorded for 19F-DCF in the presence of the nonbinder HLA-A*02:01 showed a T2app value of 878 ms, matching that of free 19F-DCF (Fig. 6d). Relative to 19F-DCF–hpMR1 mixtures, the addition of TAPBPRWT or TAPBPRΔG24-R36 further decreased T2app to 142 and 148 ms, respectively. This decrease in measured T2app was specific for TAPBPR that was competent for MR1 binding, where nonbinding mutant TAPBPRTN6 exhibited a T2app of 192 ms matching that of the 19F-DCF–hpMR1 mixture (Fig. 6d). Unlike on MHC-I, the presence of the TAPBPR G24-R36 loop does not affect the dissociation rate constant of ligands, likely due to its restricted access to the MR1 A’ pocket (Extended Data Fig. 8). Taken together, our NMR CPMG results reveal a kinetic effect of TAPBPR in the association of noncovalent ligands with the MR1 groove. Specifically, our data are consistent with an increase in both the association and dissociation rates of ligand binding, leading to an increase in relaxation as the small molecule compound binds to a much larger molecular complex.
Discussion
Our results underpin several important similarities and differences in how chaperones function to promote antigen presentation by MHC-I and MR1. In analogy to the MHC-I pathway1,11, our in vitro and in cell interaction studies demonstrate that TAPBPR can bind and stabilize a range of MR1 molecules (Figs. 2-4), in agreement with previous experiments23,39. Our NMR/MD structure of the bound complex reveals that TAPBPR induces analogous changes in the α2-1 helix and pleated β-sheet floor of the MR1 groove, in addition to the α3–β2m interface (Fig. 5d-g and Extended Data Fig. 10a,b), which appear to be conserved features of chaperone interactions that help stabilize the groove14,15,40. Homology-based models of the MR1–tapasin complex based on either the available HLA-A*03:01–tapasin cryoEM model40 or our determined MR1–TAPBPR structure (Supplementary Fig. 13 and Supplementary Table 8) provide additional insights into interactions with chaperones. Tapasin forms extensive interactions with the α2-1 helix, pleated β-sheet floor and α3 domain, in both models. However, the model built from the HLA-A*03:01–tapasin cryoEM structure lacks contacts between tapasin and β2m (refs. 23,40), in contrast to an extensive interface with β2m seen in both our MR1–TAPBPR NMR structure (Supplementary Table 8) and high-resolution X-ray structures of MHC-I–TAPBPR complexes23. Despite the structural homology of the two chaperones27, it remains unclear whether specific structural adaptations occur in a PLC-dependent (tapasin) versus PLC-independent (TAPBPR) setting. Thus, experimental determination of MR1–tapasin interactions, for example via deep mutational scans16,18, solution17 or solid-state41 NMR approaches pioneered for similar systems, would provide a more detailed understanding of MR1 processing within the PLC.
A major difference in TAPBPR interactions with MHC-I or MR1 pertains to discrimination between empty and loaded molecules (Fig. 2e,f). MD simulations showing that peptides can modulate the α2-1 helix conformation on MHC-I (refs. 13,16), but metabolites cannot induce analogous changes on the MR1 structure (Supplementary Figs. 8 and 9), provide a plausible explanation for the peptide-dependency of TAPBPR interactions with MHC-I versus ligand-independency of interactions with MR1. In addition, the TAPBPR G24-R36 loop promotes peptide loading on the MHC-I (ref. 18), but not metabolite loading on the MR1 groove (Extended Data Fig. 8 and Fig. 6d). It is conceivable that TAPBPR may influence the energy barriers for association/dissociation of ligand to empty MR1 molecules through allosteric modulation of the A’ pocket, to serve as an exchange catalyst. In support, our 1D 19F CPMG experiments revealed a clear TAPBPR effect in accelerating the binding kinetics of the noncovalent 19F-DCF ligand (Fig. 6d).
There are several important limitations to our study. First, wild-type hMR1/hβ2m cannot be prepared in the ligand-deficient state. Several mutations have enabled assembly of empty MR1 molecules, such as MR1R9H, MR1K43A and hpMR1 (refs. 24,25,42). However, hpMR1 is the only construct that does not disrupt the repertoire of ligands that can bind, and thus was chosen for this study. Second, our in vitro binding experiments were carried out using recombinant proteins prepared in Escherichia coli. Our indirect assessment of TAPBPR–MR1 interactions in cells corroborate our in vitro binding data (Figs. 4 and 5g) as well as other findings in studies of MR1–chaperone complexes performed in cells23. However, there may be cellular compartment specific differences in MR1–chaperone interactions, for example due to differences in pH, membrane association or glycosylation43,44. Finally, TAPBPR recognizes specific structural features dependent on dynamic motions of the MHC-I occurring on timescales up to milliseconds13,16, and therefore these properties of MR1 may not be sufficiently sampled in the 200 ns MD simulation timescale used here. Longer timescale simulations complemented by NMR experiments, such as CPMG and chemical exchange saturation transfer, performed on ligand-deficient and ligand-bound MR1 states can further discern the underlying molecular recognition process.
In summary, our work offers a view on two related molecules, MHC-I and MR1, which use specific adaptations of dynamic structural elements to modulate interactions within a conserved chaperone complex, toward presenting distinct classes of antigens. In the steady state, an abundant pool of peptides is supplied by normal protein turnover45, whereas an analogous pool of metabolites only becomes available under conditions of homeostatic perturbations provoked by infection, aberrant microbiome or malignancy states21. In addition, while the selection of peptide repertoires is dictated by specific interactions with several polymorphic residues in the MHC-I groove, MR1 ligands use a simpler docking process into a relatively conserved hydrophobic pocket. As a result, discrimination between free and bound MHC-I molecules is an essential function of chaperones for the process of cargo optimization, which appears to have been lost during the evolution of the MR1 processing pathway and the selection of metabolite ligands.
Methods
MR1 ligands and MHC-I peptides.
A full list of MR1 ligands used in this study and their abbreviations is shown in Supplementary Table 1. MR1 ligands were purchased from the following suppliers: Ac-6-FP (Cayman Chemical no. 23303), 6-FP (Cayman Chemical no. 14247), 3FSA (3-formylsalicylic acid) (Acros Organics no. 377070250), 5FSA (5-formylsalicylic acid) (Millipore Sigma no. F17601), MSB (menadione sodium bisulfite) (Millipore Sigma no. M2518), DCF (Millipore Sigma no. D6899), apigenin (Millipore Sigma no. PHR198), 2OH1NA (Millipore Sigma no. H45353), benzbromarone (Millipore Sigma no. B5774), HMB (Millipore Sigma no. 146862) and baicalein (Millipore Sigma no. 465119). 5-OP-RU was synthesized in-house from 5-N-RU (Supplementary Fig. 2a), which was generously provided by E. Adams (University of Chicago). Chemical structures were prepared using MarvinSketch (https://chemaxon.com/products/marvin). MHC-I peptides used for refolding were prepared by chemical synthesis (Biopeptek Inc. or GenScript): photoA02 (KILGFVFJV, where J is the photolabile 3-amino-3-(2-nitrophenyl)-propionic acid), TAX8 (LFGYPVYV), TAX9 (LLFGYPVYV), M89-97 (GLMWLSYFI), TH (ALLSGVRQV), NY-ESO-1 (SLLMWITQV) for HLA-A*02:01 (refs. 28,29) and photoA01 (STAPGJLEY) for HLA-A*01:01.
Chemical synthesis of 19F-DCF.
In house, 2-(2-((2,6-dichloro-4-fluorophenyl)amino)phenyl)acetic acid (herein called 19F-DCF) was synthesized. Briefly, 2-Iodophenylacetic acid (131 mg, 0.5 mmol) was added in one portion to a mixture of 2,6-dichloro-4-fluoroaniline (360 mg, 2.0 mmol), potassium carbonate (345 mg, 2.5 mmol) and copper iodide (191 mg, 1 mmol) in N-methylpyrrolidinone (1 ml) and the reaction was heated to 100 °C for 18 h. The reaction was cooled to room temperature and diluted with ethyl acetate (20 ml) and water (10 ml), followed by the addition of activated charcoal (1 g), celite (1 g) and concentrated HCl (0.6 ml) and stirred for a further hour. After filtering the suspension, the organic layer was collected and dried under vacuum to give a liquid that was purified by column chromatography eluting 9:1 hexane/ethyl acetate (4 min), followed by a gradient to 2:8 hexane/ethyl acetate (8 min). Fractions were combined and dried under vacuum to give a white solid (7.5 mg, 4%). The compound identity and purity were confirmed by 1D 1H, 13C and 19F NMR (Supplementary Figs. 14-16).
Protein expression, refolding and purification.
DNA encoding the luminal domain of hpMR1 (human platform MR1, heavy chain), human MR1 (hMR1), hMR1 C262S and bovine β2m (bβ2m, light chain) were generously provided by E. Adams (University of Chicago). DNA encoding the luminal domains of class I MHC (MHC-I) heavy chains HLA-A*01:01, HLA-A*02:01 and human β2m (hβ2m, light chain) were provided by D. Long of the National Institutes of Health Tetramer Core Facility. DNA plasmids were transformed into E. coli BL21(DE3) (New England Biolabs). Proteins were expressed in Luria–Bertani medium and inclusion bodies were solubilized using guanidine hydrochloride13,16,18. For in vitro refolding, 50 mg mixtures of hpMR1:bβ2m or hMR1/hβ2m at a 1:1 molar ratio were slowly diluted over 24 h into 1 l of refolding buffer (0.4 M arginine–HCl, 2 mM EDTA, 4.9 mM reduced l-glutathione, 0.57 mM oxidized l-glutathione, 100 mM Tris pH 8.0) at 4 °C while stirring in the absence of ligand (empty hpMR1) or in the presence of 2 mg of ligand dissolved in 1 ml of dimethylsulfoxide (DMSO). Refolding proceeded for 4 d at 4 °C without stirring. pMHC-I complexes were generated in a similar manner using 200 mg mixtures of heavy chain:light chain at a 1:3 molar ratio and 10 mg of peptide dissolved in 1 ml of DMSO. MHC-I molecules refolded with photolabile peptides were protected from light with aluminum foil. The refolding mixtures were concentrated using Pellicon Single-Pass Tangential Flow Filtration (Millipore Sigma) and Amicon ultra centrifugal filters (Millipore Sigma). Purification of hpMR1–bβ2m, hMR1–hβ2m and MHC-I complexes was performed by size-exclusion chromatography (SEC) with a HiLoad 16/600 Superdex 75 pg column at 1 ml min−1 with running buffer (150 mM NaCl, 25 mM Tris, pH 8). Refolding ratio (%) was determined by integrating the total area under the aggregate peak (roughly 45 mins) and the refolded hpMR1 peak (roughly 60 min) from SEC traces and then calculating the ratio of AreaFolded/AreaAggregate. The luminal domain of TAPBPR C94S (lacks the nondisulfide bonded free cysteine, referred to as TAPBPRWT) was expressed using a Drosophila S2 cell expression system and purified as described previously27. Likewise, TAPBPRTN6 (E205K, R07E, Q209S, Q272S) and TAPBPRΔG24-R36 (removal of residues G24-R36) have been previously described12,18. TAPBPR L30C, C94S mutant (referred to TAPBPRL30C) was generated by site-directed mutagenesis and confirmed with DNA sequencing. TAPBPR mutants were generated using the following primers: L30C primers forward 5′ cac cgt gga gct tgc gcc agc agt gag 3′ and reverse 5′ ctc act gct ggc gca agc tcc acg gtg 3′; C94S primers forward 5′ ctc cat gct gac agc agt ggg aag gag 3′ and reverse 5′ ctc ctt ccc act gct gtc agc atg gag 3′. Following purification all proteins were exhaustively buffer exchanged into 50 mM NaCl, 20 mM sodium phosphate pH 7.2. A synthetic gene for the hpMR1IM construct (mutations H83Y, K124E, Q141R, Y227L, G228V, G229E) was ordered (GenScript) and subcloned into pET22b using NdeI/BamHI restriction sites. Protein concentration was determined using absorbance (A280) measurements on a NanoDrop with extinction coefficients estimated with ExPASy ProtParam.
DSF.
DSF experiments were performed in triplicate (n = 3) on an Applied Biosystems 7900HT Fast Real-Time PCR System with excitation and emission wavelengths set to 470 and 569 nm, respectively, with proteins in buffer of 50 mM NaCl, 20 mM sodium phosphate pH 7.2. Experiments were conducted in MicroAmp Fast 384-well plates with 20 μl total volume containing final concentrations of 7 μM protein and 10× SYPRO orange dye (Thermo Fisher). Temperature was incrementally increased at a scan rate of 1 °C min−1 between 25 and 95 °C. Data analysis and fitting were performed in GraphPad Prism v.7.
Rosetta modeling.
Rosetta’s comparative modeling (RosettaCM) protocol was used to generate models of the Ac-6-FP–hpMR1–bβ2m complexes from an Ac-6-FP–hMR1–hβ2m X-ray structure template (PDB ID 4PJ5, TCR removed) or to generate models of the 6-FP–hpMR1–bβ2m complexes from an 6-FP–hMR1–hβ2m X-ray structure template (PDB ID 4GUP). The missing loops of TAPBPR were built using RosettaCM from the MHC-I–TAPBPR X-ray structure template (PDB ID 5WER)14. The RosettaCM model of hpMR1–bβ2m–tapasin was built from (PDB ID 6ENY)40. High-resolution structure refinement of the resulting models was carried out using Rosetta’s idealize and relax protocols.
Native gel shift assay.
For native gel shift assays, 20 μl of 20 μM of purified TAPBPR, pMHC-I and hpMR1–bβ2m were loaded into polyacrylamide gel wells alone or as mixtures. The following were used as pMHC-I samples: STAPGJLEY/HLA-A*01:01-hβ2m, KILGFVFJV/HLA-A*02:01-hβ2m, RVFAJSFIK/HLA-A*11:01-hβ2m and VYGJVRACL/HLA-A*24:02-hβ2m. The following were used as MR1 samples: empty hpMR1–bβ2m, Ac-6-FP–hpMR1–bβ2m, 6-FP–hpMR1–bβ2m, 5-OP-RU–hpMR1–bβ2m, 3FSA–hpMR1–bβ2m, MSB–hpMR1–bβ2m, DCF–hpMR1–bβ2m, 5FSA–hpMR1–bβ2m, 2OH1NA–hpMR1–bβ2m and HMB–hpMR1–bβ2m. For mixtures, 20 μM of pMHC-I or MR1 were incubated with 20 μM TAPBPR (1:1 molar ratio) for 1 h at 25 °C. Mixtures of pMHC-I and TAPBPR were UV irradiated for 1 h at 365 nm. Samples were then run at 90 V on 12% polyacrylamide gels in tris-glycine running buffer (25 mM TRIS pH 8.5, 192 mM glycine) at 25 °C for 7 h, stained using InstantBlue (Expedeon) and destained with water. Intensities of gel bands were analyzed using ImageJ v.1.53 (National Institutes of Health).
SPR.
SPR experiments were conducted in triplicate (n = 3) using a BiaCore T200 instrument (Cytiva) in SPR buffer (50 mM NaCl, 20 mM sodium phosphate pH 7.2, 0.05% Tween-20). For pH comparison experiments, proteins were extensively dialyzed into 50 mM NaCl, 20 mM sodium phosphate, 0.05% Tween-20 with pH values of 5.5, 6.5 or 7.2. The buffering range for sodium phosphate is pH 5.8 to 8. Approximately 1,000 resonance units (RU) of biotinylated-TAPBPRWT, biotinylated-TAPBPRTN6 or biotinylated-TAPBPRΔG24_R36 was immobilized at 10 μl min−1 on a streptavidin-coated chip (GE Healthcare). MR1 or MHC-I were then captured on the TAPBPR coated surface followed by a wash-out step with buffer. Before SPR experiments for UV-irradiated HLA-A*01:01 and UV-irradiated HLA-A*02:01, STAPGJLEY/HLA-A*01:01–hβ2m and KILGFVFJV/HLA-A*02:01–hβ2m were diluted to the desired concentrations (0, 1, 2.5, 5, 10 and 20 μM for UV-irradiated HLA-A*01:01 or 0, 0.25, 0.5, 1, 2.5 and 5 μM for UV-irradiated HLA-A*02:01) then UV irradiated for 20 min at 365 nm. SPR data were immediately acquired following UV irradiation. For experiments with TAX8, excess TAX8 peptide was used to ensure there was no population of empty MHC-I. Specifically, 200 μM TAX8 peptide was present in the SPR running buffer. In addition, each sample of TAX8/HLA-A*02:01 also incubated with 200 μM TAX8 peptide for 2 h before flowing over the TAPBPR-coupled chip. For MR1 experiments, various concentrations (0, 10, 25, 50, 100 and 300 μM) of purified empty or ligand-bound hpMR1–bβ2m or hMR1–hβ2m complexes were tested in SPR buffer. For SPR experiments to measure ligand binding to MR1, approximately 1,000 RU of biotinylated-empty hpMR1WT was immobilized at 10 μl min−1 on a streptavidin-coated chip (GE Healthcare). DCF, MSB, apigenin, baicalein or benzbromarone were dissolved in SPR running buffer with DMSO (50 mM NaCl, 20 mM sodium phosphate pH 7.2, 0.05% Tween-20, 2.5% DMSO). The following ligand concentrations flowed over the MR1-coupled chip: 0, 5, 20 and 50 μM. In all experiments samples were injected over the chip at 25 °C at a flow rate of 20 μl min−1 for 60 s followed by a buffer wash with 180 s dissociation time and equilibrium data were collected. The SPR sensorgrams, association/dissociation rate constants (ka, kd) and equilibrium dissociation constants KD values were analyzed in BiaCore T200 evaluation software (Cytiva) using kinetic analysis settings. SPR sensorgrams were prepared in GraphPad Prism v.7.
MR1 surface expression in transfected human cells.
A synthetic gene encoding human codon-optimized MR1 (GenBank NP_001522.1) was synthesized (IDT) encoding, from N to C terminus, the signal peptide of influenza HA, a c-myc epitope tag, gly/ser-rich linker and hMR1. The gene was cloned into the NheI-XhoI sites of pCEP4 (Invitrogen) and sequence verified. Plasmids for FLAG-tagged TAPBPR and TAPBPR-TM are previously described16. All mutations were introduced by site-directed mutagenesis and sequence verified. Proteins were expressed in Expi293F cells (ThermoFisher) cultured in Expi293 Expression media (ThermoFisher) at 37 °C, 125 r.p.m. and 8% CO2. Cells were cotransfected at a density of 2 × 10⁶ per ml with 500 ng of plasmid DNA using Expifectamine (ThermoFisher). Cells were gathered 23–24 h posttransfection, washed with Dulbecco’s PBS supplemented with 0.2% bovine serum albumin (BSA), stained with 1/200 anti-c-myc-Alexa Fluor 647 (clone 9B11, Cell Signaling Technology), washed twice with PBS-BSA and analyzed on a BD Accuri cytometer. Data were analyzed with FCS Express 6 (De Novo Software). Statistical significance was assessed using one-way analysis of variance (ANOVA) with Tukey test in GraphPad Prism. P values for Fig. 4 are: MR1 -TABPPR versus MR1 + TABPPR-TM < 0.0001; MR1-TABPPR versus MR1 + TAPBPR-TN6 0.9672; MR1-TABPPR versus wild-type TAPBPR <0.0001; MR1 M50P-TAPBPR versus MR1 M50P + TAPBPR-TM 0.014; MR1 M50P-TAPBPR versus MR1 M50P + TAPBPR-TM TN6 0.6439; MR1 M50P + TAPBPR-TM versus MR1 M50P + TAPBPR-TM TN6 0.0045; MR1 H83P-TAPBPR versus MR1 H83P + TAPBPR-TM 0.0216; MR1 H83P-TAPBPR versus MR1 H83P + TAPBPR-TM TN6 0.9968; MR1 H83P + TAPBPR-TM versus MR1 H83P + TAPBPR-TM TN6 0.0626; MR1 Q153P-TAPBPR versus MR1 Q153P + TAPBPR-TM 0.012; MR1 Q153P-TAPBPR versus MR1 Q153P + TAPBPR-TM TN6 0.9922; MR1 Q153P + TAPBPR-TM versus MR1 Q153P + TAPBPR-TM TN6 0.0375. P values for Fig. 5: MR1–TAPBPR versus MR1 + TAPBPR-TM < 0.0001; MR1–TAPBPR versus MR1 IM-TAPBPR 0.0943; MR1 IM-TAPBPR versus MR1 IM + TAPBPR-TM 0.0752; MR1 IM-TAPBPR versus MR1 IM + TAPBPR-TM TN6 0.9878 and MR1 IM + TAPBPR-TM versus MR1 IM + TAPBPR-TM TN6 0.0306.
Western blots.
Samples were prepared by addition of reducing SDS load dye to cell pellets and sonicated. Proteins were separated by gel electrophoresis and transferred to a polyvinylidene difluoride membrane. FLAG blots were blocked with 3% BSA in Tris-buffered saline supplemented with 0.1% Tween-20 (TBS-T), incubated with 1/1,000 anti-FLAG M2 AP (Sigma-Aldrich) diluted in TBS-T containing 1% BSA, washed five times with TBS-T and developed using 1-Step NBT/BCIP (ThermoFisher). MYC b and cyclophilin B blots were blocked with 5% skim milk powder in TBS-T, incubated with 1/1,000 rabbit anti-MYC (clone 71D10, Cell Signaling Technology) or 1/1,000 rabbit anti-cyclophilin B (Invitrogen) diluted in 0.5% milk/TBS-T, washed five times with TBS-T, followed by secondary incubation with 1/10,000 goat anti-rabbit horseradish peroxidase (Jackson ImmunoResearch Laboratories), washed five times with TBS-T and developed using Clarity Western ECL Substrate (Biorad).
NMR samples and methyl resonance assignment.
NMR samples were prepared using the following isotope-selective labeling schemes: Ile methyl (Ile 13Cδ1 in an otherwise U-[14N, 12C, 1H] background), AILV methyl (Ala 13Cβ, Ile 13Cδ1, Leu 13Cδ1/13Cδ2, Val 13Cγ1/13Cγ2 in an otherwise U-[15N, 12C, 2H] background), ILVproS (Ile 13Cδ1; Leu 13Cδ2; Val 13Cγ2 in an otherwise U-[15N, 12C, 2H] background) and ILV* (Ile 13Cδ1; Leu 13Cδ1/13Cδ2 and Val 13Cγ1/13Cγ2 in an otherwise U-[15N, 13C, 2H] background)13,46. Samples were in the concentration range of 150 to 300 μM prepared in NMR buffer (50 mM NaCl, 20 mM sodium phosphate pH 7.2, 10% D2O). In a manner analogous to MHC-I, the heavy chain hpMR1 and light chain bβ2m were isotopically labeled individually using M9 media in E. coli13 and refolded with natural isotopic abundance complex components. For prolonged stability, 1.5-fold molar excess of natural isotopic abundance bβ2m was added to the final samples containing isotopically labeled hpMR1. Resonance assignments were derived separately for each of the heavy and light chains from a series of 2D and three-dimensional (3D) experiments recorded at a 1H field of 600 or 800 MHz at 25 °C. Specifically, unambiguous stereospecific assignments of methyl resonances were obtained by acquiring (1) information on Ile, Leu and Val methyl residue types using 2D 1H-13C methyl constant time HMQC with a valine-selective decoupling pulse47, (2) Ala methyl residue types were obtained by comparison of 2D 1H-13C HMQCs recorded on AILV and ILV* labeled samples, (3) proS assignments were obtained by comparison of 2D 1H-13C HMQCs recorded on ILVproS and ILV* labeled samples and (4) methyl–methyl nuclear Overhauser effects (NOEs) in 3D HM-CMHM and 3D CMCMHM SOFAST NOESY experiments with relaxation delay (d1) of 0.2 s and a NOE mixing time (d8) of 0.3 s (ref. 48). Final methyl assignments were validated using MAUS v.01 (ref. 46). All NMR data were processed with NMRPipe v.9.9 (ref. 49) and analyzed using NMRFAM-SPARKY v.1.413 (ref. 50).
NMR titrations and chemical shift mapping.
For titration of compounds into empty hpMR1–bβ2m, each compound was dissolved to 0.4 M in DMSO-d6 (Millipore Sigma no. 151874). Briefly, 1.5 μl of compound was titrated into 300 μl of NMR sample (10 μM Ile δ1 labeled hpMR1 refolded with natural isotopic abundance bβ2m in the absence of ligand) and mixed. The final concentration in each sample was 10 μM Ile methyl hpMR1–bβ2m, 2 mM compound and 0.5% DMSO-d6 in NMR buffer (50 mM NaCl, 20 mM sodium phosphate pH 7.2, 10% D2O). The reference NMR sample (no compound) was also titrated with 1.5 μl of 100% DMSO-d6 and contained 0.5% DMSO-d6. 2D 1H-13C methyl SOFAST HMQC of 10 μM Ile δ1 labeled hpMR1 (natural isotopic abundance bβ2m) were recorded in the absence (empty) and presence of 2 mM compound at a 1H field of 600 MHz at 25 °C with relaxation delay (d1) of 0.2 s. For more multipoint NMR titrations, 10 μM Ile δ1 labeled methyl hpMR1/bβ2m was titrated with Ac-6-FP, HMB or DCF with final concentrations of 0, 2.5, 5, 10, 30 and 50 μM. Data were fit in GraphPad Prism v.7.
For comparison of free and TAPBPR-bound states, the following samples were used: (1) 100 μM AILV hpMR1 (natural isotopic abundance bβ2m and Ac-6-FP) + threefold molar excess TAPBPRWT, (3) 100 μM ILVproS hpMR1 (natural isotopic abundance bβ2m and Ac-6-FP) + threefold molar excess TAPBPRWT or TAPBPRΔG24-R36 and (3) 100 μM AILV bβ2m (natural isotopic abundance hpMR1 and Ac-6-FP) + threefold molar excess TAPBPRWT. 2D 1H-13C methyl SOFAST HMQC spectra were recorded at a 1H field of 600 MHz at 25 °C with a relaxation delay (d1) of 0.2 s. CSP (measured in ppm) were determined using the equation ΔδCH3 = (1/2(ΔδH2 + ΔδC2/4))1/2.
MTSL labeling and PREs.
MTSL labeling of TAPBPRL30C was performed as mentioned in Supplementary Fig. 10a and followed well established protocols51. Briefly, TAPBPRL30C was incubated for 1 h with tenfold molar excess of dithiothreitol (DTT) at 25 °C. The protein–DTT mixture was then passed through PD-10 desalting columns (Cytiva) into a beaker containing 20-fold molar excess of (1-oxyl-2,2,5,5-tetramethyl-Δ3-pyrroline-3-methyl) methanethiosulfonate (MTSL) (Toronto Research Chemical catalog no. O875000). The mixture was incubated for 15 h at 4 °C while protecting from light. The protein–MTSL mixture was passed through a PD-10 column to remove free MTSL.
Transverse 1H methyl PRE rates, 1HM-Γ2, were collected using established protocols34. Briefly, first transverse relaxation rates (1HM-R2) were acquired on paramagnetic (oxidized, MTSL active) and diamagnetic (reduced, MTSL inactive) samples of 100 μM sample of Ac-6-FP–ILVproS hpMR1–bβ2m–TAPBPRL30C-MTSL using a modified 2D methyl 1H-13C HMQC pulse sequence34 recorded at a 1H field of 600 MHz at 25 °C. Diamagnetic samples for PRE-measurements were prepared incubating the paramagnetic sample with 150mM ascorbic acid for 6 h at 25 °C followed by extensive dialysis back into NMR buffer (50 mM NaCl, 20 mM sodium phosphate pH 7.2, 10% D2O) to remove ascorbic acid. For both the paramagnetic and diamagnetic samples, multiple 2D spectra with varying relaxation delays (T=0, 6, 24, 36, 50 and 68 ms) were acquired. The change in NMR peak intensity was monitored as a function of the T delay and fit to a two-parameter single exponential function in NMRFAM-SPARKY to obtain 1HM-R2. Subsequently, 1HM-Γ2 rates were determined from the difference in 1HM-R2 between the paramagnetic and diamagnetic samples. Site-specific 1HM-Γ2 rates were converted to molecular distances from the proton in question to the paramagnetic MTSL center using the formula52:
where β (a constant comprising the nuclear gyromagnetic ratio, the electronic g factor, and the Bohr magneton) = 1.23 × 10−44 m6 s−2, ωH (the proton Larmor frequency) = 2π600 × 106 rad s−1 and τc (the rotational correlation time) = 48 ns for the MR1/TAPBPR complex.
MD simulations.
All-atom MD simulations in explicit solvent were carried in GROMACS v.2020.4 using the CHARMM36 force field and TPI3P water model. Simulations were set up using the CHARMM-GUI solution builder53. An integration time step of 2 fs was used with coordinates output every 10 ps. The LINCS algorithm was used to constrain H-bonds. The thermodynamic ensemble was nPT where temperature was kept constant at 298.15 K. Temperature was maintained using the Nosé–Hoover coupling method with a tau-t of 1 ps. For pressure coupling, an isotropic Parrinello–Rahman method with a tau-p of 5 ps and a compressibility of 4.5 × 10⁻⁵ bar−1 was used. Short range interactions were treated with a Verlet cutoff scheme with 10 Å electrostatic and van der Waals cutoffs and long-range electrostatics were treated using the particle mesh Ewald method. Periodic rectangular boundaries were used. Trajectories for each molecule were acquired for 100 or 200 ns. For MD simulations of unchaperoned MR1, RosettaCM models of hpMR1–bβ2m based on PDB ID 4GUP (6-FP–hMR1) or PDB ID 4PJ5 (Ac-6-FP–hMR1, TCR atoms removed) were used. For MD simulations of unchaperoned HLA-A*02:01, PDB ID 1DUZ (TAX9–HLA-A*02:01) was used. During simulations of empty hpMR1 and HLA-A*02:01, atoms corresponding to the bound ligand or peptide were removed before the start of the simulation.
For restrained MD, the representative hpMR1–bβ2m–TAPBPR model obtained from HADDOCK v.2.4 docking using NMR CSPs was input into CHARMM-GUI and the solution builder was used to generate the initial system for MD53. The PDB coordinates of unconjugated Ac-6-FP (taken from template PDB ID 4PJ5) or 6-FP (taken from template PDB ID 4GUP) were used to generate the topology and parameter files for the ligand using the CHARMM general force field using CHARMM-GUI (using the option generate ligand forcefield from PDB coordinate’). CHARMM-GUI was also used to add MTSL to TAPBPR L30C (using option Add MTS reagents: nitroxide spin labels option: CYR1 aka MTSL). PRE-restraints (Supplementary Table 5) were added to the end of the topology file (topol.top) with ±5 Å upper and lower bounds using the following nomenclature: [intermolecular_interactions][distance_restraints]; ai aj type index type’ low up1 up2 fac;; L6 HD2 - (ON from CYR1-30 aka MTSL from L30C) 59 6407 1 0 1 2.1 2.6 3.1 1.0.where ai is the MR1 atom number (from the.gro file), aj is the TAPBPRL30C-MTSL atom number, type is 1, index is the restraint number, type’ is set to 1 for time/ensemble-averaging, low/dis/up are the lower and upper bounds and distance restraints in nanometers and fac is the force constant is multiplied by 1. An additional harmonic distance constraint of 1.4 Å was applied between Ac-6-FP acceptor atom and K43 NZ donor atom to mimic formation of the Schiff base. All analyses of MD simulations were performed using GROMACS. The ten lowest-energy structures were selecting by using Rosetta’s score_jd2 protocol. A final round of refinement of the resulting models was carried out using Rosetta’s idealize and relax protocols using the following commands where loading of PDB components recognizes Ac-6-FP (PDB ligand ID 30W) or 6-FP (PDB ligand ID 6FP) and MTSL (PDB ligand ID 3X9):
$RosettaPath/idealize_jd2.mpi.linuxgccrelease-s *.pdb -load_PDB_componentsand
$RosettaPath/relax.mpi.linuxgccrelease -s *.pdb -ex1 -ex2 -ex1aro –ramady - load_PDB_components
1D 19F CPMG NMR experiments.
Following literature precedent54, we synthesized a fluorinated DCF analog, 19F-DCF. 1D 19F CPMG NMR experiments were performed using a previously described broadband pulse sequence (cpmgigsp_jb_2)37. Here, 500 μM 19F-DCF was present in all samples. The buffer system was 0.5% DMSO-d6 in 50 mM NaCl, 20 mM sodium phosphate pH 7.2, 10% D2O. For samples that contained MR1 or MHC-I, 5 μM of empty hpMR1–bβ2m or 5 μM of UV-irradiated HLA-A*02:01–hβ2m was used. For samples that contained TAPBPR, 10 μM wild-type or mutant TAPBPR was used. CPMG relaxation times of 80 ms (short) or 240 ms (long) were used: 90° excitation (BURBOP90cpmg) and 180° refocusing (BURBOP180cpmg) pulses were applied with a radio frequency amplitude of 20 kHz with pulse lengths of 600 μs and 1 ms, respectively. Acquisition parameters for all experiments were: 128 transients, center position −140 ppm, sweep width of 201.2 ppm, acquisition time of 0.5 s and recycle delay of 2 s. Data were acquired at 25 °C at a 1H field of 600 MHz. NMR signal intensities were integrated in Topspin 4. Rint values were obtained by NMR signal intensity ratios of the short/long CPMG times (Ishort/Ilong). T2app values were determined using the equation:
where ΔCPMG is the difference between the long and short CPMG times (240 – 80 ms).
Ligand buried surface area analysis.
Ligand buried surface areas were determined in PyMOL v.2.4 (Schrödinger, LLC) using available X-ray structures: 5-OP-RU (PDB ID 4PJ7, TCR removed), Ac-6-FP (PDB ID 4PJ5, TCR removed), DCF (PDB ID 5U1R, TCR removed), HMB (PDB ID 5U2V, TCR removed) and 2OH1NA (PDB ID 5U16, TCR removed). Dot_solvent was set to one for the solvent accessible surface area (SASA) mode. Buried ligand SASA was calculated was calculated using SASAfree ligand – SASAbound ligand.
Mass spectrometry.
LC–MS was carried out with passage of 500 nM purified hpMR1 complexes (prepared in 50:50 water/acetonitrile with 0.05% formic acid) through a Waters Acquity C8 column followed by electron ion spray–MS performed on a Waters Acquity UPLC SQD instrument. Analysis and deconvolution of LC–MS data were performed with MestReNova.
Extended Data
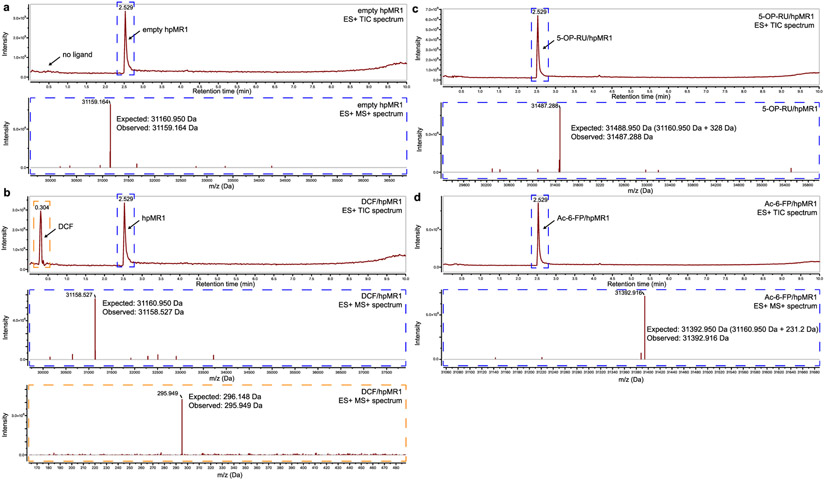
Extended Data Fig. 1 ∣. Mass spectroscopy characterization of empty and ligand bound hpMR1 states.
LC–MS analysis of purified a, empty hpMR1, b, DCF/hpMR1, c, 5-OP-RU/hpMR1, and d, Ac-6-FP/hpMR1 complexes. In each panel, the top graph shows the total ion chromatogram (TIC) while the bottom panel shows the deconvoluted m/z data (Da) of the selected TIC region highlighted in dotted boxes. The expected and observed molecular weights of each species are noted.
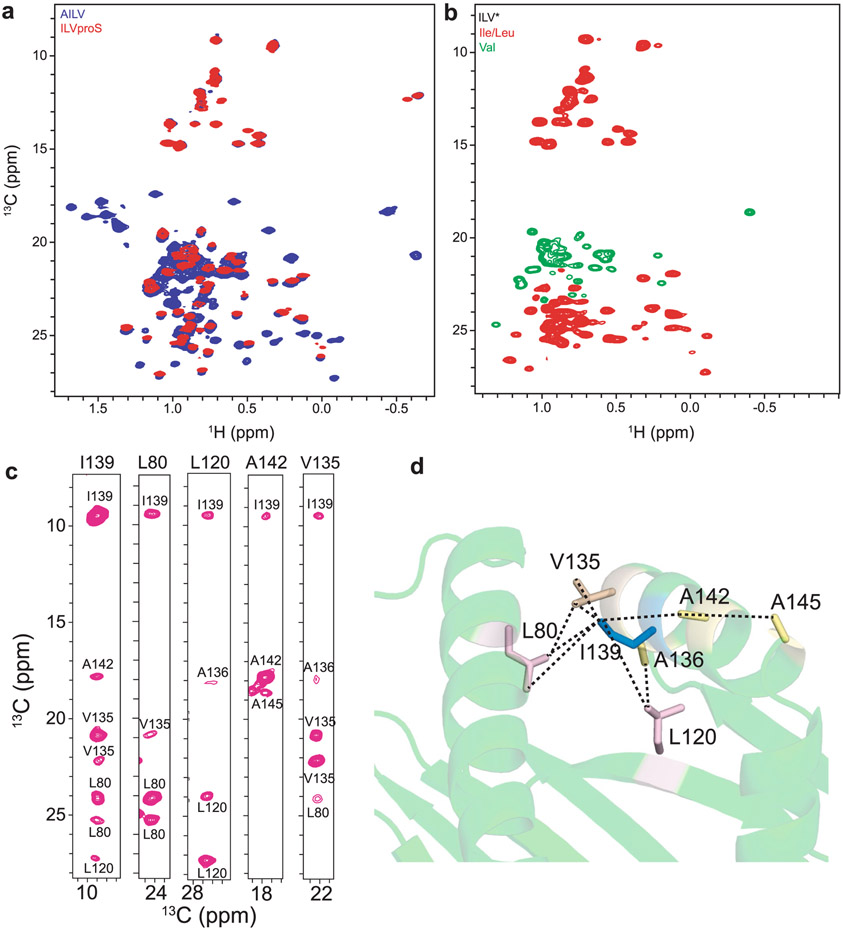
Extended Data Fig. 2 ∣. Complete chemical shift assignments of hpMR1 methyl resonances.
a, Comparison of 2D 1H-13C methyl HMQC spectra of AILV (250 μM) versus ILVproS (210 μM) labeled hpMR1 in complex with natural isotopic abundance Ac-6-FP and bβ2m recorded at a 1H field of 600 MHz at 25 °C. b, 2D 1H-13C methyl constant time HMQC spectra with a valine-selective decoupling pulse for ILV* (150 μM) labeled hpMR1 in complex with natural isotopic abundance Ac-6-FP and bβ2m recorded at a 1H field of 600 MHz at 25 °C. Unambiguous distinction between the isoleucine (red, −8 to 16 ppm), valine (green) and leucine (red) resonances is achieved. c, 2D 13C-13C strips showing observed intramolecular NOEs and their assignment taken from 3D CM-CMHM HMQC-NOESY-HMQC experiments using 300 msec mixing time recorded at a 1H field of 800 MHz at 25 °C. d, The methyl NOE network centered on I139 δ1 from the RosettaCM model of hpMR1/bβ2m (PDB template 4PJ5, TCR removed).
Extended Data Fig. 3 ∣. Chemical shift profiles of Ile 13Cδ1 labeled hpMR1 loaded with different ligands.
a, 2D 1H-13C methyl HMQC spectra of 10 μM Ile 13Cδ1-labeled hpMR1 with natural isotopic abundance bβ2m in the absence (empty, yellow) and presence of 2 mM ligand recorded at a 1H field of 600 MHz at 25 °C. All samples contain 0.5% DMSO-d6. b, Ile δ1 methyl groups (grey spheres) mapped onto the MR1 groove in complex with 6-FP (PDB ID 4GUP, red), 3FSA (PDB ID 5U6Q, black, TCR removed), or 2OH1NA (PDB ID 5U16, brown, TCR removed). c, Overlay of 2D 1H-13C methyl HMQC spectra of Ile δ1 labeled hpMR1 with natural isotopic abundance bβ2m. Samples were derived from in vitro refolding of the Ac-6-FP/Ile labeled hpMR1/bβ2m complex (blue) or from titration of empty Ile δ1 labeled hpMR1/bβ2m with 2 mM Ac-6-FP (red). Refolded and titrated spectra were recorded at 25 °C at a 1H field of 800 MHz and 600 MHz, respectively.
Extended Data Fig. 4 ∣. Ligand independence of the interaction between hpMR1 and TAPBPR by native gel shift assay.
a, Native gel shift analysis for empty hpMR1/bβ2m/TAPBPR and empty MHC-I/TAPBPR complex formation. Each lane is loaded with free TAPBPR, free UVirrad/MHC-I, free empty hpMR1/bβ2m, or 1:1 molar ratio mixture with TAPBPR. Asterisk (*) denote complex formation. b, Native gel shift analysis where each lane is loaded with free TAPBPR, free hpMR1/bβ2m without (empty) or with ligands, or 1:1 mixtures with TAPBPR. Ligand/hpMR1 complexes were prepared by in vitro refolding as described in the main text. c, Quantification of the % of hpMR1/bβ2m/TAPBPR complexes formed in the presence of different ligands, relative to the free MR1 band, based on native gel electrophoresis and band quantification using ImageJ. Data are mean ± SD for n = 3 technical replicates.
Extended Data Fig. 5 ∣. Constructs for interaction of properly conformed MHC-I with TAPBPR.
a, Representative SPR sensorgram for varying concentrations of UV-irradiated HLA-A*01:01/hβ2m flowed over a streptavidin chip coupled with TAPBPRWT-biotin. RU = response units. b, Clustal Omega v1.2.4 alignment of HLA-A*02:01 peptides used in this study, processed using ESPript v3. Residues in red box, white character represent strict identity. Residues in red character represent similar group amino acids. c, In silico prediction of peptide binding to HLA-A*02:01 using netMHCpan-v4.1. d, Normalized DSF traces of purified empty and peptide-loaded loaded HLA-A*02:01/hβ2m. Fitted thermal stabilities (Tm, °C) are noted. Data are mean ± SD for n = 3 technical replicates. e, Summary of DSF determined thermal stability (Tm, °C) of empty (UVirrad) or peptide-loaded HLA-A*02:01/hβ2m complexes. Data are mean ± SD for n = 3 technical replicates. f, Representative SPR sensorgrams for varying concentrations of non-UV irradiated M89-97/HLA-A*02:01/hβ2m, TH/HLA-A*02:01/hβ2m, or NY-ESO-1/HLA-A*02:01/hβ2m flowed over a streptavidin chip coupled with TAPBPRWT-biotin. The concentration of analyte for the top sensorgram is noted. Fits from surface bound analysis are shown with dotted red lines. Data are mean ± SD for n = 3 technical replicates.
Extended Data Fig. 6 ∣. Ligand independence of the interaction between hpMR1 and TAPBPR by SPR.
a, SPR sensorgrams of varying concentrations of empty or ligand loaded hpMR1/bβ2m flowed over a streptavidin chip coupled with TAPBPRWT-biotin. The analyte concentrations are noted on the first three sensorgrams and are the same for every experiment. b, SPR sensorgrams of varying concentrations of Ac-6-FP loaded hMR1/hβ2m wild-type or hMR1 C262S/hβ2m flowed over a streptavidin chip coupled with TAPBPR-biotin. The analyte concentrations are noted on the sensorgram. The RU vs hMR1 concentration is also shown with fitting shown in the dotted lines. Data are mean ± SD for n = 3 technical replicates. The C262S mutation is a Cys->Ser mutation for the free hMR1 Cys on the α3 domain.
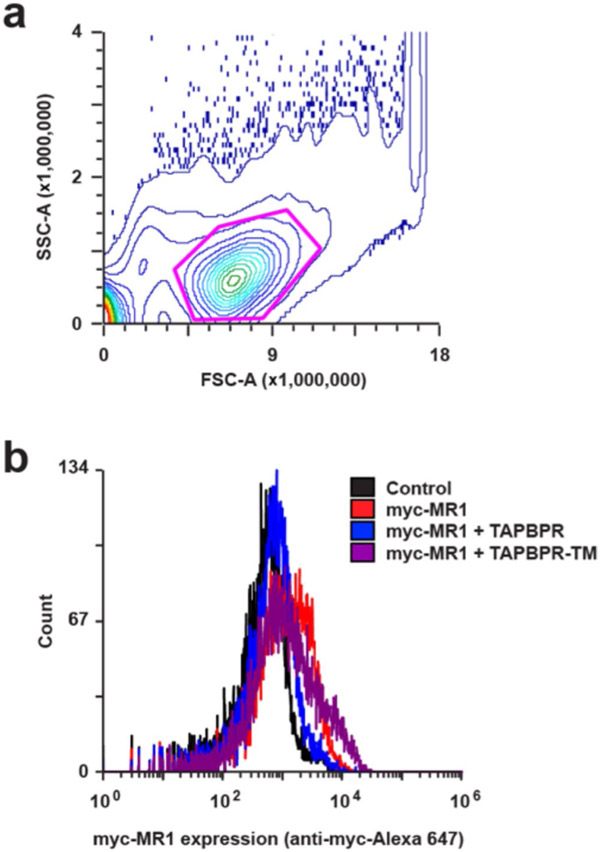
Extended Data Fig. 7 ∣. Flow cytometry analysis of indirect effects of TAPBPR on surface trafficking of MR1.
a, Expi293F cells were gated by FSC-SSC for the main cell population (magenta gate, ~60% of all events). b, Expi293F cells transfected with myc-tagged MR1 and FLAG-tagged TAPBPR were stained with anti-myc-Alexa 647 for surface MR1. For quantification of changes in myc-MR1 surface levels, the mean fluorescence for control (vector only) cells (black) was subtracted from the mean fluorescence of each sample.
Extended Data Fig. 8 ∣. The TAPBPR G24-R36 loop does not interact with the MR1 groove.
a, Surface representation of the groove of Ac-6-FP loaded MR1 (PDB ID 4PJ5, TCR removed) showing the open A’ pocket and closed F’ pocket. Ac-6-FP is shown as magenta spheres, MR1 is shown as a green surface. b, Plot of response units (RU) from SPR sensorgrams of varying concentrations of empty or Ac-6-FP loaded hpMR1/bβ2m flowed over a streptavidin chip coupled with TAPBPRWT-biotin (black) or TAPBPRΔG24-R36-biotin (red). The dotted lines indicate fits. Data are the mean±SD for n = 3 technical replicates. c, 2D 1H-13C methyl HMQC spectra of 100 μM Ac-6-FP/ILVproS labeled hpMR1/bβ2m in complex with TAPBPRWT (blue) or TAPBPRΔG24-R36 (red) recorded at a 1H field of 600 MHz at 25 °C. d, Comparison of chemical shift perturbation (CSP, ΔδCH3, ppm) analysis for residues of hpMR1 upon complex formation with TAPBPRWT versus TAPBPRΔG24-R36. CSPs plotted onto a RosettaCM model of hpMR1/bβ2m (PDB template 4PJ5, TCR removed). Methyl bearing residues affected for hpMR1 upon binding to TAPBPRWT (top) or TAPBPRΔG24-R36 (bottom) are shown in warm pink and unaffected residues in grey. hpMR1 and Ac-6-FP are colored green and magenta, respectively. e, and f, Structural models of the role of the TAPBPR G24-R36 loop for chaperone interactions with (e) Ac-6-FP/hpMR1 and (f) TAX9/HLA-A*02:01.
Extended Data Fig. 9 ∣. Measurement of 1HM-Γ2 PRE rates in the 89 kDa MR1/TAPBPR complex.
a, Melting temperature (Tm, °C) of TAPBPRWT (black) and TAPBPRL30C-MTSL (grey) obtained from differential scanning fluorimetry experiments. Data are mean ± SD for n = 3 technical replicates. b, 2D 1H-13C methyl HMQC spectra of 100 μM Ac-6-FP/ILVproS labeled hpMR1/bβ2m in complex with TAPBPRL30C-MTSL in the oxidized (paramagnetic, blue) or reduced (diamagnetic, red) state recorded at a 1H field of 600 MHz at 25 °C. Dotted boxes highlight a subset of the methyl resonances affected upon reduction of TAPBPRL30C-MTSL by ascorbic acid. c, Position of representative ILVproS methyl groups analyzed in panel d shown on the RosettaCM model of hpMR1 (PDB template 4PJ5, TCR removed). d, TAPBPRL30C-MTSL was complexed with Ac-6-FP/ILVproS hpMR1/bβ2m and 1HM R2 values were measured for oxidized (paramagnetic, blue) and reduced (diamagnetic, red) samples by recording a series of 2D methyl 1H-13C HMQC spectra and analyzing the NMR peak intensity as a function of a varied transverse relaxation delay (0, 6, 24, 36, 50 and 68 msec). The decay profiles for selected 1H methyl groups of L10 δ2, V28 γ2, I96 δ1 and L246 δ2 of hpMR1 are shown. A summary of all measured 1HM-Γ2 PRE rates is shown in Supplementary Table 5.
Extended Data Fig. 10 ∣. Comparison of the molecular interfaces of the TAPBPR bound MR1 versus MHC-I.
a, Interactions at the (Left) H2-Dd or (Right) hpMR1 α1/α2 interface with TAPBPR (TAPBPR in grey, H2-Dd or hpMR1 in green). The H2-Dd/TAPBPR interaction is shown for PDB ID 5WER, while the hpMR1/TAPBPR interaction is shown for the lowest energy hybrid NMR/MD model. Interacting residues are shown as sticks. b, Interactions at the (Left) H2-Dd or (Right) hpMR1 α3/β2m interface with TAPBPR (TAPBPR in grey, H2-Dd or hpMR1 in green; β2m in cyan). The H2-Dd/TAPBPR interaction is shown for PDB ID 5WER, while the hpMR1/TAPBPR interaction is shown for the lowest energy hybrid NMR/MD model. Interacting residues are shown as sticks. c, Overlay of Ac-6-FP in the hpMR1 groove for the TAPBPR chaperoned state (green, PDB 7RNO) versus Ac-6-FP in the hMR1 groove for the unchaperoned state (PDB ID 4PJ5, TCR removed). d, Structural overlays of unchaperoned 6-FP/hMR1 (PDB ID 4GUP, orange) compared with hybrid NMR/MD refined structures of Ac-6-FP/hpMR1/TAPBPR built using PDB ID 4PJ5, TCR removed (green) or 6-FP/hpMR1/TAPBPR built using PDB ID 4GUP (blue). The Cα RMSD between the green and blue structures is 1.769 Å.
Supplementary Material
Acknowledgements
This research was supported through grants by the National Institute of Allergy and Infectious Diseases (NIAID) (no. 5R01AI143997) and NIGMS (no. 5R35GM125034) to N.G.S., grant no R35GM142505 to G.M.B. and NIGMS grant no. 3R35GM125034-05S to N.G.S. that funded a cryoprobe-equipped 600 MHz NMR spectrometer at UPenn. We acknowledge K. Natarajan and D. Margulies (NIAID) for helpful discussions, E. Adams (University of Chicago) for providing DNA plasmids for hpMR1, hMR1, hMR1 C262S and bβ2m as well as the 5-N-RU precursor compound. We thank J.P. Brady (Novartis) for providing the broadband 19F CPMG pulse sequence. We further acknowledge J. Cassel (Wistar Institute), A. Majumdar (Johns Hopkins University) and H. Roder/Takuya Mizukami (Fox Chase Cancer Center) for assistance with instrumentation and scheduling.
Footnotes
Online content
Any methods, additional references, Nature Research reporting summaries, source data, extended data, supplementary information, acknowledgements, peer review information; details of author contributions and competing interests; and statements of data and code availability are available at https://doi.org/10.1038/s41589-022-01049-9.
Reporting summary. Further information on research design is available in the Nature Research Reporting Summary linked to this article.
Competing interests
E.P. is an employee of Cyrus Biotechnology. N.G.S. is a cofounder of Tantigen Bio, Inc., MultiplexThera, Inc. and a named inventor on patents concerning the preparation of ligand-receptive MHC-I and MHC-like molecules; all companies had no role in this study. The other authors declare no competing interests.
Extended data are available for this paper at https://doi.org/10.1038/s41589-022-01049-9.
Supplementary information The online version contains supplementary material available at https://doi.org/10.1038/s41589-022-01049-9.
Data availability
Plasmids have been deposited to Addgene with accession IDs 178603, 178645, 178650 and 178653. NMR methyl resonance assignments of the free and TAPBPR-bound states of hpMR1 have been deposited into the Biological Magnetic Resonance Data Bank (https://bmrb.io/) under accession numbers 51044, 51045 and 51046. The atomic coordinates for the ten lowest-energy structures of the Ac-6-FP–hpMR1–bβ2m–TAPBPR complex have been deposited in the PDB (https://www.rcsb.org/) under the PDB ID 7RNO. The following PDB IDs for previously solved structures were also used in this study: 4GUP, 4PJ5, 1DUZ, 4PJ7, 5U1R, 5U2V, 5U16, 5WER, 6W9V and 6ENY. Source data for Figs. 4 and 5 and Extended Data Fig. 4 are provided with this paper. Other data are available from the corresponding author upon reasonable request.
References
- 1.Blum JS, Wearsch PA & Cresswell P Pathways of antigen processing. Annu. Rev. Immunol 31, 443–473 (2013). [DOI] [PMC free article] [PubMed] [Google Scholar]
- 2.Corbett AJ, Awad W, Wang H & Chen Z Antigen recognition by MR1-reactive T cells; MAIT cells, metabolites, and remaining mysteries. Front. Immunol 11, 1961 (2020). [DOI] [PMC free article] [PubMed] [Google Scholar]
- 3.Crowther MD et al. Genome-wide CRISPR–Cas9 screening reveals ubiquitous T cell cancer targeting via the monomorphic MHC class I-related protein MR1. Nat. Immunol 21, 178–185 (2020). [DOI] [PMC free article] [PubMed] [Google Scholar]
- 4.Chen Z et al. Mucosal-associated invariant T-cell activation and accumulation after in vivo infection depends on microbial riboflavin synthesis and co-stimulatory signals. Mucosal Immunol. 10, 58–68 (2017). [DOI] [PubMed] [Google Scholar]
- 5.Rouxel O et al. Cytotoxic and regulatory roles of mucosal-associated invariant T cells in type 1 diabetes. Nat. Immunol 18, 1321–1331 (2017). [DOI] [PMC free article] [PubMed] [Google Scholar]
- 6.Kjer-Nielsen L et al. MR1 presents microbial vitamin B metabolites to MAIT cells. Nature 491, 717–723 (2012). [DOI] [PubMed] [Google Scholar]
- 7.Salio M et al. Ligand-dependent downregulation of MR1 cell surface expression. Proc. Natl Acad. Sci. USA 117, 10465–10475 (2020). [DOI] [PMC free article] [PubMed] [Google Scholar]
- 8.Keller AN et al. Drugs and drug-like molecules can modulate the function of mucosal-associated invariant T cells. Nat. Immunol 18, 402–411 (2017). [DOI] [PubMed] [Google Scholar]
- 9.Corbett AJ et al. T-cell activation by transitory neo-antigens derived from distinct microbial pathways. Nature 509, 361–365 (2014). [DOI] [PubMed] [Google Scholar]
- 10.Lepore M et al. Functionally diverse human T cells recognize non-microbial antigens presented by MR1. eLife 6, e24476 (2017). [DOI] [PMC free article] [PubMed] [Google Scholar]
- 11.Boyle LH et al. Tapasin-related protein TAPBPR is an additional component of the MHC class I presentation pathway. Proc. Natl Acad. Sci. USA 110, 3465–3470 (2013). [DOI] [PMC free article] [PubMed] [Google Scholar]
- 12.Hermann C, Strittmatter LM, Deane JE & Boyle LH The binding of TAPBPR and tapasin to MHC class I is mutually exclusive. J. Immunol 191, 5743–5750 (2013). [DOI] [PMC free article] [PubMed] [Google Scholar]
- 13.McShan AC et al. Peptide exchange on MHC-I by TAPBPR is driven by a negative allostery release cycle. Nat. Chem. Biol 14, 811–820 (2018). [DOI] [PMC free article] [PubMed] [Google Scholar]
- 14.Jiang J et al. Crystal structure of a TAPBPR-MHC I complex reveals the mechanism of peptide editing in antigen presentation. Science 358, 1064–1068 (2017). [DOI] [PMC free article] [PubMed] [Google Scholar]
- 15.Thomas C & Tampé R Structure of the TAPBPR-MHC I complex defines the mechanism of peptide loading and editing. Science 358, 1060–1064 (2017). [DOI] [PubMed] [Google Scholar]
- 16.McShan AC et al. Molecular determinants of chaperone interactions on MHC-I for folding and antigen repertoire selection. Proc. Natl Acad. Sci. USA 116, 25602–25613 (2019). [DOI] [PMC free article] [PubMed] [Google Scholar]
- 17.Lan H et al. Exchange catalysis by tapasin exploits conserved and allele-specific features of MHC-I molecules. Nat. Commun 12, 4236 (2021). [DOI] [PMC free article] [PubMed] [Google Scholar]
- 18.McShan AC et al. TAPBPR promotes antigen loading on MHC-I molecules using a peptide trap. Nat. Commun 12, 3174 (2021). [DOI] [PMC free article] [PubMed] [Google Scholar]
- 19.Ilca FT et al. TAPBPR mediates peptide dissociation from MHC class I using a leucine lever. eLife 7, e40126 (2018). [DOI] [PMC free article] [PubMed] [Google Scholar]
- 20.Sagert L, Hennig F, Thomas C & Tampé R A loop structure allows TAPBPR to exert its dual function as MHC I chaperone and peptide editor. eLife 9, e55326 (2020). [DOI] [PMC free article] [PubMed] [Google Scholar]
- 21.Kulicke C, Karamooz E, Lewinsohn D & Harriff M Covering all the bases: complementary MR1 antigen presentation pathways sample diverse antigens and intracellular compartments. Front. Immunol 11, 2034 (2020). [DOI] [PMC free article] [PubMed] [Google Scholar]
- 22.McWilliam HEG et al. The intracellular pathway for the presentation of vitamin B-related antigens by the antigen-presenting molecule MR1. Nat. Immunol 17, 531–537 (2016). [DOI] [PubMed] [Google Scholar]
- 23.McWilliam H et al. Endoplasmic reticulum chaperones stabilize ligand-receptive MR1 molecules for efficient presentation of metabolite antigens. Proc. Natl Acad. Sci. USA 117, 24985–24985 (2020). [DOI] [PMC free article] [PubMed] [Google Scholar]
- 24.Harriff MJ et al. MR1 displays the microbial metabolome driving selective MR1-restricted T cell receptor usage. Sci. Immunol 3, eaao2556 (2018). [DOI] [PMC free article] [PubMed] [Google Scholar]
- 25.Eckle SBG et al. A molecular basis underpinning the T cell receptor heterogeneity of mucosal-associated invariant T cells. J. Exp. Med 211, 1585–1600 (2014). [DOI] [PMC free article] [PubMed] [Google Scholar]
- 26.Kurimoto E et al. Structural and functional mosaic nature of MHC class I molecules in their peptide-free form. Mol. Immunol 55, 393–399 (2013). [DOI] [PubMed] [Google Scholar]
- 27.Morozov GI et al. Interaction of TAPBPR, a tapasin homolog, with MHC-I molecules promotes peptide editing. Proc. Natl Acad. Sci. USA 113, E1006–E1015 (2016). [DOI] [PMC free article] [PubMed] [Google Scholar]
- 28.Khan AR, Baker BM, Ghosh P, Biddison WE & Wiley DC The structure and stability of an HLA-A*0201/octameric tax peptide complex with an empty conserved peptide-N-terminal binding site. J. Immunol 164, 6398–6405 (2000). [DOI] [PubMed] [Google Scholar]
- 29.Rodenko B et al. Generation of peptide-MHC class I complexes through UV-mediated ligand exchange. Nat. Protoc 1, 1120–1132 (2006). [DOI] [PubMed] [Google Scholar]
- 30.Casey JR, Grinstein S & Orlowski J Sensors and regulators of intracellular pH. Nat. Rev. Mol. Cell Biol 11, 50–61 (2010). [DOI] [PubMed] [Google Scholar]
- 31.Wieczorek M et al. Major histocompatibility complex (MHC) class I and MHC class II proteins: conformational plasticity in antigen presentation. Front. Immunol 8, 292 (2017). [DOI] [PMC free article] [PubMed] [Google Scholar]
- 32.Ilca FT, Neerincx A, Wills MR, de la Roche M & Boyle LH Utilizing TAPBPR to promote exogenous peptide loading onto cell surface MHC I molecules. Proc. Natl Acad. Sci. USA 115, E9353–E9361 (2018). [DOI] [PMC free article] [PubMed] [Google Scholar]
- 33.van Zundert GCP et al. The HADDOCK2.2 web server: user-friendly integrative modeling of biomolecular complexes. J. Mol. Biol 428, 720–725 (2016). [DOI] [PubMed] [Google Scholar]
- 34.Venditti V, Fawzi NL & Clore GM Automated sequence- and stereo-specific assignment of methyl-labeled proteins by paramagnetic relaxation and methyl–methyl nuclear Overhauser enhancement spectroscopy. J. Biomol. NMR 51, 319–328 (2011). [DOI] [PMC free article] [PubMed] [Google Scholar]
- 35.Dedmon MM, Lindorff-Larsen K, Christodoulou J, Vendruscolo M & Dobson CM Mapping long-range interactions in alpha-synuclein using spin-label NMR and ensemble molecular dynamics simulations. J. Am. Chem. Soc 127, 476–477 (2005). [DOI] [PubMed] [Google Scholar]
- 36.Gong Z, Schwieters CD & Tang C Theory and practice of using solvent paramagnetic relaxation enhancement to characterize protein conformational dynamics. Methods 148, 48–56 (2018). [DOI] [PMC free article] [PubMed] [Google Scholar]
- 37.Lingel A et al. Comprehensive and high-throughput exploration of chemical space using broadband 19F NMR-based screen. Angew. Chem. Int. Ed. Engl 59, 14809–14817 (2020). [DOI] [PubMed] [Google Scholar]
- 38.Berg H et al. NMR-based fragment screening in a minimum sample but maximum automation mode. J. Vis. Exp 172, e362262 (2021). [DOI] [PubMed] [Google Scholar]
- 39.Miley MJ et al. Biochemical features of the MHC-related protein 1 consistent with an immunological function. J. Immunol 170, 6090–6098 (2003). [DOI] [PubMed] [Google Scholar]
- 40.Blees A et al. Structure of the human MHC-I peptide-loading complex. Nature 551, 525–528 (2017). [DOI] [PubMed] [Google Scholar]
- 41.Lehnert E et al. Antigenic peptide recognition on the human ABC transporter TAP resolved by DNP-enhanced solid-state NMR spectroscopy. J. Am. Chem. Soc 138, 13967–13974 (2016). [DOI] [PubMed] [Google Scholar]
- 42.Howson LJ et al. Absence of mucosal-associated invariant T cells in a person with a homozygous point mutation in MR1. Sci. Immunol 5, eabc9492 (2020). [DOI] [PMC free article] [PubMed] [Google Scholar]
- 43.Neerincx A & Boyle LH Preferential interaction of MHC class I with TAPBPR in the absence of glycosylation. Mol. Immunol 113, 58–66 (2018). [DOI] [PMC free article] [PubMed] [Google Scholar]
- 44.Fisette O, Schröder GF & Schäfer LV Atomistic structure and dynamics of the human MHC-I peptide-loading complex. Proc. Natl Acad. Sci. USA 117, 20597–20606 (2020). [DOI] [PMC free article] [PubMed] [Google Scholar]
- 45.Rock KL, Reits E & Neefjes J Present yourself! By MHC Class I and MHC Class II molecules. Trends Immunol. 37, 724–737 (2016). [DOI] [PMC free article] [PubMed] [Google Scholar]
- 46.Nerli S, De Paula VS, McShan AC & Sgourakis NG Backbone-independent NMR resonance assignments of methyl probes in large proteins. Nat. Commun 12, 691 (2021). [DOI] [PMC free article] [PubMed] [Google Scholar]
- 47.Behera SP et al. Nearest-neighbor NMR spectroscopy: categorizing spectral peaks by their adjacent nuclei. Nat. Commun 11, 5547 (2020). [DOI] [PMC free article] [PubMed] [Google Scholar]
- 48.Rossi P, Xia Y, Khanra N, Veglia G & Kalodimos CG 15N and 13C-SOFAST-HMQC editing enhances 3D-NOESY sensitivity in highly deuterated, selectively [1H,13C]-labeled proteins. J. Biomol. NMR 66, 259–271 (2016). [DOI] [PMC free article] [PubMed] [Google Scholar]
- 49.Delaglio F et al. NMRPipe: a multidimensional spectral processing system based on UNIX pipes. J. Biomol. NMR 6, 277–293 (1995). [DOI] [PubMed] [Google Scholar]
- 50.Lee W, Tonelli M & Markley JL NMRFAM-SPARKY: enhanced software for biomolecular NMR spectroscopy. Bioinforma. 31, 1325–1327 (2015). [DOI] [PMC free article] [PubMed] [Google Scholar]
- 51.Sjodt M & Clubb RT Nitroxide labeling of proteins and the determination of paramagnetic relaxation derived distance restraints for NMR. Stud. Bio-Protoc 7, e2207 (2017). [DOI] [PMC free article] [PubMed] [Google Scholar]
- 52.Rosenzweig R, Moradi S, Zarrine-Afsar A, Glover JR & Kay LE Unraveling the mechanism of protein disaggregation through a ClpB-DnaK interaction. Science 339, 1080–1083 (2013). [DOI] [PubMed] [Google Scholar]
- 53.Lee J et al. CHARMM-GUI input generator for NAMD, GROMACS, AMBER, OpenMM, and CHARMM/OpenMM simulations using the CHARMM36 additive force field. J. Chem. Theory Comput 12, 405–413 (2016). [DOI] [PMC free article] [PubMed] [Google Scholar]
- 54.Moser P, Sallmann A & Wiesenberg I Synthesis and quantitative structure-activity relationships of diclofenac analogues. J. Med. Chem 33, 2358–2368 (1990). [DOI] [PubMed] [Google Scholar]
Associated Data
This section collects any data citations, data availability statements, or supplementary materials included in this article.
Supplementary Materials
Data Availability Statement
Plasmids have been deposited to Addgene with accession IDs 178603, 178645, 178650 and 178653. NMR methyl resonance assignments of the free and TAPBPR-bound states of hpMR1 have been deposited into the Biological Magnetic Resonance Data Bank (https://bmrb.io/) under accession numbers 51044, 51045 and 51046. The atomic coordinates for the ten lowest-energy structures of the Ac-6-FP–hpMR1–bβ2m–TAPBPR complex have been deposited in the PDB (https://www.rcsb.org/) under the PDB ID 7RNO. The following PDB IDs for previously solved structures were also used in this study: 4GUP, 4PJ5, 1DUZ, 4PJ7, 5U1R, 5U2V, 5U16, 5WER, 6W9V and 6ENY. Source data for Figs. 4 and 5 and Extended Data Fig. 4 are provided with this paper. Other data are available from the corresponding author upon reasonable request.


