Abstract
Background:
Machine learning may enhance prediction of outcomes after coronary artery bypass grafting (CABG). We sought to develop and validate a dynamic machine learning model to predict CABG outcomes at clinically relevant pre- and postoperative timepoints.
Methods:
The Society of Thoracic Surgeons (STS) registry data elements from 2,086 isolated CABG patients were divided into training and testing datasets and input into XGBoost decision-tree machine learning algorithms. Two prediction models were developed based on data from the pre- (80 parameters) and postoperative (125 parameters) phases of care. Outcomes included operative mortality, major morbidity or mortality, high-cost, and 30-day readmission. Machine learning and STS model performance was assessed using accuracy and the area under the precision-recall curve (AUC-PR).
Results:
Preoperative machine learning models predicted mortality (Accuracy=98%; AUC-PR=0.16; F1=0.24), major morbidity or mortality (Accuracy =75%; AUC-PR=0.33; F1=0.42), high cost (Accuracy =83%; AUC-PR=0.51; F1=0.52), and 30-day readmission (Accuracy =70%; AUC-PR=0.47; F1=0.49) with high accuracy. Preoperative machine learning models performed similar to the STS for prediction of mortality (STS AUC-PR=0.11;p=0.409) and outperformed STS for prediction of mortality or major morbidity (STS AUC-PR=0.28;p<0.001). Addition of intraoperative parameters further improved machine learning model performance for major morbidity or mortality (AUC-PR=0.39;p<0.01) and high cost (AUC-PR=0.64;p<0.01), with cross-clamp and bypass times emerging as important additive predictive parameters.
Conclusions:
Machine learning can predict mortality, major morbidity, high cost, and readmission after isolated CABG. Prediction based on the phase of care allows for dynamic risk assessment through the hospital course, which may benefit quality assessment and clinical decision making.
Graphical Abstract
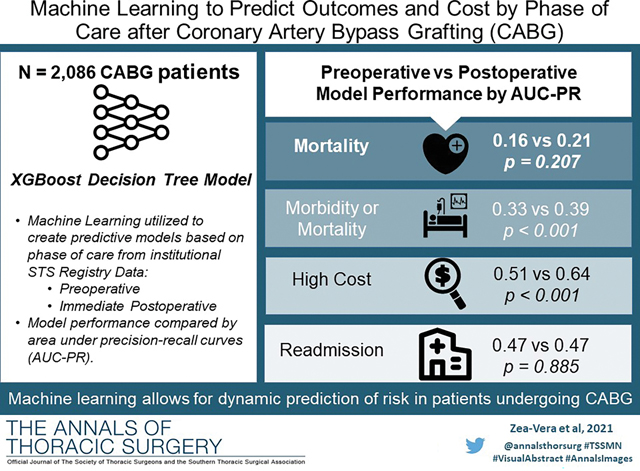
Coronary artery bypass graft (CABG) is the most frequently performed cardiac operation, however, significant variability exists in outcomes at a national level. Multiple highly sophisticated models have been developed to guide clinical decision making; these include the Society of Thoracic Surgeons (STS) Predicted Risk of Mortality (PROM) and the EUROSCORE II.(1,2) These models use a large number of patient-level datapoints and apply sophisticated logistic regression statistics to predict postoperative outcomes based on preoperative datapoints. These calculators have been widely validated and remain the gold standard for risk prediction.(3)
Machine learning (ML) is a branch of artificial intelligence which can identify linear and non-linear patterns across input parameters which contribute to output class results.(6) In healthcare, one of its applications is evaluating clinical data for previously unknown or complex interactions between clinical data parameters contributing to a predicted outcome. ML algorithms can ingest large patient datasets to predict an outcome and support enhanced data insights to better risk-stratify patients.. Previous studies that have applied ML algorithms to predict outcomes after cardiac surgery suggest that ML may be better than current models.(4,5) As such, ML is currently being evaluated by cardiothoracic surgical societies for application to national databases in order to enable more accurate prediction of outcomes.(6,7)
Moreover, ML has the potential to continuously “learn”, and when coupled with high-performance computing power, may enable continuously evolving risk models capable of providing institution and surgeon-specific risk. Furthermore, ML algorithms may allow for a dynamic risk prediction throughout the different phases of clinical care (i.e. preoperative, operative, intensive care unit, floor, and discharge). However, current clinical calculators only provide preoperative risk estimates. A dynamic phase of care clinical risk calculator may allow for more appropriate deployment of resources and aid in clinical decision making.
The objective of this study was to develop and validate a decision-tree based ML algorithm that could predict patient outcomes after CABG. We evaluated performance of prediction for post-CABG mortality, major morbidity or mortality, cost, and readmission. We further evaluated performance at different phases of clinical care.
Patients and Methods
This study was approved by the Baylor College of Medicine Institutional Review Board (H-44702) and informed consent was waived.
Study Population
The algorithm was trained and tested using preoperative and operative parameters of patients within the Baylor College of Medicine STS Adult Cardiac Surgery Database who underwent isolated CABG between 2015–2020 (n=2,086). Patient records were linked to cost, utilizing financial billing records for each hospitalization and hospital cost-to-charge ratios. This dataset included relevant patient demographics, comorbidities, laboratory values, operative, and outcome data as delineated by the STS Adult Cardiac Surgery database definitions versions 2.81 and 2.9.
Tables 1, 2 and Supplemental Table 1 describe the pre- and operative characteristics of the population. The mean age at the time of surgery was 65±10 years, and 514 patients (25%) were female. Median 3 distal anastomoses were performed with median bypass and cross-clamp times of 69 and 40 minutes.
Table 1.
Patient Demographics and Comorbidities
| Parameter | Overall N=2,086 |
|---|---|
|
| |
| Age | 65(59–72) |
| Female Gender | 514(24.6%) |
| Urgency of Procedure | |
| Elective | 719(37.9%) |
| Urgent | 1,240(59.4%) |
| Emergent/Salvage | 55(2.6%) |
| Diabetes | 1,170(56.1%) |
| Dyslipidemia | 1,886(91.4%) |
| ESRD on dialysis | 156(7.5%) |
| Hypertension | 1,949(93.5%) |
| Congestive heart failure | 637(30.5%) |
| Left Ventricular Ejection Fraction | 55%(45–60) |
| Liver disease | 139(6.7%) |
| Peripheral vascular disease | 290(14.0%) |
| Cerebrovascular Disease | 457(21.9%) |
| Preoperative Laboratory Values | |
| Hematocrit | 39.7(35.2–43.0) |
| White Blood Cell Count | 7.5(6.2–9.1) |
| Platelets (thousands) | 209(172–249) |
| Creatinine | 1.0(0.8–1.2) |
| INR | 1.1(1.0–1.1) |
| Hemoglobin A1c | 6.3(5.6–7.6) |
ESRD: End stage renal disease, INR: International normalized ratio. Categorical variables reported as frequency and percentage, continuous variables reported as median and interquartile range.
Table 2:
Operative Characteristics
| Operative Parameter | Overall N=2,086 |
|---|---|
|
| |
| Number of distal anastomoses | 3(2–4) |
| Cardiopulmonary bypass time(min) | 69(46–110) |
| Aortic cross-clamp time(min) | 40(27–69) |
| Lowest intraoperative hematocrit(g/dL) | 25(21–29) |
| Lowest intraoperative temperature(C) | 31(30–34) |
| Highest intraoperative glucose(mg/dL) | 199(160–244) |
| Received intraoperative blood transfusion | 879(42.5%) |
Data reported in frequency(%) and median(interquartile range), as appropriate.
Predictive Outcomes
The primary outcomes were operative mortality, major morbidity or mortality, high total hospitalization cost, and 30-day readmission. Predictive models were developed at two clinically relevant timepoints corresponding to distinct phases of care. The Preoperative Phase of Care model consisted of parameters that were only available to the clinician immediately preoperatively. The postoperative Phase of Care model consisted of parameters available upon admission to the intensive care unit (ICU) after surgery. Mortality was defined as in-hospital or 30-day out of hospital mortality per STS definitions. Major morbidity was defined as reoperations for any cardiac reason, renal failure, deep sternal wound infection, prolonged ventilation/intubation, or cerebrovascular accident/permanent stroke. Patients were classified as high cost if total patient care cost including hospitalization cost was above the 75th percentile, which was $48,667 for this cohort. Readmission was defined as any readmission within 30 days of discharge.
ML Input Parameter Selection for Phases of Clinical Care
For the Preoperative Phase of Care model, all preoperative data parameters (STS data elements 50–1855 in Ver 2.81 and Ver 2.9) were included. For the postoerative Phase of Care model, all operative parameters (STS data elements 1960–2710 in Ver 2.81 and Ver 2.9) were added to the available model parameters (Supplemental Table 2). When less than 50% of patients had available data for a parameter, the parameter was excluded.(8,9) The parameters with similar clinical significance were merged. These input parameter exclusion criteria reduced the available parameters to 80 preoperative and 45 operative parameters. This resulted in 80 and 125 parameters for the pre- and postoperative models, respectively.
Model Development
Multiple classification models have been applied to healthcare outcomes. Some other common models are support vector machines, artificial neural networks, and random forest algorithms.(10,11) For this analysis, an Extreme Gradient Boosting (XGBoost) algorithm was utilized. This is an ensemble tree method that supports the identification of both linear and nonlinear data patterns in the datasets. Imbalanced cross-validation capabilities are integrated into XGBoost and the algorithm offers the ability to tune and optimize a range of hyperparameters, i.e. model parameters that are not derived from underlying data but can be set to control the learning process. Additionally, XGBoost has an advantage in that it is computationally efficient, handles missing data effectively, and provides both a probability output as well as insight into the importance of each parameter. Figure 1 provides an overview of the process performed.
Figure 1.
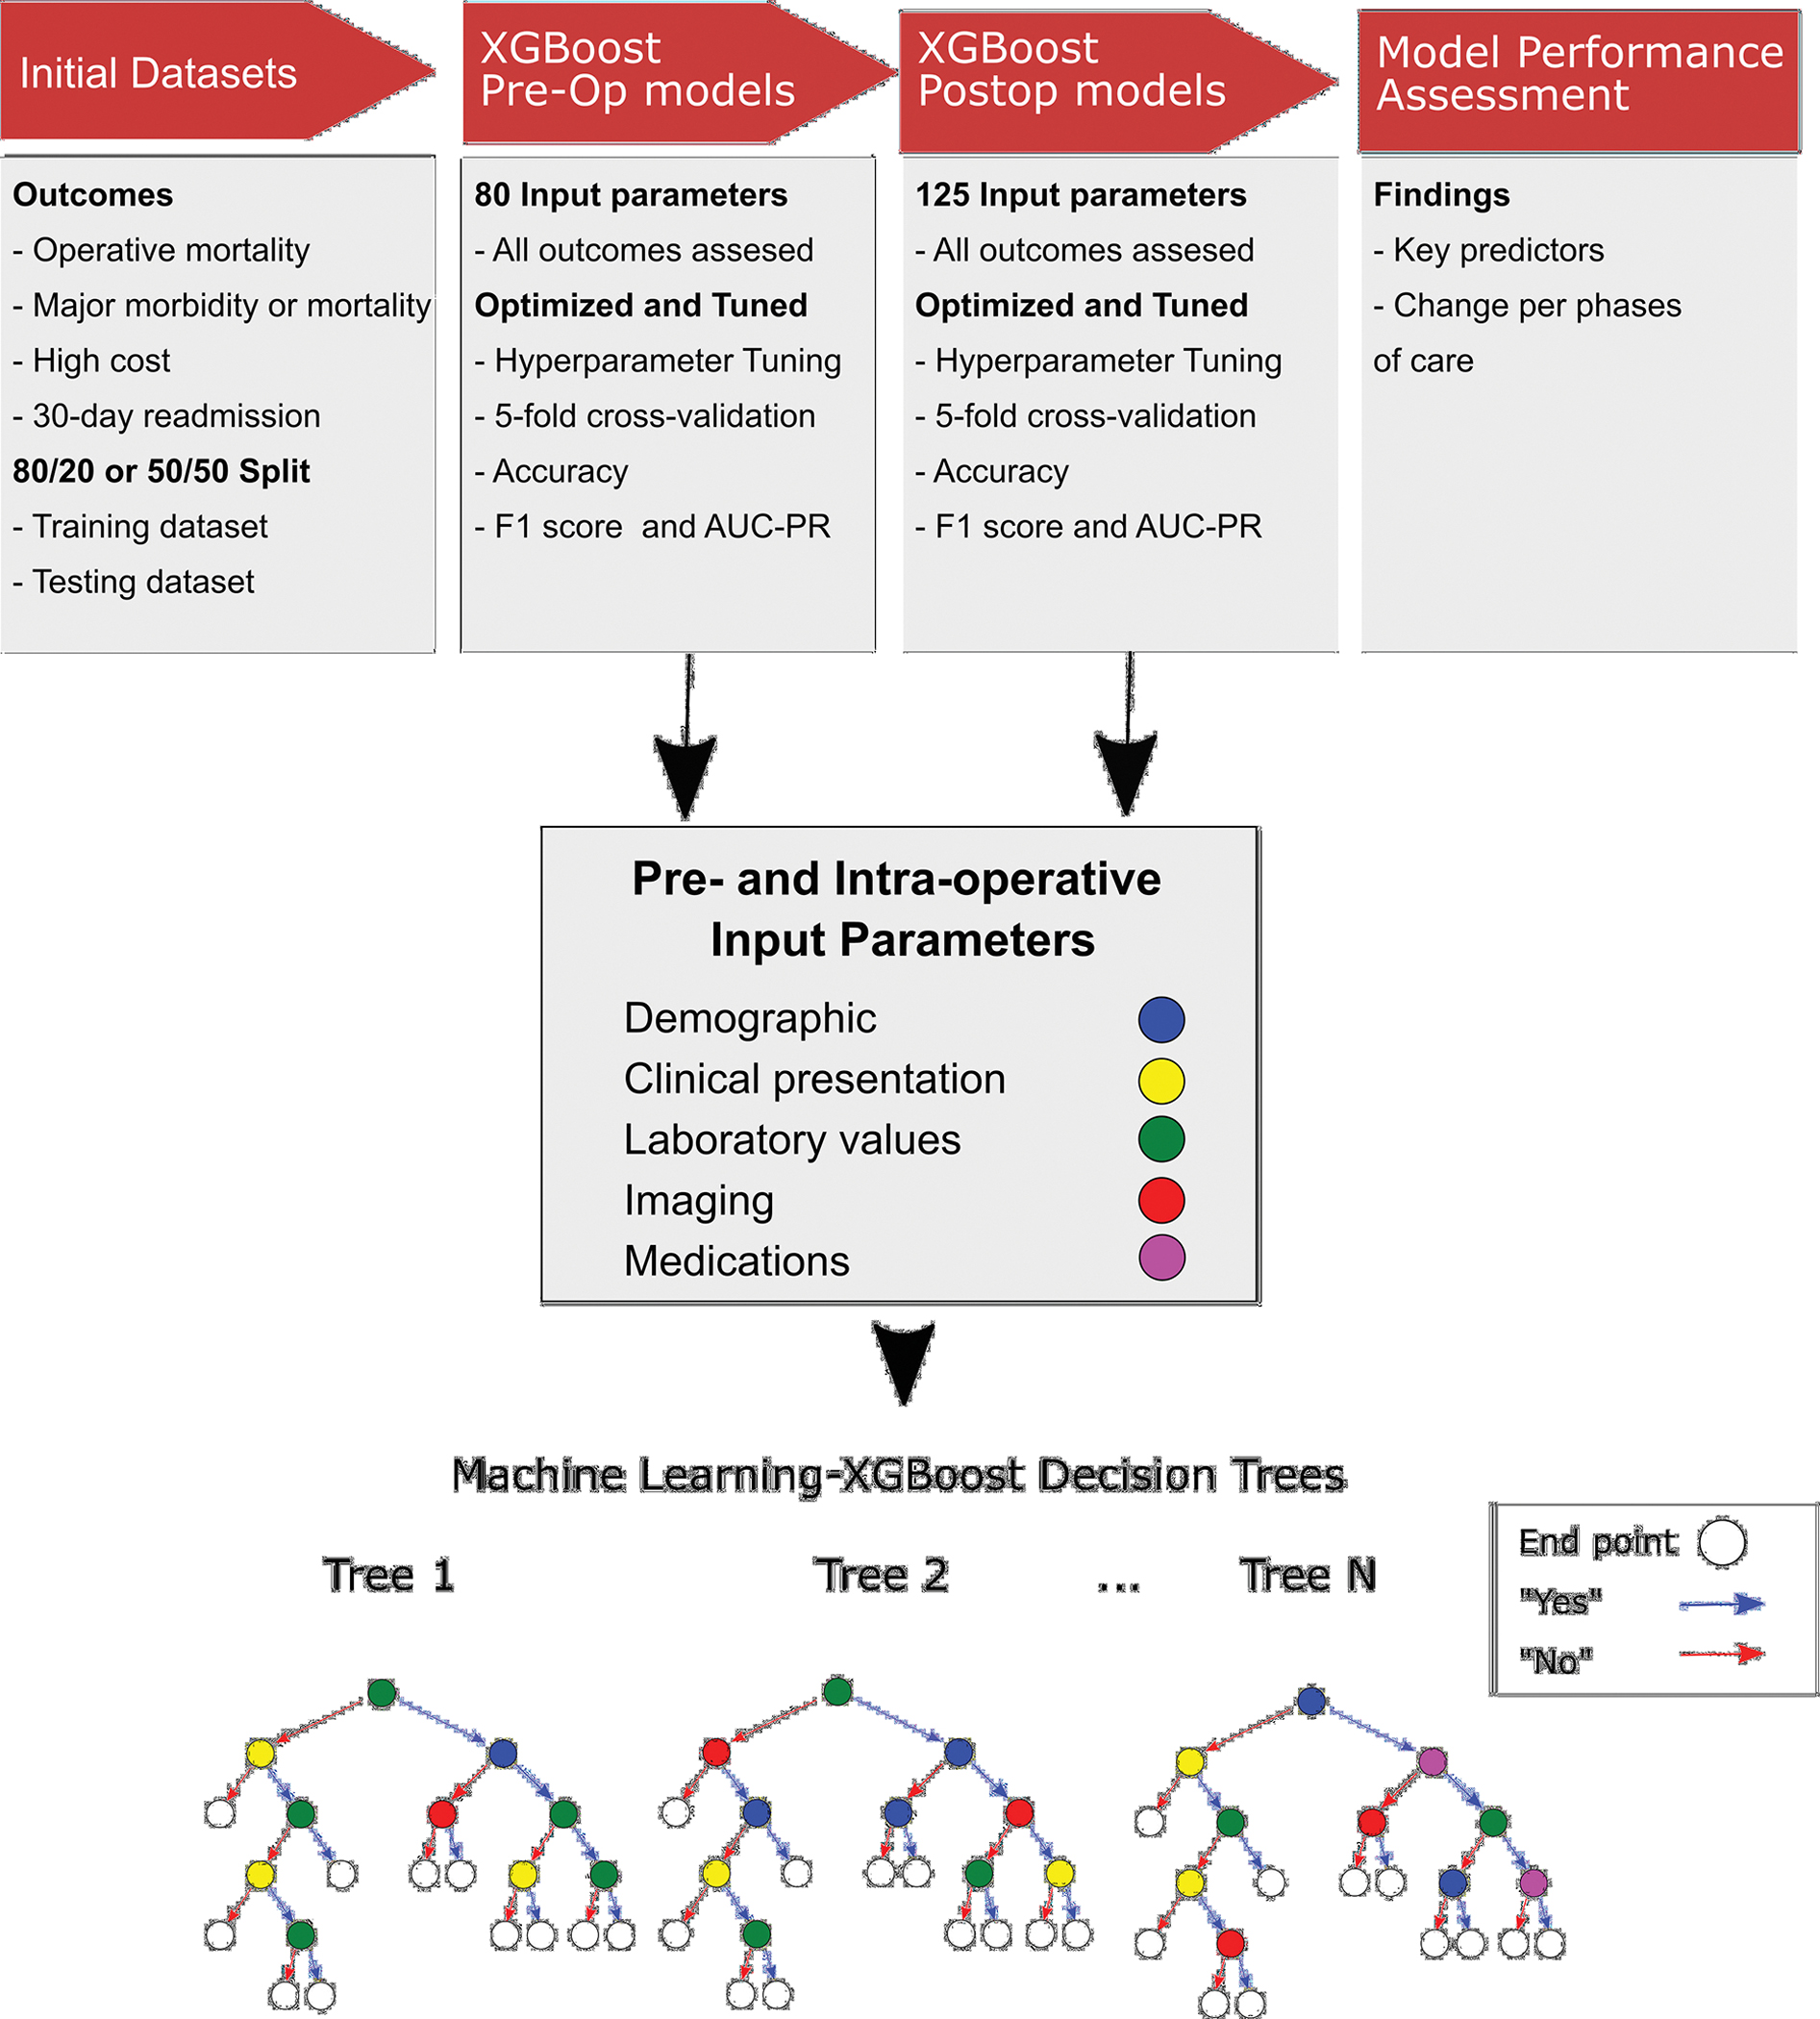
Overview of the methodology followed to develop the machine learning models. The outcomes were defined, and the initial datasets split 50/50 or 80/20. Following that, a preoperative model and a postoperative model were developed, the lower part shows some representative decision trees in this study. Finally, the key findings including most important predictors and change of the model performance per phase of care were assessed.
An XGBoost model for each outcome of interest was optimized to maximize the AUC-PR. The XGBoost algorithm contained 19 available hyperparameters and 10 of these hyperparameters, shown in Supplemental Table 3, were optimized. These were chosen for their ability to address the imbalanced nature of the datasets and prevent overfitting. An 80/20 and 50/50 split were used between the training and testing datasets by a simple randomization technique. The 80/20 split performed better for all outcomes except for mortality, in which the highly imbalanced dataset prevented accurate assessment of model performance. Supplemental Table 4 provides the baseline characteristics of the testing and training datasets.
Using the grid search optimization library and optimization routines, the XGBoost models were optimized using up to 20,000 iterations across a range of hyperparameter combinations and performing 5-fold cross-validation. A two-pass optimization was performed, in the first a wider range of hyperparameter settings was applied. Afterwards, more granular hyperparameter settings in a narrower range were applied. This made the process computationally efficient. XGBoost provides the feature importance for each parameter, which represents the number of times each parameter was a decision point in the tree. The relative feature importance was calculated as the feature importance score for the parameter divided by the sum of feature importance score for all the input parameters for each model. Model development, optimization and testing were performed on workstations containing Intel 40 CPU processing cores and 128 GB RAM utilizing the Ubuntu Linux operating system. The algorithms were developed using libraries including the Python programming language, scikit-learn (XGBoost), pandas (dataset partitioning), NumPy (data arrays), and matlibplot (feature importance plots).
Model Performance Assessment
For each model, accuracy, area under the curve of the receiver operator characteristic (AUC-ROC) curve, precision-recall (AUC-PR) curve, and F1 scores were derived to assess model performance as noted in Supplemental Figure 1. Accuracy was defined as the number of true positives and true negatives divided by the entire cohort. Precision was calculated as true positives divided by the sum of true positives and false negatives. Recall was calculated as true positives divided by the sum of true positives and false positives. The PR curve and F1 scores are more accurate for assessing unbalanced datasets. The preoperative model was compared to STS risk scores for outcomes with established calculators (PROM and predicted risk of mortality or major morbidity [PROMM]). Model performance was then compared between the preoperative versus postoperative model. The comparison between models for AUC-ROC and AUC-PR were done using DeLong’s test and bootstrapping, respectively. These analyses were done in R (Foundation for Statistical Computing, Vienna, Austria), using the glm, caret, pROC, PRROC and MASS packages.
Results
Mortality
Operative mortality was 2.0%. The preoperative model had an accuracy of 98%, an AUC-ROC of 0.77, AUC-PR of 0.16, and F1 score of 0.244.(Figure 2A) The most important predictive parameters were white blood cell count (13%), platelets (9%), weight (8%), hematocrit (8%), and ejection fraction (6%) as depicted in Figure 2B. The ML model performed similar to the STS PROM (AUC-PR of 0.16 [ML] versus 0.11 [STS PROM]; p=0.409).
Figure 2.
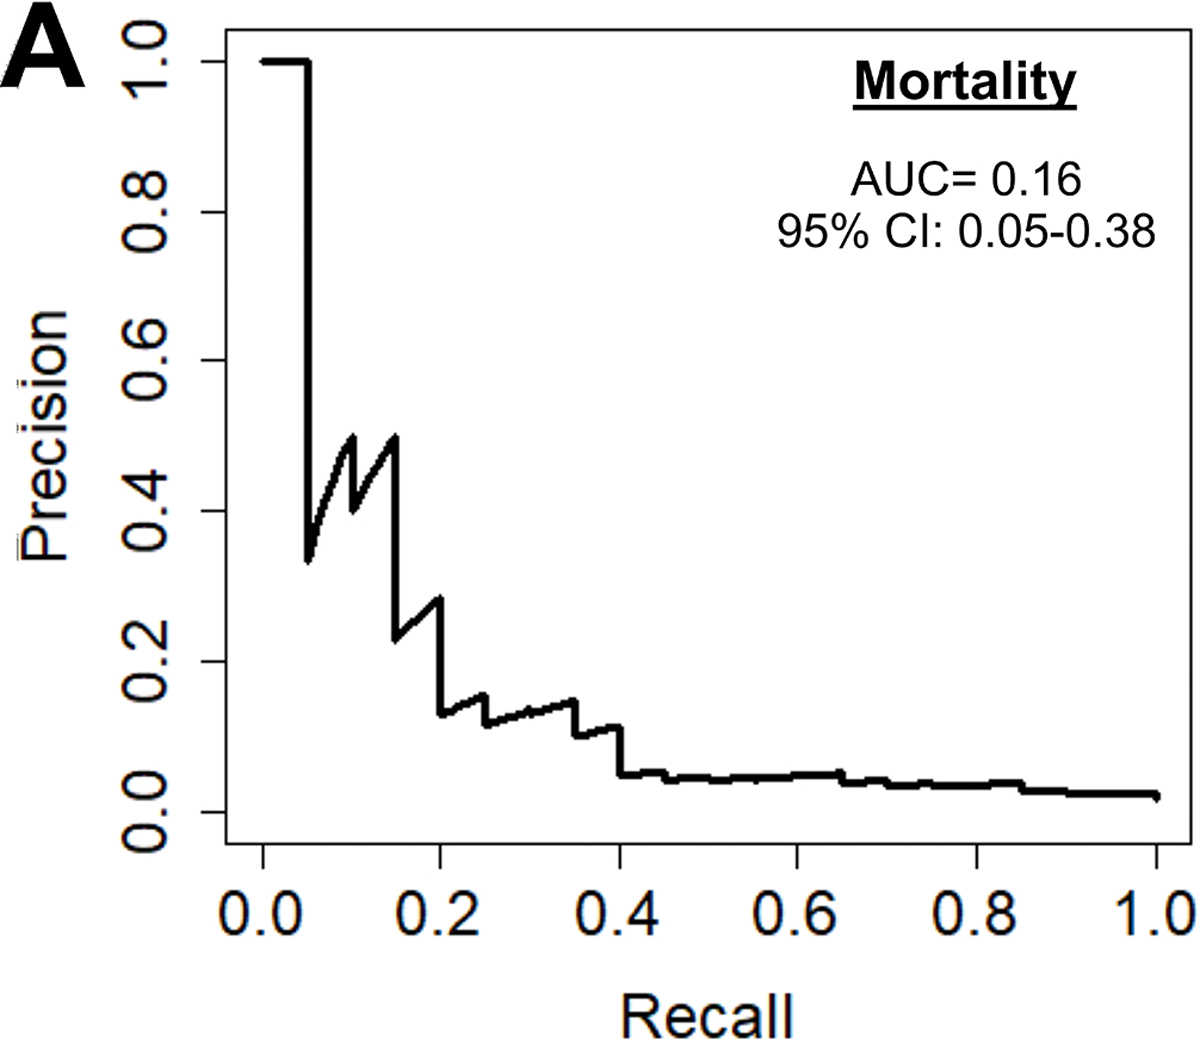
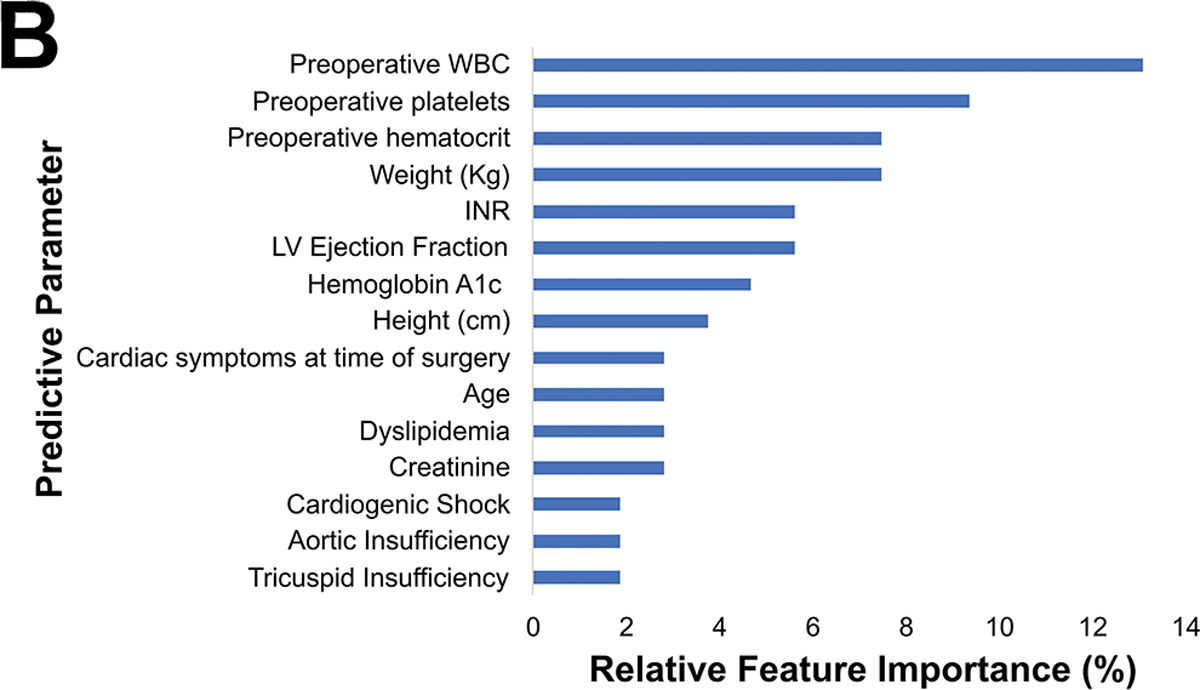
(A) Precision-recall curve and (B) relative feature importance of top 15 feature importance scores for operative mortality in the preoperative model.
INR: International normalized ration, LV: Left ventricular, WBC: White blood cell count.
Major Morbidity or Mortality
Major morbidity or mortality for the cohort was 16.8% (n=351), table 3 described a breakdown of these. The preoperative model had an accuracy of 75%, AUC-ROC of 0.69, AUC-PR of 0.33, and F1 score of 0.42 as seen in Figure 3A. The most important parameters were preoperative creatinine (9%), hematocrit (8%), hemoglobin A1c (6%), platelets (6%) and white blood cell count (6%) as illustrated in Figure 3B. The ML model performed superior to the STS PROMM (AUC-PR of 0.33 [ML] vs 0.28 [STS]; p<0.001).
Table 3.
Outcomes of CABG Patients.
| Outcome | Result |
|---|---|
|
| |
| Operative Mortality | 41(2.0%) |
| Major Morbidity | 342(16.4%) |
| Prolonged Ventilation | 226(10.8%) |
| Renal Failure | 44(2.1%) |
| Cardiac Reoperation | 98(4.7%) |
| Stroke | 37(1.8%) |
| Sternal Wound Infection | 12 (0.6%) |
| Cost | $43,044(26,644–48,667) |
| 30-day Readmission | 252/1,142(22%) |
Data reported in frequency (%) and median (interquartile range), as appropriate.
Figure 3.
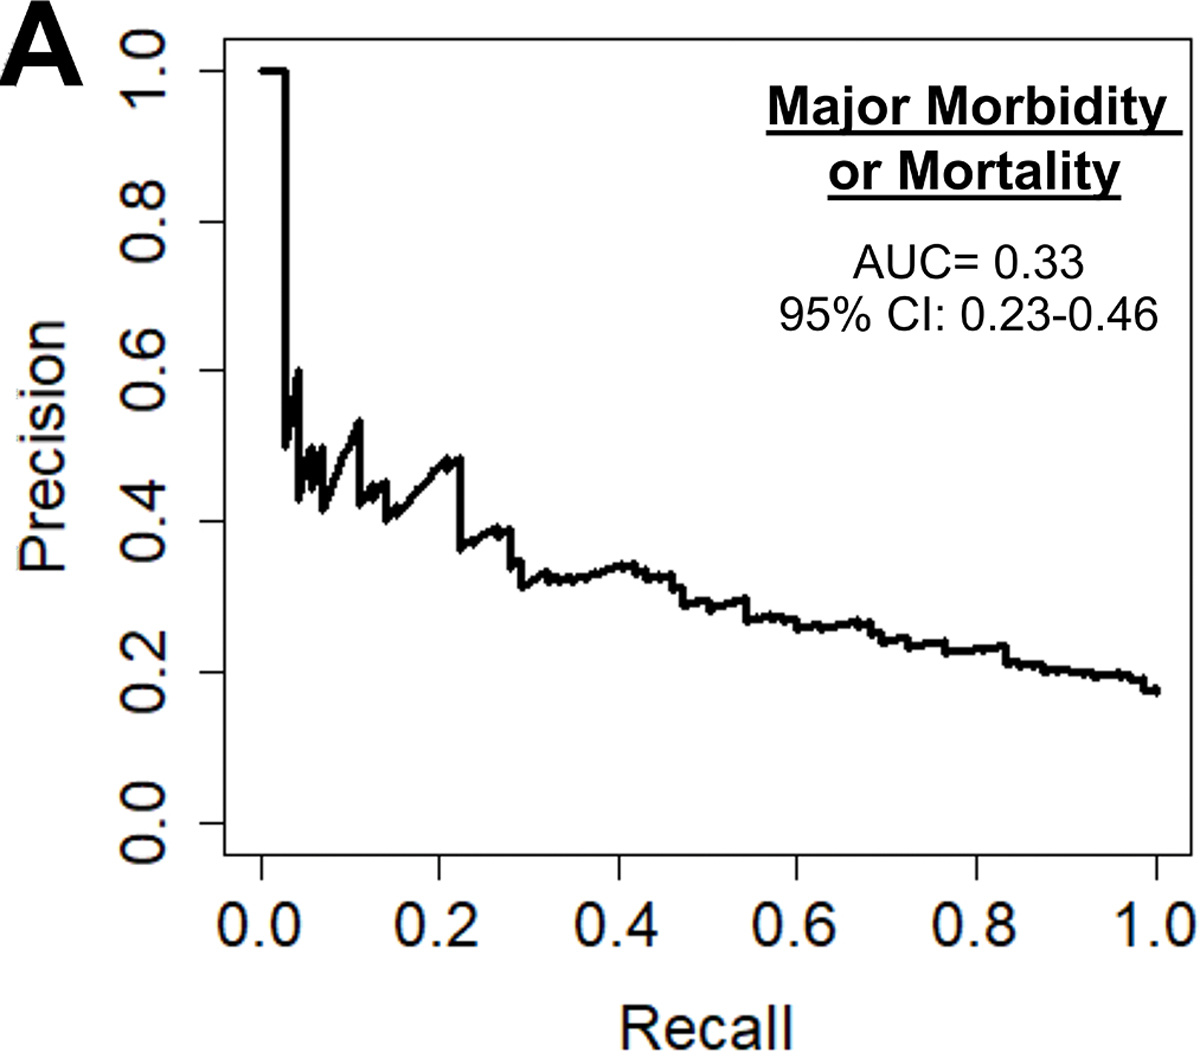
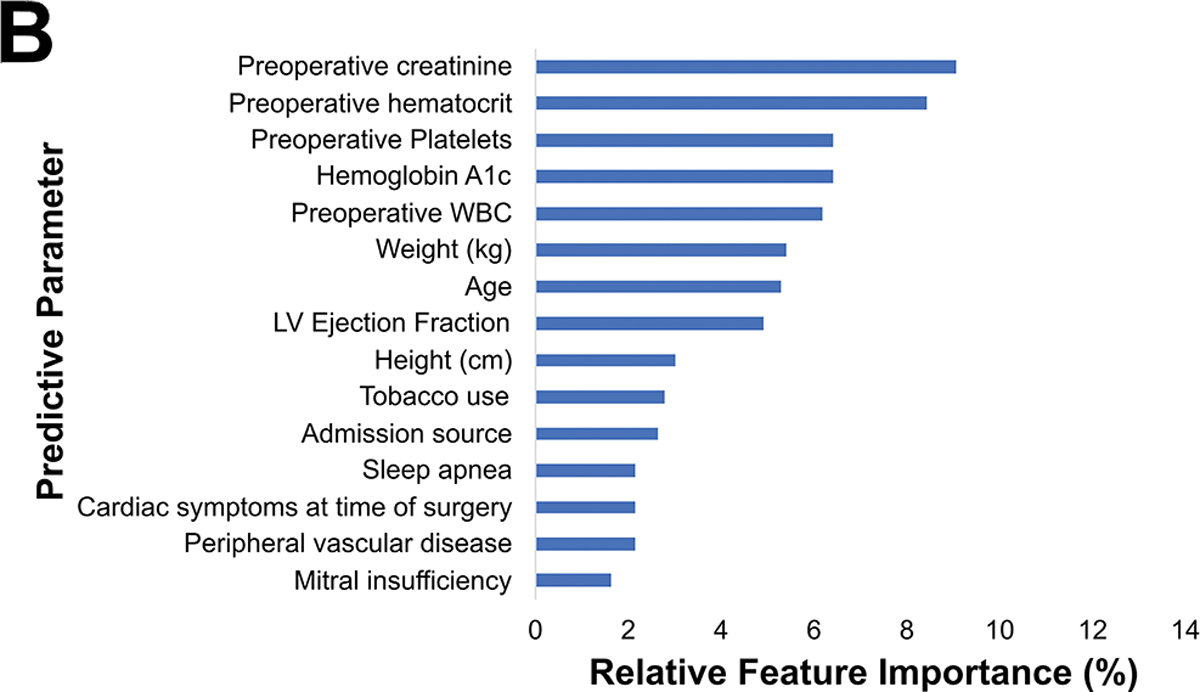
(A) Precision-recall curve and (B) relative feature importance of top 15 features for operative mortality or morbidity in the preoperative model.
INR: International normalized ration, LV: Left ventricular, WBC: White blood cell count.
High Total Hospitalization Cost
Among the 1,680 patients with hospital cost data, the average cost was $43,044.79. The preoperative cost model achieved an accuracy of 77%, AUC-ROC of 0.75, AUC-PR of 0.51, and F1 score of 0.52 shown in Figure 4A. The parameters with the highest feature importance were ejection fraction (7%), preoperative creatinine (7%), platelets (7%), weight (7%), and hematocrit (6%) as seen in Figure 4B.
Figure 4.
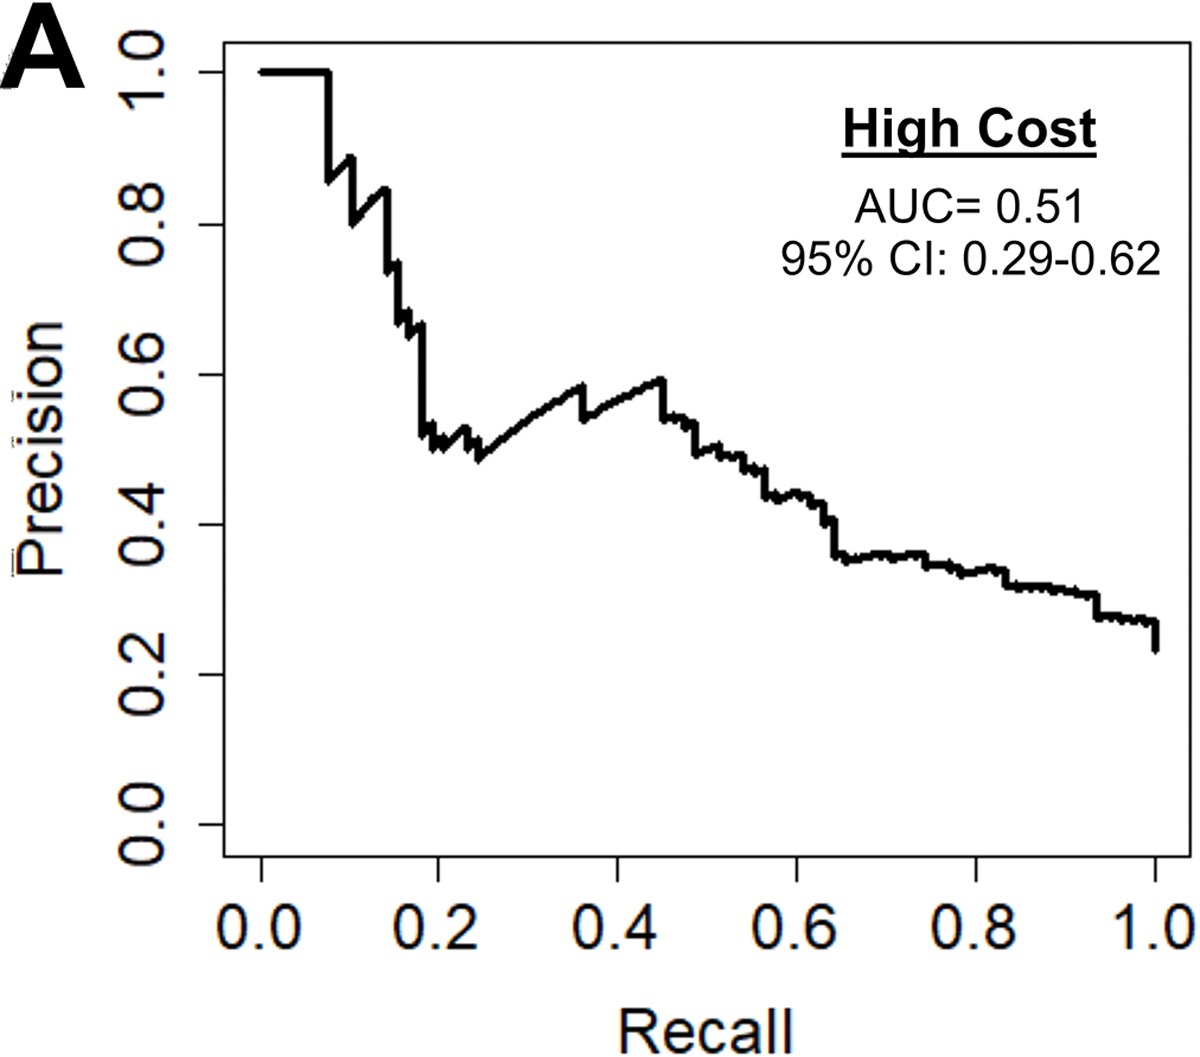
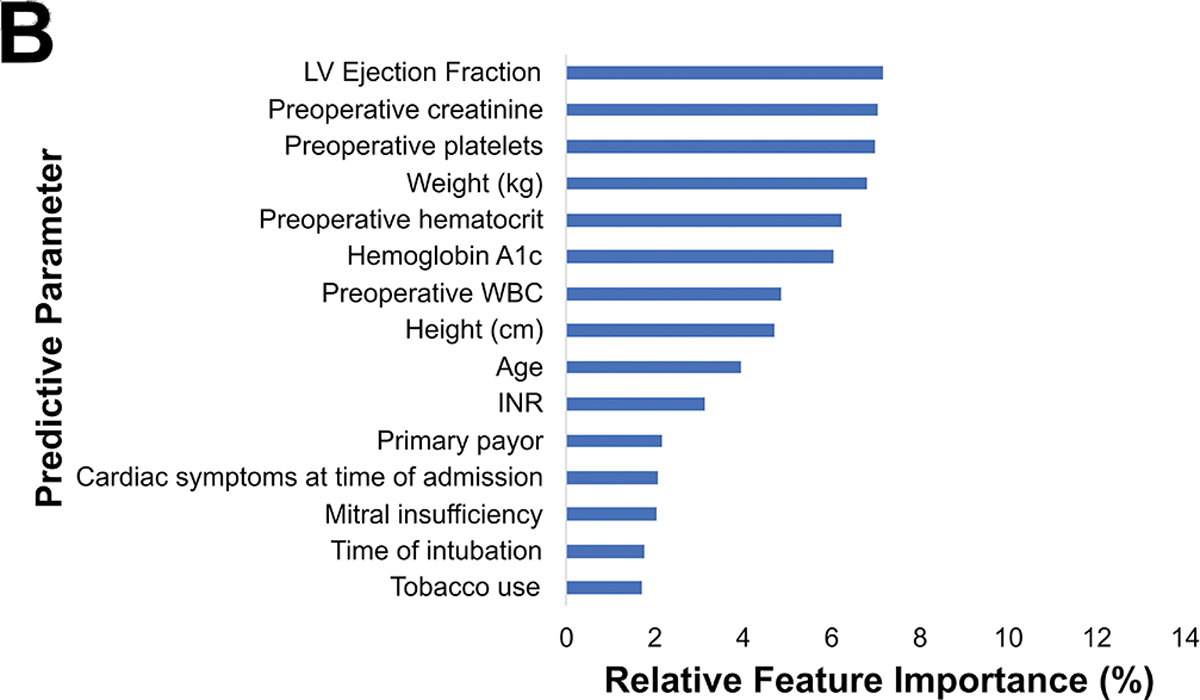
(A) Precision-recall curve and (B) relative feature importance of top 15 features for high cost in the preoperative model.
INR: International normalized ration, LVEF: Left ventricular ejection fraction, WBC: White blood cell count.
30-day Readmission
Among the 1142 patients with readmission data, 252 (22%) were readmitted within 30 days. The preoperative model achieved an accuracy of 70%, AUC-ROC of 0.73, AUC-PR of 0.47, and F1 score of 0.49, as shown in figure 5A. Figure 5B shows the parameters with the highest feature importance, the top five of which were weight (8%), platelets (7%), creatinine (7%), hematocrit (7%), and ejection fraction (6%).
Figure 5.
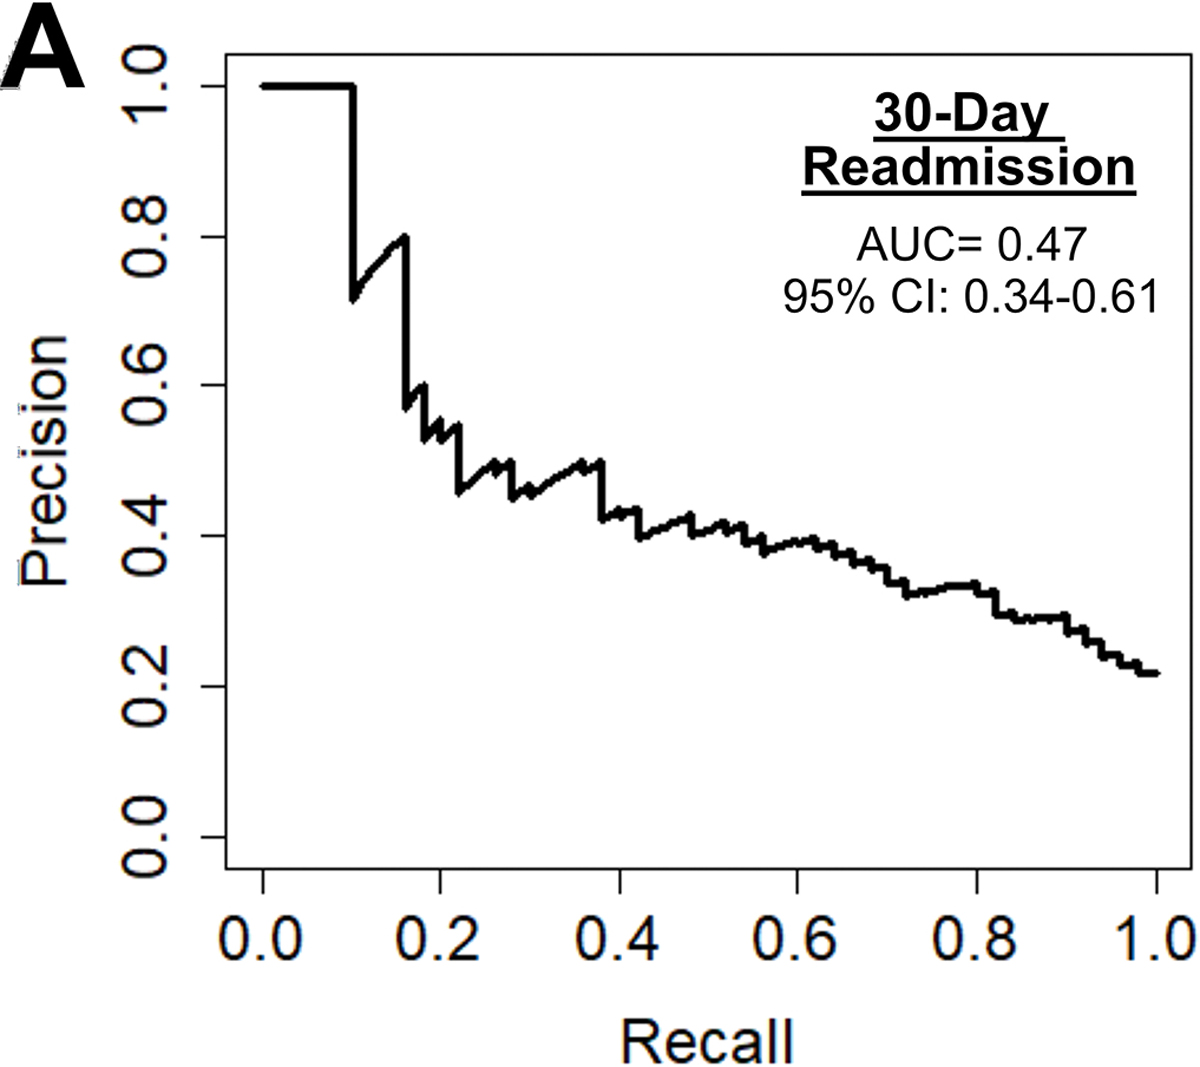
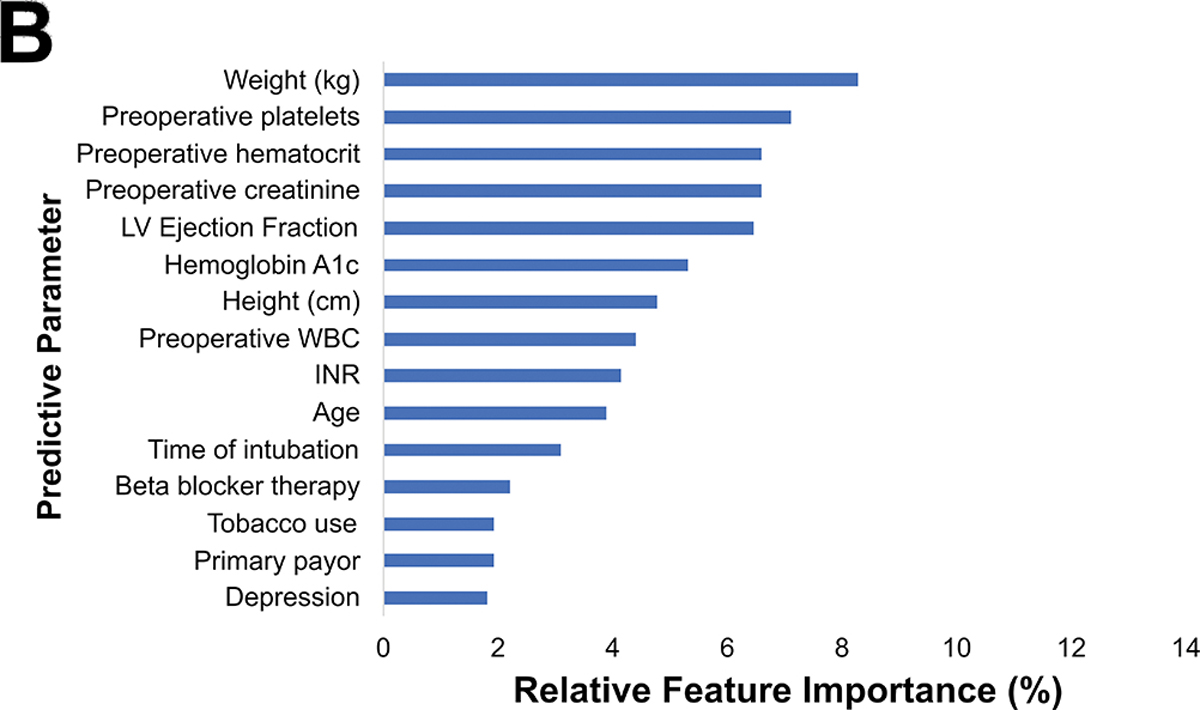
(A) Precision-recall curve and (B) relative feature importance of top 15 features for 30-day readmission in the preoperative model.
CAD: Coronary artery disease, LV: Left ventricular, WBC: White blood cell count.
Phase of Care Prediction Models
Postoperative Phase of Care risk models were developed utilizing pre- and operative parameters for all outcomes. Notably, operative factors such as bypass and cross-clamp time and lowest intraoperative hematocrit and temperature, became high feature importance for prediction of all outcomes. Figure 6 illustrates the variation in relative feature importance and modulation of relative feature importance in pre- vs postoperative models. For example, weight was consistently a high importance predictor, but its relative importance decreased (8% to 5% for operative mortality) after adding operative parameters for all four outcomes. The full list of feature importance is shown in Supplemental Tables 5–8.
Figure 6.
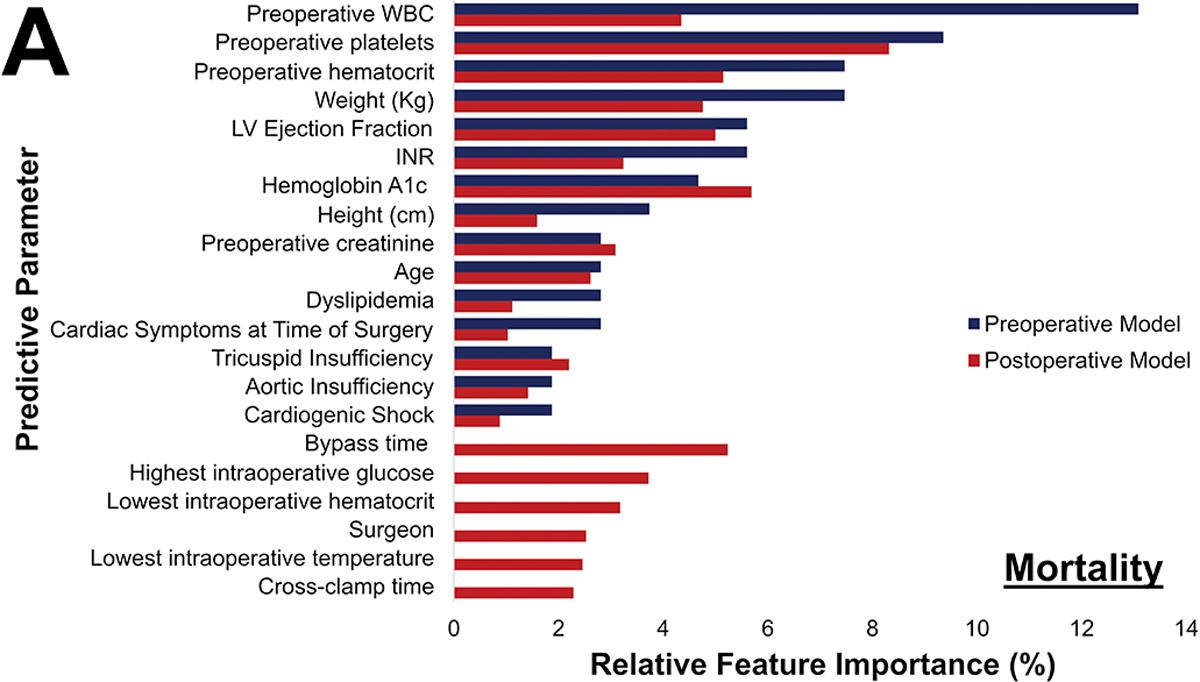
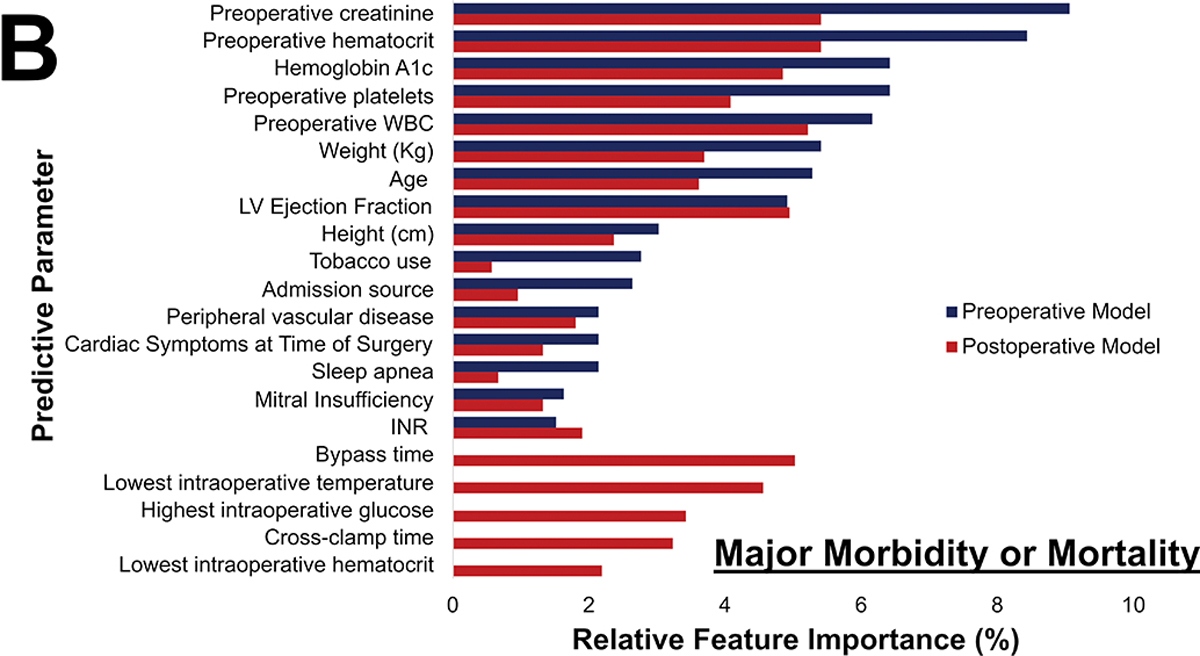
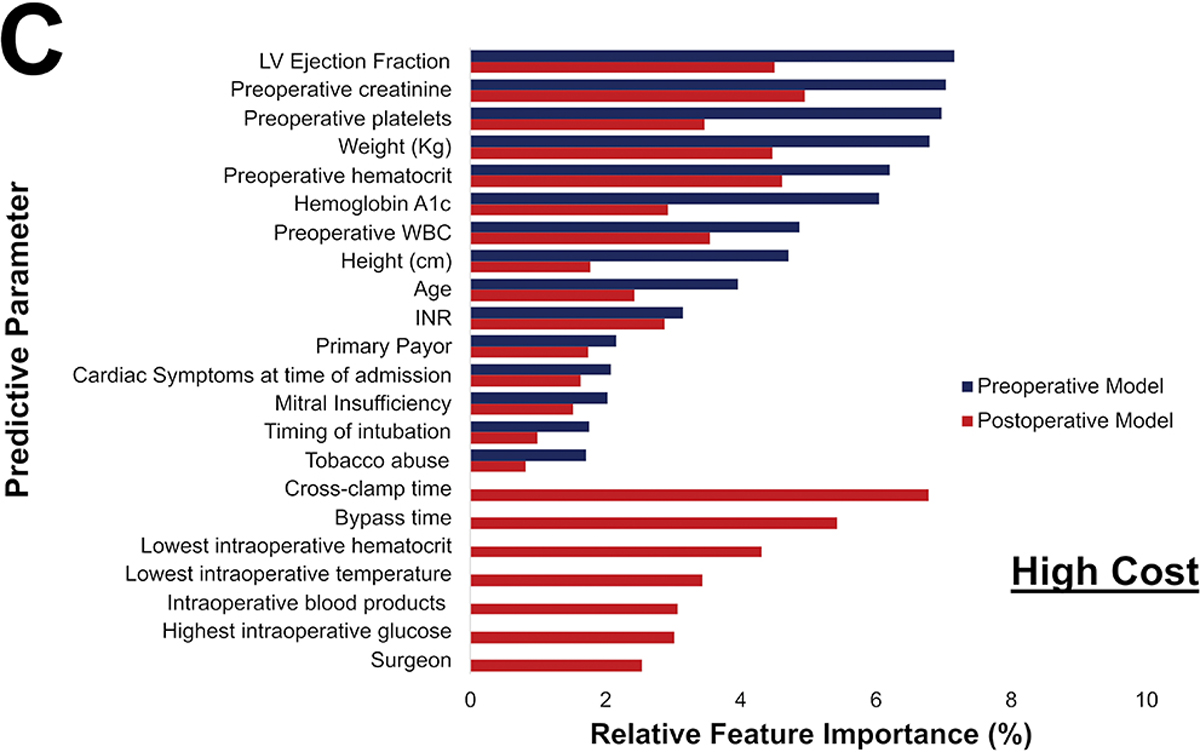
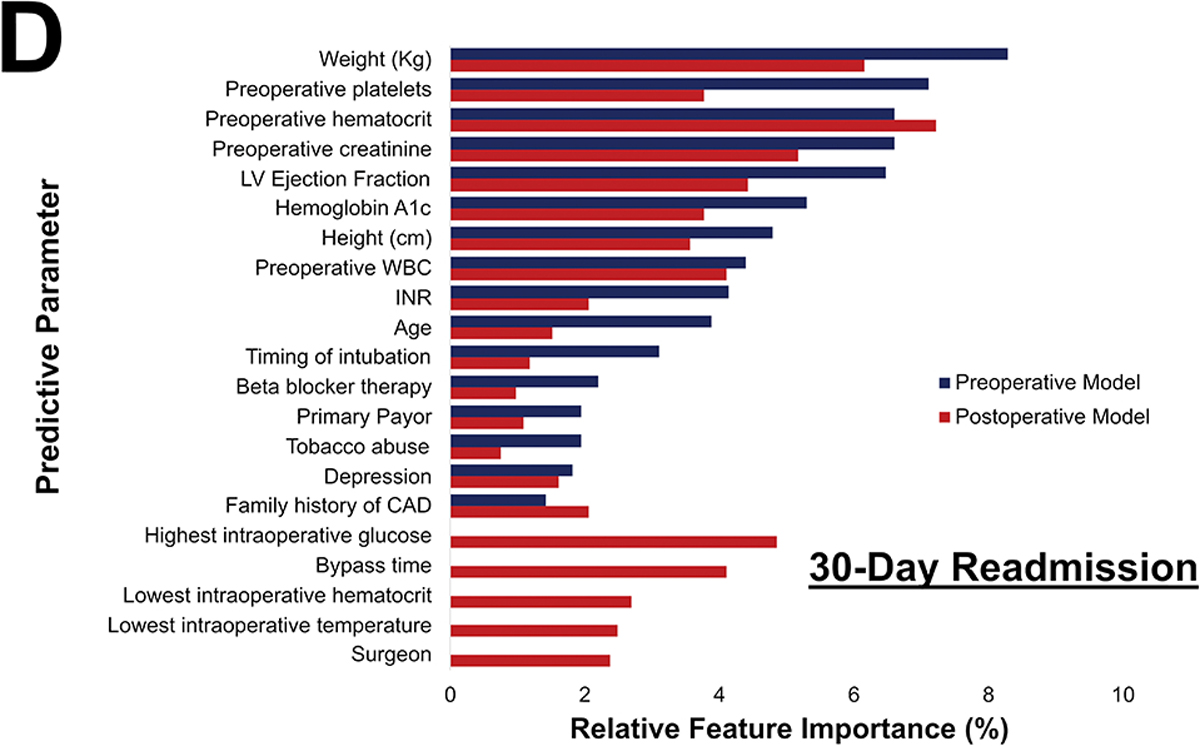
Changes in most predictive parameters between pre- and postoperative models for mortality (A), major morbidity or mortality (B), high cost (C), and 30-day readmission (D). Only the top 15 for each are included, the table is ordered in decreasing value per the preoperative model. CAD: Coronary Artery Disease; INR: International Normalized Ratio; LVEF: Left Ventricular Ejection Fraction; WBC: White blood cell count
The differences between the pre- and postoperative models are described in Table 4. Overall, modest improvements in AUC-ROC, AUC-PR, F1 score, and accuracy were seen among all outcomes. Most notably, postoperative ML models for major morbidity or mortality and for high cost performed superior to preoperative ML models (p<0.001).
Table 4.
Preoperative and postoperative ML models for each outcome
| Mortality | Major Morbidity or Mortality | High Cost | 30-day Readmission | |||||
|---|---|---|---|---|---|---|---|---|
|
| ||||||||
| Preoperative | Postoperative | Preoperative | Postoperative | Preoperative | Postoperative | Preoperative | Postoperative | |
|
| ||||||||
| AUC-PR | 0.16 (0.05–0.38) | 0.21 (0.08–0.44) | 0.33 (0.29–0.44) | 0.39 (0.29–0.51) | 0.51 (0.40–0.62) | 0.64 (0.53–0.74) | 0.47 (0.34–0.61) | 0.47 (0.34–0.61) |
| AUC-ROC | 0.77 (0.66–0.87) | 0.68 (0.54–0.81) | 0.69 (0.62–0.76) | 0.70 (0.63–0.77) | 0.75 (0.69–0.81) | 0.83 (0.78–0.88) | 0.73 (0.65–0.81) | 0.73 (0.66–0.81) |
| Accuracy | 0.97 | 0.98 | 0.75 | 0.71 | 0.77 | 0.83 | 0.70 | 0.72 |
| F1 Score | 0.24 | 0.31 | 0.42 | 0.42 | 0.52 | 0.61 | 0.49 | 0.52 |
AUC: Area under the curve, ROC: Receiver operator characteristics; PR: Precision-Recall.
Comment
In this study, a ML XGBoost model to predict postoperative CABG outcomes of operative mortality, major morbidity, high cost, and 30-day readmission was developed and validated. The ML algorithm predicted major morbidity or mortality better than the established STS PROMM score. Addition of operative parameters improved prediction performance, as indicated by higher AUC and F1 scores for prediction of major morbidity or mortality and high cost. The addition of parameters through the phase of care may enable a dynamic risk prediction strategy for patients undergoing CABG.
ML has been previously evaluated to predict mortality after CABG. Prediction of low frequency events, such as operative mortality after CABG (2.2% in STS national data) is challenging for all statistical models. A recent meta-analysis identified 15 studies using ML algorithms to predict outcomes after cardiac surgery.(4) Seven of these were specific to patients undergoing CABG. These studies included only preoperative variables, employed mostly neural networks, and achieved an AUC-ROC between 0.76 and 0.91. However, a significant limitation of neural networks is the inability to determine the importance of individual risk factors for predicting outcomes. This lack of interpretability limits utility in medical applications and adds to the “black-box” concern of ML. Lippmann and colleagues also utilized neural networks to evaluate 80,606 patients from the national STS database. They found that neural networks could accurately predict mortality risk in most patients except for those at the highest risk; calibration improved when combined with logistic regression as assessed by calibration plots.(12) One of the challenges of this landmark study is that the AUC-ROC was calculated without accounting for the imbalanced dataset, which is likely to overestimate model performance. These considerations emphasize the significant advantages of XGBoost decision tree models when applied to real-world datasets. Additionally, we used the more accurate F1 score and AUC-PR to assess performance in these imbalanced datasets, particularly for mortality.
Kilic and colleagues examined over 11,000 patients, of which 7,048 underwent an isolated CABG.(5) They found that the XGBoost ML model offered modest improvements when compared to the STS PROM, similar to our findings. Our current study supports the conclusions from prior studies, while also expanding the use ML to prediction of other key CABG metrics. Major morbidity is highly relevant to patient outcomes and a more frequent event compared to mortality. This is one of the few studies to utilize ML to predict major morbidity as defined by STS. The prediction of major morbidity may play an important role in decision making, especially in high-risk groups, such as elderly patients.
Current risk predictors rely on preoperative parameters. Clinical intuition tells us that more accurate prediction should be possible through the phases of clinical care. This is one of the few studies to evaluate risk prediction for multiple outcomes at these two distinct time points using ML and the first to assess cost. Not surprisingly, bypass times and cross-clamp times were found to have an important role in predicting risk for patients after CABG. Prior studies estimate the odds of perioperative mortality increase by 1.4–1.8 times per 30-minute increments in bypass time.(13,14) The findings of lowest hematocrit and blood transfusion as important predictors also correlate with literature showing excessive blood loss increases risk of adverse outcomes.(15,16)
Interestingly, preoperative thrombocytopenia has been described as a risk for mortality and major morbidity in CABG. A possible explanation is the increased risk of bleeding.(17) Finally, an increased white blood cell count could be associated with a preoperative higher inflammatory state and increase the chance of complications.(18) The current findings are consistent with previous literature and point to paying closer attention to frequently obtained laboratory tests.
Prediction performance improved for morbidity or mortality and high cost upon arrival to ICU. For medical and surgical ICU patients, Thorsen-Meyer and colleagues applied artificial neural networks to predict 90-day mortality in 14,190 ICU admissions.(19) They found that the AUC-ROC at time of admission was 0.75, which increased to 0.82 at 72 hours afterwards. Since the model did not significantly improved postoperatively for mortality and readmission, it is possible that the preoperative parameters are more relevant predictors. Using this framework to predict risk by phase of care, and quality assessment at different phases may identify opportunities to improve patient outcomes.
Finally, ML predicted 30-day readmission and high cost, two outcomes for which no standardized regression model exists. With reduction in mortality, resource utilization is becoming an increasingly important outcome. Major databases have previously been explored by our group and others to predict 30- and 90-day readmission with AUC-ROCs ranging between 0.62–0.67 using logistic regression.(20,21) Manyam recently assessed the use of an XGBoost model to predict post-CABG readmission and developed a model with AUC-ROC of 0.87 on the testing cohort once time-dependent variables were added.(15) This study adds to the literature by providing insight into the predictors of readmission. Prediction of hospital cost remains challenging yet is an obvious need for reimbursement and resource allocation. In this study, ML enabled identification of a cohort of patients that are high cost for CABG.
This study has some limitations. Similar to others, we found that ML performed on-par than the existing STS model for mortality. For most post-CABG outcomes, especially mortality rate (2.0%), event rates are low, leading to highly unbalanced datasets. Thereby overfitting of the model is possible despite the characteristic strength of XGBoost to use of hyperparameter tuning and confusion matrices to avoid this. This limitation would also improve with access to larger datasets with greater number of events to further improve the model’s training and performance.(22) Finally, this model was applied to one timepoint in the postoperative period with data available in the STS database. The addition of hemodynamic data and medication may allow for a deep learning model to produce real-time risk scores, particularly if incorporated with the electronic medical record.
Conclusions
In conclusion, this study has demonstrated that a ML model can be used to predict mortality, major morbidity, high total hospitalization cost, and 30-day readmission. Furthermore, adding operative parameters enhances the predictive capabilities of the model, allowing for dynamic prediction of risk at clinically relevant time points. Major preoperative predictors included laboratory values, weight, ejection fraction, and kidney disease, while major operative factors included cardiopulmonary bypass time, aortic cross-clamp time, lowest temperature, lowest hemoglobin, and highest glucose. Applying these methods to larger databases and the application of higher computational power to efficiently mine data from the electronic medical record would make real-time risk prediction feasible and enhance outcome prediction.
Supplementary Material
Abbreviations:
- AUC
Area under the curve
- CABG
Coronary Artery Bypass Graft
- ICU
Intensive Care Unit
- ML
Machine Learning
- PROM
Predicted risk of mortality
- PROMM
Predicted risk of morbidity or mortality
- PR
Precision-Recall
- ROC
Receiver operator curve
- STS
Society of Thoracic Surgeons
Footnotes
Disclosures: CTR is supported by the NIH/NHLBI Research Training Program in Cardiovascular Surgery (T32 HL139430); JH holds an equity position in InformAI; TCN receives an honorarium and speaker for Edward Lifesciences and CryoLife; JSC participates in clinical studies with and/or consults for Terumo Aortic, Medtronic, W. L. Gore & Associates, CytoSorbents, Edwards Lifesciences, and Abbott Laboratories and receives royalties and grant support from Terumo Aortic.
Presented at the 57th Annual Society of Thoracic Surgeons Meeting, January 2021
Publisher's Disclaimer: This is a PDF file of an article that has undergone enhancements after acceptance, such as the addition of a cover page and metadata, and formatting for readability, but it is not yet the definitive version of record. This version will undergo additional copyediting, typesetting and review before it is published in its final form, but we are providing this version to give early visibility of the article. Please note that, during the production process, errors may be discovered which could affect the content, and all legal disclaimers that apply to the journal pertain.
References
- 1.O’Brien SM, Feng L, He X, et al. The Society of Thoracic Surgeons 2018 Adult Cardiac Surgery Risk Models: Part 2-Statistical Methods and Results. Ann Thorac Surg. 2018;105(5):1419–28. [DOI] [PubMed] [Google Scholar]
- 2.Nashef SAM, Roques F, Sharples LD, et al. EuroSCORE II. Eur J Cardio-Thorac Surg. 2012. Apr;41(4):734–44; discussion 744–745. [DOI] [PubMed] [Google Scholar]
- 3.Ad N, Holmes SD, Patel J, Pritchard G, Shuman DJ, Halpin L. Comparison of EuroSCORE II, Original EuroSCORE, and The Society of Thoracic Surgeons Risk Score in Cardiac Surgery Patients. Ann Thorac Surg. 2016. Aug;102(2):573–9. [DOI] [PubMed] [Google Scholar]
- 4.Benedetto U, Dimagli A, Sinha S, et al. Machine learning improves mortality risk prediction after cardiac surgery: Systematic review and meta-analysis. J Thorac Cardiovasc Surg. 2020. Aug 10;0(0). [DOI] [PubMed] [Google Scholar]
- 5.Kilic A, Goyal A, Miller JK, et al. Predictive Utility of a Machine Learning Algorithm in Estimating Mortality Risk in Cardiac Surgery . Ann Thorac Surg. 2019. Nov 7; [DOI] [PubMed] [Google Scholar]
- 6.Fernandez FG. The Future Is Now: The 2020 Evolution of The Society of Thoracic Surgeons National Database. Ann Thorac Surg. 2020. Jan 1;109(1):10–3. [DOI] [PubMed] [Google Scholar]
- 7.Blackstone EH, Swain J, McCardle K, Adams DH, Governance Committee, American Association for Thoracic Surgery Quality Assessment Program. A comprehensive AATS quality program for the 21st century. J Thorac Cardiovasc Surg. 2019. Oct;158(4):1120–6. [DOI] [PubMed] [Google Scholar]
- 8.Dong Y, Peng C-YJ. Principled missing data methods for researchers. SpringerPlus. 2013. May 14;2. [DOI] [PMC free article] [PubMed] [Google Scholar]
- 9.Salgado CM, Azevedo C, Proença H, Vieira SM. Missing Data. In: MIT Critical Data, editor. Secondary Analysis of Electronic Health Records. Cham: Springer International Publishing; 2016. p. 143–62. [Google Scholar]
- 10.Kilic A Artificial Intelligence and Machine Learning in Cardiovascular Health Care. Ann Thorac Surg. 2020;109(5):1323–9. [DOI] [PubMed] [Google Scholar]
- 11.Miller DD. Machine Intelligence in Cardiovascular Medicine. Cardiol Rev. 2020. Apr;28(2):53–64. [DOI] [PubMed] [Google Scholar]
- 12.Lippmann RP, Shahian DM. Coronary Artery Bypass Risk Prediction Using Neural Networks. Ann Thorac Surg. 1997;63(6):1635–43. [DOI] [PubMed] [Google Scholar]
- 13.Salis S, Mazzanti VV, Merli G, et al. Cardiopulmonary bypass duration is an independent predictor of morbidity and mortality after cardiac surgery. J Cardiothorac Vasc Anesth. 2008. Dec;22(6):814–22. [DOI] [PubMed] [Google Scholar]
- 14.Chalmers J, Pullan M, Mediratta N, Poullis M. A need for speed? Bypass time and outcomes after isolated aortic valve replacement surgery. Interact Cardiovasc Thorac Surg. 2014. Jul;19(1):21–6. [DOI] [PubMed] [Google Scholar]
- 15.Manyam R, Zhang Y, Carter S, Binongo JN, Rosenblum JM, Keeling WB. Unraveling the impact of time-dependent perioperative variables on 30-day readmission after coronary artery bypass surgery. J Thorac Cardiovasc Surg. 2020. Sep 29; [DOI] [PubMed] [Google Scholar]
- 16.Biancari F, Mariscalco G, Gherli R, et al. Variation in preoperative antithrombotic strategy, severe bleeding, and use of blood products in coronary artery bypass grafting: results from the multicentre E-CABG registry. Eur Heart J Qual Care Clin Outcomes. 2018. Oct 1;4(4):246–57. [DOI] [PubMed] [Google Scholar]
- 17.Nammas W, Dalén M, Rosato S, et al. Impact of preoperative thrombocytopenia on the outcome after coronary artery bypass grafting. Platelets. 2019;30(4):480–6. [DOI] [PubMed] [Google Scholar]
- 18.Ge M, Wang Z, Chen T, et al. Risk factors for and outcomes of prolonged mechanical ventilation in patients received DeBakey type I aortic dissection repairment. J Thorac Dis. 2021. Feb;13(2):735–42. [DOI] [PMC free article] [PubMed] [Google Scholar]
- 19.Thorsen-Meyer H-C, Nielsen AB, Nielsen AP, et al. Dynamic and explainable machine learning prediction of mortality in patients in the intensive care unit: a retrospective study of high-frequency data in electronic patient records. Lancet Digit Health. 2020. Apr 1;2(4):e179–91. [DOI] [PubMed] [Google Scholar]
- 20.Shah RM, Zhang Q, Chatterjee S, et al. Incidence, Cost, and Risk Factors for Readmission After Coronary Artery Bypass Grafting. Ann Thorac Surg. 2019. Jun;107(6):1782–9. [DOI] [PubMed] [Google Scholar]
- 21.Zea-Vera R, Zhang Q, Amin A, et al. Development of a Risk Score to Predict 90-Day Readmission After Coronary Artery Bypass Graft. Ann Thorac Surg. 2021. Feb;111(2):488–94. [DOI] [PubMed] [Google Scholar]
- 22.Ishwaran H, Blackstone EH. Commentary: Dabblers: Beware of hidden dangers in machine-learning comparisons. J Thorac Cardiovasc Surg. 2020. Aug 31; [DOI] [PMC free article] [PubMed] [Google Scholar]
Associated Data
This section collects any data citations, data availability statements, or supplementary materials included in this article.


