Abstract
Background
We wanted to demonstrate whether the initial platelet-to-albumin ratio (PAR) had predictive value for cardiac surgery-associated acute kidney injury (CSA-AKI) and prognosis of critical care patients.
Methods
This is an observational and multi-center study from the MIMIC-IV database, the eICU-CRD database as well as CS patients at our institution. Logistic regression and Cox regression analyses were applied to determine the predictive value for CSA-AKI and in-hospital mortality. LASSO and SVM-RFE models were then employed to discover the coincident variables connected with CSA-AKI. The main objective of this research was the incidence of CSA-AKI, whereas the secondary endpoint was in-hospital death.
Results
The higher PAR value (≥4.67) had a higher risk of CSA-AKI (adjusted OR = 4.02, 95% CI 3.41–4.75, P < 0.001) and in-hospital mortality (HR = 2.41 95% CI 1.44–4.03, P = 0.001) after adjusted for other confounding factors including patients with or without chronic kidney disease. The proposed nomogram based on PAR and others clinical factors selected by LASSO and SVM-RFE models for CSA-AKI had the C-index 0.821 (95% CI 0.807–0.834), 0.808 (95% CI 0.787–0.829), 0.745 (95% CI 0.728–0.762), and 0.826 (95% CI 0.753–0.899) in these cohorts, respectively. The nomogram exhibited both remarkable calibration capacity and therapeutic helpfulness in all groups.
Conclusion
PAR is a relative excellent measure for the event AKI and prognosis of ICU patients who undergone CS. The suggested nomogram based on PAR resulted in an accurate prediction for the detection of critical care patients with CSA-AKI.
Keywords: platelet to albumin ratio, cardiac surgery, acute kidney injury, nomograms, prognosis
Introduction
Cardiac surgery-associated acute kidney injury (CSA-AKI), which is classified as the type 1 form of the cardiorenal syndrome, is the second most familiar pathogenesis of AKI (following sepsis) in critically ill patients and is found to have a significant relationship with high mortality and extended of hospital stay.1–4 Increasing data has revealed that efficient and adequate therapies at the early stage of AKI are critical for patients.5–7 Hence, early risk assessment and quick identification of CSA-AKI utilizing biomarkers or predictive models help doctors to compactly treat AKI patients and to make choices for preventative and pharmacological methods to enhance prognosis.
Considering that inflammation has a tight link with the onset, development, and progression of AKI, plenty of inflammation-based biomarkers have been established to have diagnostic and prognostic significance in various kinds of patients.8–13 In addition, recent studies have also indicated that platelet–albumin ratio (PAR), an indication of the inflammatory response, may be employed as a predictive marker or progression factor for various kinds of cancers.14–16 However, the association between PAR and CSA-AKI for critical care patients has not previously been explored. Hence, we wanted to evaluate the predictive usefulness of the preoperative PAR for CSA-AKI in critical care patients. Moreover, given that the nomogram makes it easier and preciseness to forecast the likelihood of clinical outcomes in personal individuals, we designed a nomogram incorporating PAR as well as clinicopathologic parameters to predict AKI for critical care patients.
Materials and Methods
Data Source
All patients in this investigation were gathered from the MIMIC IV v1.0 and the eICU-CRD v2.0.17,18 Moreover, we also included patients with the same inclusion criteria at our hospital from January 2020 to February 2021. This research was authorized by the Ethics Committee of the First People’s Hospital of Jiangxia district of Wuhan city (No. 2021–024) and considering that this was a retrospective study and all patients in this database and our hospital were de-identified or maintained with confidentiality, informed consent was waived.
Patients
The inclusion criteria were described in our prior study.19 In brief, all patients who performed cardiac surgery based on the ninth or tenth revision of International Classification of Diseases (ICD-9/10) code during their admissions were included in this study. We further removed individuals who were younger than 18 years old, spent less than 48 hours in the ICU, with a history of end-stage kidney disease (ESKD), had missing values of platelet and serum albumin, or developed AKI before cardiac surgery. Finally, 6253 patients from the MIMIC database were included in this research and were randomly allocated as the training set (n = 4387) and internal validation set (n = 1866) by the ratio of 7:3. Patients in the eICU-CRD database were designated as external validation cohort (n = 3328). Moreover, patients in our hospital were allocated as the external validation set 2 (n = 119).
Variables
Demographic data, operation type, commodities, pharmaceutical information, and degree of illness were obtained. Furthermore, initial vitals and laboratory values were collected via PostgreSQL 9.6.
The PAR was determined by preoperative platelet (×109/L)/serum albumin (mg/dL)/10.
The main event was the incidence of CSA-AKI, based on the KDIGO recommendation of serum creatinine in 48 hours,20 which means that serum creatinine increased by 0.3 mg/dL within 48 hours after cardiac surgery and the secondary objective of this research was in-hospital mortality.
Statistical Analysis
All analysis was done by R (version 4.1.0) program. The receiver operator characteristic curve (ROC) was utilized to assure the optimal cutoff value for all factors for CSA-AKI. Univariate and multivariable logistic and Cox regression analyses were applied to assure the predictive value for CSA-AKI and in-hospital mortality in patients who underwent CS. The least absolute shrinkage and selection operator (LASSO) regression and the recursive feature elimination for support vector machine (SVM-RFE) regression models were then applied to determine the significant differential factors associated with CSA-AKI.21,22 The predictive performance of the predictive nomogram for CSA-AKI was evaluated using C-index and calibration plots. Decision curve analysis (DCA) was used to the clinical benefits of the nomogram for CVS-AKI. A value of P < 0.05 was considered significant.
Results
Characteristics
Finally, 9700 individuals who undergone heart surgery were involved in this research. Of these, CSA-AKI happened in 4559 (72.9%) patients in the MIMIC database, 1883 (56.6%) patients in the eICU database, and 32 (26.9%) patients at our hospital. All patients were split into two groups by the PAR value (4.67) according to ROC. The baseline information is given in Table 1 and Supplemental Table 1.
Table 1.
Baseline Characteristics of All Patients
| Covariate | Training Cohort (n=4387) | Internal Validation Cohort (n=1866) | External Validation Cohort (n=3328) | ||||||
|---|---|---|---|---|---|---|---|---|---|
| Low PAR | High PAR | P value | Low PAR | High PAR | P value | Low PAR | High PAR | P value | |
| N | 1907 | 2480 | – | 803 | 1063 | – | 1096 | 2232 | – |
| Age, years | 69.3±11.9 | 69.5±12.4 | 0.538 | 69.4±12.3 | 70.0±11.8 | 0.286 | 68.6±12.3 | 68.4±12.8 | 0.698 |
| Gender, male, n (%) | 1332 (69.8) | 1688 (68.1) | 0.206 | 541 (67.4) | 724 (68.1) | 0.736 | 791 (72.2) | 1448 (64.9) | <0.001 |
| BMI (kg/m2) | 28.4±5.9 | 28.6±6.0 | 0.392 | 28.5±6.0 | 29.0±6.3 | 0.079 | 28.6±5.6 | 29.9±9.5 | <0.001 |
| Surgery type, n (%) | 0.417 | 0.860 | 0.473 | ||||||
| CAD | 1200 (62.9) | 1495 (60.3) | 505 (62.9) | 650 (61.1) | 613 (55.9) | 1379 (61.8) | |||
| Valvular | 483 (25.3) | 717 (28.9) | 192 (23.9) | 285 (26.8) | 391 (35.7) | 562 (25.2) | |||
| Others | 224 (11.8) | 268 (10.8) | 106 (13.2) | 128 (12.1) | 92 (8.4) | 291 (13.0) | |||
| Drugs | |||||||||
| ACEI/ARB, n (%) | 956 (50.1) | 1175 (47.4) | 0.071 | 381 (47.4) | 503 (47.3) | 0.956 | 525 (47.9) | 1071 (47.9) | 0.145 |
| β blockers, n (%) | 1804 (94.6) | 2332 (94.0) | 0.423 | 759 (94.5) | 980 (92.2) | 0.053 | 148 (13.5) | 355 (15.9) | 0.069 |
| Antibiotic, n (%) | 1631 (85.5) | 2273 (91.7) | <0.001 | 693 (86.3) | 961 (90.4) | 0.006 | 693 (63.2) | 1349 (60.4) | 0.558 |
| Statin, n (%) | 1556 (81.6) | 1971 (79.5) | 0.080 | 638 (79.5) | 854 (80.3) | 0.636 | 123 (11.2) | 265 (11.9) | 0.583 |
| NSAID, n (%) | 1893 (99.3) | 2448 (98.7) | 0.073 | 796 (99.1) | 1048 (98.6) | 0.185 | 884 (80.7) | 1628 (72.9) | 0.108 |
| PPI, n (%) | 770 (40.4) | 1086 (43.8) | 0.023 | 330 (41.1) | 466 (43.8) | 0.236 | 427 (39.0) | 1036 (46.4) | 0.091 |
| Interventions, n (%) | |||||||||
| MV use | 1517 (79.5) | 2145 (86.5) | <0.001 | 651 (81.1) | 903 (84.9) | 0.026 | 590 (53.8) | 1176 (52.7) | 0.534 |
| CRRT use | 15 (0.8) | 70 (2.8) | <0.001 | 9 (1.1) | 25 (2.4) | 0.049 | 43 (3.9) | 96 (4.3) | 0.609 |
| Vasopressors | 1300 (68.2) | 1882 (75.9) | <0.001 | 559 (69.6) | 807 (75.9) | 0.002 | 255 (23.3) | 533 (23.9) | 0.696 |
| Score system, points | |||||||||
| SOFA | 4.9±1.8 | 5.6±2.2 | <0.001 | 5.2±1.9 | 5.7±2.2 | <0.001 | 4.9±1.1 | 5.6±1.9 | <0.001 |
| OASIS | 29.9±7.8 | 31.8±8.3 | <0.001 | 30.6±8.0 | 31.7±8.2 | 0.005 | 27.1±8.9 | 27.0±9.1 | 0.940 |
| APSIII | 38.1±8.0 | 43.0±11.3 | <0.001 | 41.0±10.2 | 43.1±10.5 | 0.029 | 46.1±19.9 | 46.8±20.0 | 0.409 |
| Comorbidities, n (%) | |||||||||
| Hypertension | 1076 (56.4) | 1385 (55.8) | 0.703 | 461 (57.4) | 579 (54.5) | 0.206 | 741 (67.6) | 1512 (67.7) | 0.939 |
| Diabetes | 686 (36.0) | 897 (36.2) | 0.893 | 291 (36.2) | 398 (37.4) | 0.594 | 304 (27.7) | 770 (34.5) | <0.001 |
| CKD | 315 (16.5) | 441 (17.8) | 0.272 | 140 (17.4) | 215 (20.2) | 0.128 | 115 (10.5) | 216 (9.7) | 0.460 |
| Myocardial infarct | 755 (39.6) | 916 (36.9) | 0.073 | 322 (40.1) | 400 (37.6) | 0.278 | 185 (16.9) | 374 (16.8) | 0.929 |
| CHF | 631 (33.1) | 898 (36.2) | 0.032 | 274 (34.1) | 401 (37.7) | 0.109 | 227 (20.7) | 430 (19.3) | 0.325 |
| Liver disease | 58 (3.0) | 246 (5.9) | <0.001 | 27 (3.4) | 53 (5.0) | 0.087 | 9 (0.8) | 10 (0.4) | 0.179 |
| Charlson index | 5.5±1.3 | 5.6±1.3 | 0.070 | 5.5±1.2 | 5.7±1.3 | 0.190 | 1.5±0.7 | 1.5±0.6 | 0.948 |
| Laboratory results | |||||||||
| MAP, mmHg | 79.0±16.0 | 81.1±16.5 | <0.001 | 78.3±13.6 | 80.3±14.9 | 0.004 | 80.4±14.1 | 81.9±15.7 | |
| WBC, × 109/L | 11.6±3.6 | 12.4±3.1 | <0.001 | 11.7±3.3 | 12.3±3.5 | 0.018 | 9.6±4.5 | 10.2±5.1 | 0.001 |
| HGB, g/dL | 10.0±2.1 | 10.9±2.4 | <0.001 | 9.8±2.0 | 10.9±2.3 | <0.001 | 12.2±2.3 | 12.6±2.1 | <0.001 |
| PLT, × 109/L | 133.8±46.7 | 221.6±53.4 | <0.001 | 134.5±47.4 | 221.8±78.3 | <0.001 | 130.9±36.2 | 235.3±70.6 | <0.001 |
| Albumin, mg/dL | 3.7±0.6 | 3.2±0.6 | <0.001 | 3.7±0.6 | 3.3±0.6 | <0.001 | 3.6±0.6 | 3.4±0.6 | <0.001 |
| PAR | 3.4±0.7 | 6.9±2.4 | <0.001 | 3.6±0.7 | 6.9±1.6 | <0.001 | 3.7±0.8 | 7.1±2.6 | <0.001 |
| TBIL, mg/dL | 0.9±0.3 | 0.9±0.4 | 0.092 | 0.9±0.3 | 0.9±0.4 | 0.680 | 0.9±0.3 | 0.8±0.3 | <0.001 |
| Bicarbonate, mEq/L | 23.3±3.0 | 23.4±3.7 | 0.227 | 23.1±3.0 | 23.2±3.8 | 0.259 | 25.0±3.4 | 25.4±3.4 | 0.001 |
| BUN, mg/dL | 20.0±7.9 | 22.7±8.0 | <0.001 | 20.3±3.7 | 22.9±5.4 | <0.001 | 19.3±10.1 | 22.7±9.2 | <0.001 |
| Creatinine, mg/dL | 1.1±0.3 | 1.2±0.3 | 0.002 | 1.1±0.3 | 1.2±0.4 | 0.045 | 1.0±0.4 | 1.2±0.4 | <0.001 |
| Glucose, mg/dL | 129.9±49.9 | 143.4±50.4 | <0.001 | 132.4±58.7 | 146.4±62.4 | <0.001 | 133.2±51.0 | 140.9±57.2 | 0.001 |
| PT, s | 15.7±4.0 | 15.1±3.8 | 0.001 | 15.8±4.4 | 15.2±6.1 | 0.019 | 14.4±4.0 | 14.1±5.7 | 0.120 |
| INR | 1.4±0.5 | 1.3±0.4 | 0.001 | 1.4±0.4 | 1.4±0.5 | 0.015 | 1.3±0.4 | 1.2±0.5 | 0.031 |
| Potassium, mmol/L | 4.3±0.5 | 4.3±0.7 | 0.560 | 4.3±0.6 | 4.3±0.7 | 0.841 | 4.1±0.5 | 4.1±0.5 | 0.851 |
| Sodium, mmol/L | 138.7±3.3 | 138.3±3.8 | <0.001 | 138.7±3.5 | 138.1±3.8 | 0.001 | 138.9±3.6 | 137.8±4.0 | <0.001 |
| AKI stages, n (%) | <0.001 | <0.001 | <0.001 | ||||||
| No AKI | 819 (42.9) | 399 (16.1) | 305 (38.0) | 172 (16.2) | 546 (49.8) | 899 (40.3) | |||
| Stage I | 378 (19.8) | 685 (27.6) | 156 (19.4) | 287 (27.0) | 268 (24.5) | 722 (32.3) | |||
| Stage II | 623 (32.7) | 1089 (43.9) | 297 (37.0) | 484 (45.5) | 233 (21.3) | 493 (22.1) | |||
| Stage III | 87 (4.6) | 307 (12.4) | 45 (5.6) | 120 (11.3) | 49 (4.5) | 118 (5.3) | |||
| LOS, days | 7.3 (5.4,10.1) | 7.9 (5.7,11.9) | <0.001 | 7.9 (5.7,11.9) | 8.0 (5.7,12.0) | <0.001 | 7.6 (5.4,11.8) | 7.6 (5.4, 11.9) | 0.929 |
| Death, n (%) | 19 (1.0) | 129 (5.2) | <0.001 | 8 (1.0) | 40 (3.8) | <0.001 | 38 (3.5) | 141 (6.3) | 0.001 |
Abbreviations: PAR, platelet-to-albumin ratio; BMI, body mass index; CAD, coronary artery bypass; ACEI/ARB, angiotensin converting enzyme inhibitors/angiotensin receptor blocker; NSAID, non-steroidal anti-inflammatory drugs; PPI, proton pump inhibitors; MV, mechanical ventilation; CRRT, continuous renal replacement therapy; SOFA, sequential organ failure assessment; OASIS, Oxford Acute Severity of Illness Score; APSIII, Acute Physiology Score III; SAPS II, Simplified Acute Physiology Score II; CKD, chronic kidney disease; CHF, congestive heart failure; MAP, mean arterial pressure; WBC, white blood cell; HGB, hemoglobin; PLT, platelet; TBIL, total bilirubin; BUN, blood urea nitrogen; PT, prothrombin time; INR, international normalized ratio; AKI, acute kidney injury; LOS, length of hospital.
PAR for the Incident CSA-AKI
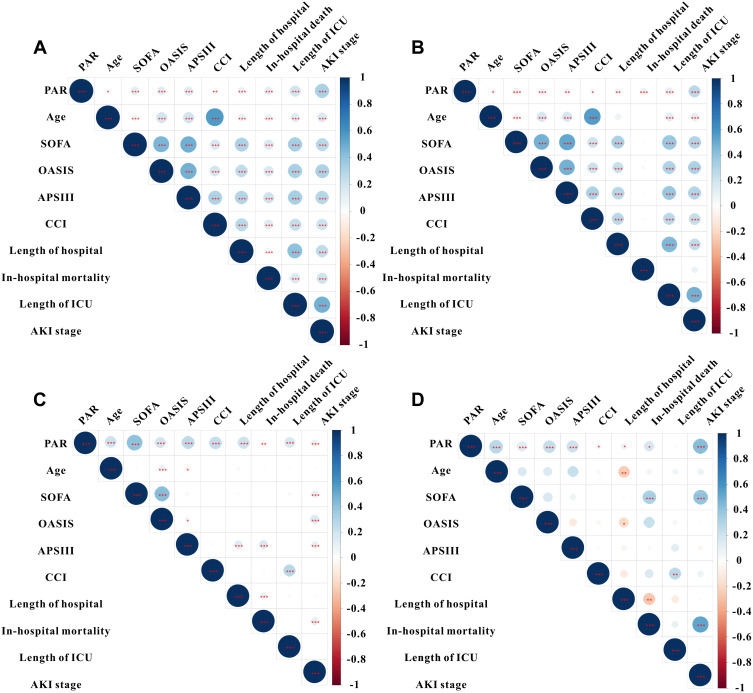
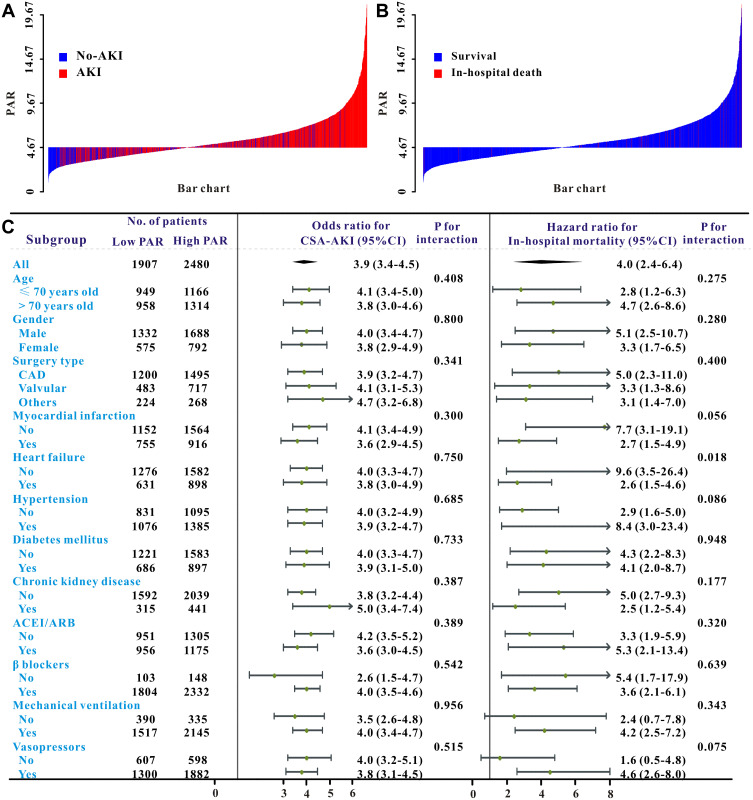
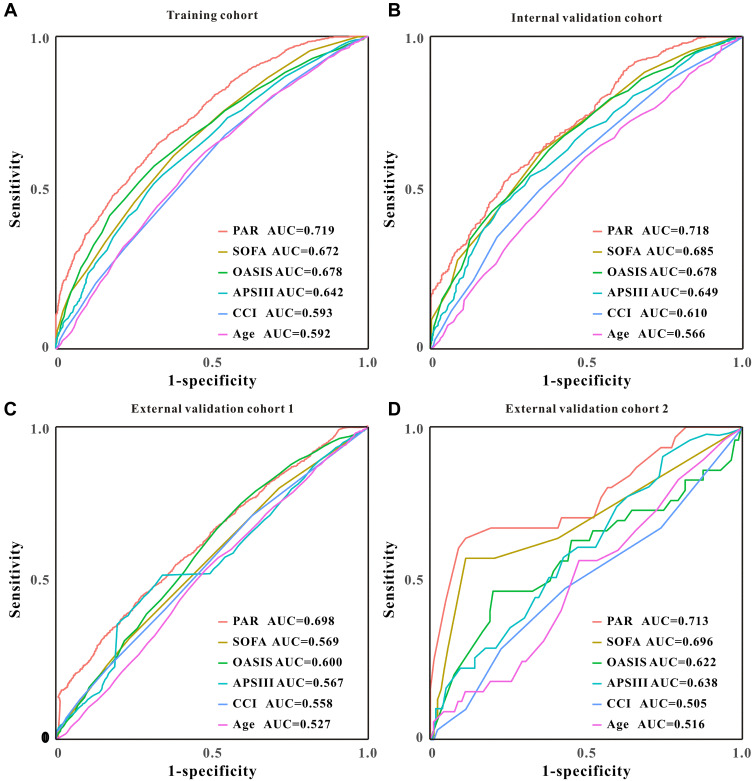
As described in Figure 1A–D, the level of PAR was significantly correlated with severity scores as well as clinical outcomes in the training set and in the validation sets. The PAR value for each patient in the training set presented as a waterfall plot demonstrated significant differences between AKI and No-AKI (P < 0.001, Figure 2A). After correcting for other clinical variables, PAR was remained strong for the incident CSA-AKI (odds ratio, OR = 4.02, 95% CI 3.41–4.75, P < 0.001) by multivariate logistic regression. Moreover, in the pre-specified subgroup analysis, patients with PAR < 4.67 had a lower risk of CSA-AKI than those with PAR ≥ 4.67 group in all subgroups (Figure 2C). Similar results had also been found in the external validation cohort 1 (Table 2 and Supplemental Figure 1A–C). Furthermore, PAR showed a rather strong predictive value for CSA-AKI in all cohorts, with the area under the ROC (AUC) being 0.719 (95% CI 0.706–0.732), 0.718 (95% CI 0.697–0.738), 0.698 (95% CI 0.680–0.716), and 0.713 (95% CI 0.686–0.800), respectively (Figure 3A–D).
Figure 1.
The relationship between PAR and severity scores, and clinical outcomes in the training set (A), internal validation set (B), external validation set 1 (C) and external validation set 2 (D).
Figure 2.
The waterfall plots of PAR value for each patient for AKI (A) and in-hospital mortality (B) and the forest plot revealed the results of subgroup analysis for AKI and in-hospital mortality based on low and high TTEI groups in the training cohort (C).
Table 2.
Univariate and Multivariate Logistic Regression Analysis for CSA-AKI
| Training Set | Internal Validation Set | External Validation Set | External Validation Set 2 | |||||
|---|---|---|---|---|---|---|---|---|
| OR (95% CI) | P value | OR (95% CI) | P value | OR (95% CI) | P value | OR (95% CI) | P value | |
| Unadjusted | 3.93 (3.41–4.52) | <0.001 | 3.17 (2.56–3.94) | <0.001 | 1.47 (1.27–1.70) | <0.001 | 4.29 (2.19–12.81) | <0.001 |
| Model 1 | 4.23 (3.65–4.90) | <0.001 | 3.25 (2.59–4.07) | <0.001 | 1.47 (1.26–1.71) | <0.001 | 3.88 (1.95–12.25) | 0.001 |
| Model 2 | 3.91 (3.23–4.44) | <0.001 | 3.17 (2.50–4.02) | <0.001 | 1.45 (1.24–1.77) | <0.001 | 3.68 (1.65–13.23) | 0.004 |
| Model 3 | 3.79 (1.56–2.69) | <0.001 | 3.26 (2.55–4.17) | <0.001 | 1.62 (1.38–1.89) | <0.001 | 3.27 (1.60–17.42) | 0.006 |
| Model 4 | 4.02 (3.41–4.75) | <0.001 | 3.55 (2.74–4.61) | <0.001 | 1.66 (1.41–1.96) | <0.001 | 3.28 (1.70–31.26) | 0.008 |
Notes: Model 1 adjusted for age, gender, body mass index, surgery type. Model 2 adjusted for model 1 plus comorbidities, drugs and interventions. Model 3 adjusted for Model 2 plus score system and Charlson index. Model 4 adjusted for model 3 plus laboratory results except for platelet and serum albumin.
Abbreviations: AKI, acute kidney injury; OR, odds ratio; 95% CI, 95% confidence index.
Figure 3.
The ROC analysis of PAR and other clinical factors for CSA-AKI in the training set (A), internal validation set (B), external validation set 1 (C) and external validation set 2 (D).
PAR as a Predictor for In-Hospital Mortality
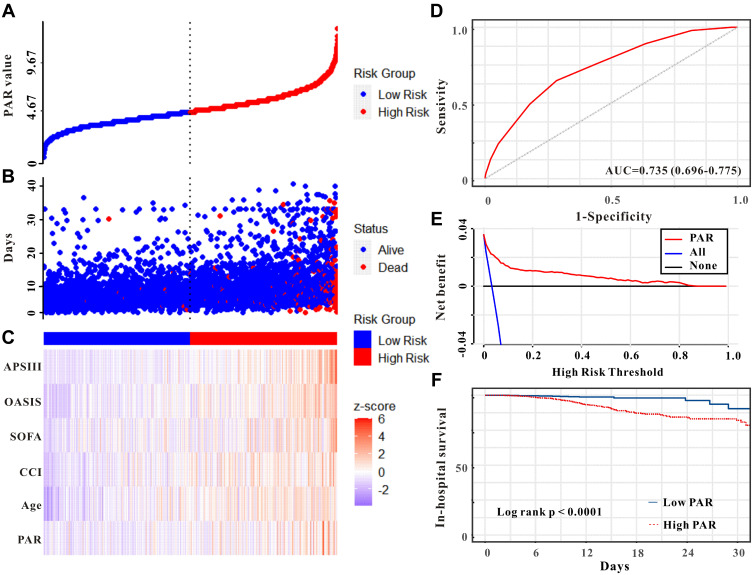
The PAR value for each patient in the training set presented as a waterfall plot demonstrated significant differences between survival and in-hospital death patients (P < 0.001, Figure 2B). Based on the cut-off value (4.67), PAR was determined to divide into high-risk group and low-risk group for in-hospital mortality (Figure 4A–C). The AUC of PAR for in-hospital mortality was 0.735 (Figure 4D). Decision curve analysis (DCA) found that PAR was clinical useful for clinicians (Figure 4E). The high-PAR group had a worse prognosis for patients with CS than the lower PAR group (Figure 4F, P < 0.0001). Similar results also found in the external validation cohort 1 (Supplemental Figure 2).
Figure 4.
The PAR value was established to detect the in-hospital mortality of patients who underwent CS in the training set. All patients were distinguished into high and low risk based on the PAR (A), the relationship between survival time and prognosis of patients in the two corresponding groups (B), and the heatmap of severity scores, clinical factors, and PAR between the two groups (C). ROC curve analysis of the PAR for in-hospital mortality (D). Decision curve analysis of the PAR for in-hospital mortality (E). Kaplan–Meier curves showing the in-hospital mortality of groups with the PAR group (F).
The high-PAR patients had greater mortality, with a crude hazard ratio (HR) of 3.96 (95% CI, 2.44–6.41, P < 0.001) and the connection maintained robust after adjustment for other risk variables (Table 3). And in the pre-specified subgroup analysis, patients with PAR < 4.67 had a lower risk of in-hospital than those with PAR ≥ 4.67 group in almost all subgroups (Figure 2C). Furthermore, patients in the validation groups exhibited comparable findings, which revealed that PAR had an independent effect on critical care patients.
Table 3.
Univariate and Multivariate Cox Regression Analysis for In-Hospital Mortality
| Training Cohort | Internal Validation Cohort | External Validation Cohort | External Validation Set 2 | |||||
|---|---|---|---|---|---|---|---|---|
| HR (95% CI) | P value | HR (95% CI) | P value | HR (95% CI) | P value | HR (95% CI) | P value | |
| Unadjusted | 3.96 (2.44–6.41) | <0.001 | 3.26 (1.53–7.00) | 0.002 | 1.91 (1.33–2.73) | <0.001 | 4.13 (1.09–15.59) | 0.037 |
| Model 1 | 3.93 (2.42–6.38) | <0.001 | 3.24 (1.51–6.93) | 0.003 | 2.02 (1.41–2.90) | <0.001 | 4.52 (1.14–17.96) | 0.032 |
| Model 2 | 2.88 (1.76–4.72) | <0.001 | 3.47 (1.62–7.45) | 0.001 | 1.96 (1.36–2.83) | <0.001 | 4.44 (1.10–21.02) | 0.038 |
| Model 3 | 2.64 (1.61–4.35) | <0.001 | 3.56 (1.66–7.66) | 0.001 | 1.97 (1.35–2.88) | <0.001 | 4.16 (1.05–26.57) | 0.044 |
| Model 4 | 2.41 (1.44–4.03) | 0.001 | 3.55 (1.60–7.87) | 0.002 | 2.02 (1.37–2.97) | <0.001 | 3.27 (0.94–45.57) | NS |
Notes: Model 1 adjusted for age, gender, body mass index, surgery type. Model 2 adjusted for model 1 plus comorbidities, drugs and interventions. Model 3 adjusted for Model 2 plus score system and Charlson index. Model 4 adjusted for model 3 plus laboratory results except for platelet and serum albumin.
Abbreviations: HR, hazard ratio; 95% CI, 95% confidence index; NS, not significant.
Development and Verification of the Nomogram
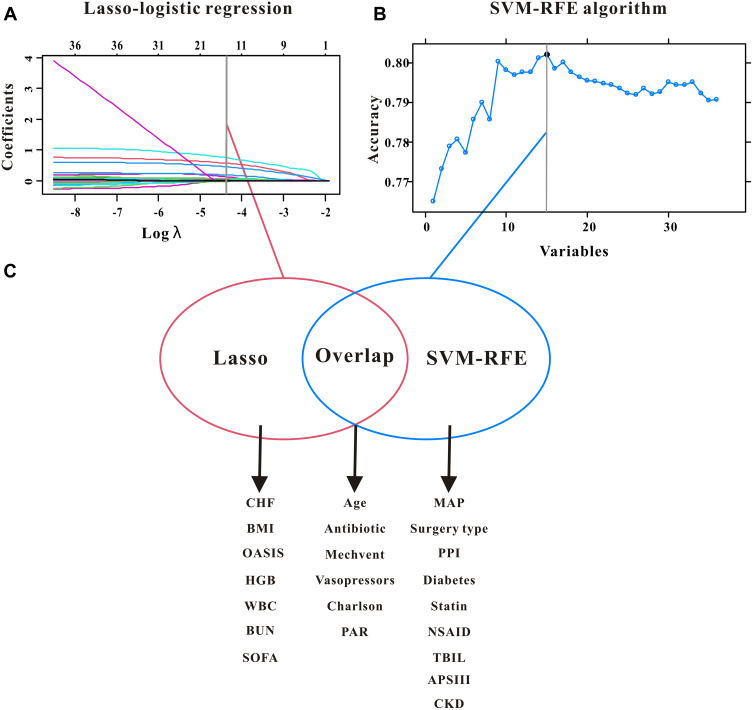
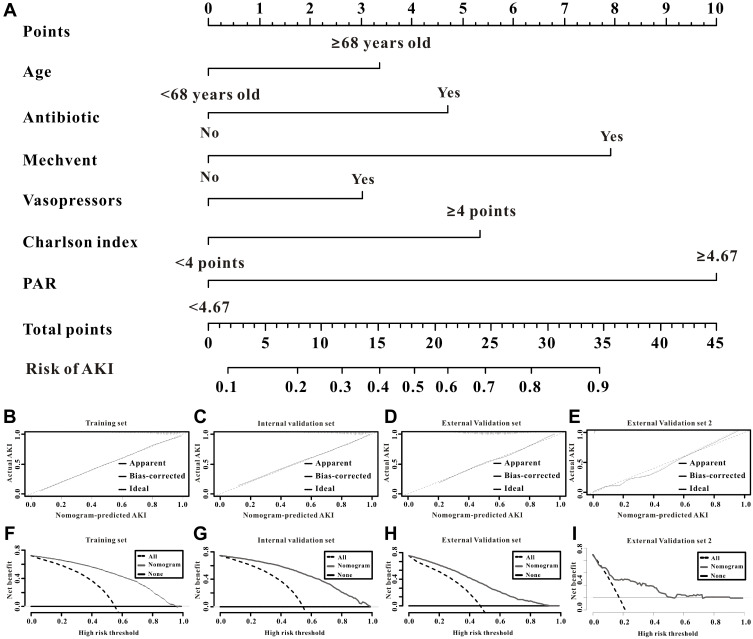
The factors both were included in this projected model. As displayed in the Figure 5A–C, we found that age, Charlson comorbidity index (CCI), utilization of antibiotics, mechanical ventilation and vasopressors, and PAR were picked by LASSO regression and SVM-RFE and then, these factors were included in this projected model (Figure 6A). Furthermore, the C-index of the nomogram for CSA-AKI was 0.821 (95% CI 0.807–0.834), 0.808 (95% CI 0.787–0.829), 0.745 (95% CI 0.728–0.762), and 0.826 (0.753–0.899) in these cohorts, respectively; thus, this nomogram was relatively discriminative for patients with or without CSA-AKI. The calibration curves also indicated that this nomogram had a great calibration in all cohorts (Figure 6B–E). Finally, DCA demonstrated that this prediction model was effective in clinical practice (Figure 6F–I).
Figure 5.
LASSO Cox regression (A), SVM-RFE model (B), and the overlapping features for the selection of independent factors for CSA-AKI (C).
Figure 6.
The established nomogram for CSA-AKI (A), the calibration curves of the nomogram for CSA-AKI in the test set (B), the internal validation group (C), the external validation cohort (D) and the external validation cohort 2 (E). And DCA curves of the nomogram for CSA-AKI in the test set (F), internal validation group (G), in the external validation cohort (H), and the external validation cohort 2 (I).
Discussion
In this research, we established a good correlation between PAR and CSA-AKI and prognosis for CS patients. The cutoff value of 4.67 was a good threshold for the risk of CSA-AKI and prognosis of patients in almost all subgroups. We further developed a predictive nomogram for CSA-AKI integrating PAR and other clinical factors with great calibration, discrimination, and clinically useful. Taking together, those results suggest that PAR was a reliable marker for CSA-AKI and the prognosis of patients in ICU, and the proposed nomogram based on PAR resulted in an accurate prediction for the recognition of patients with CSA-AKI.
CSA-AKI is one of the most common essential consequences following CS, and the morbidity rate of CSA-AKI varies from 5% to 42% in general medicine.23,24 Tseng et al did a retrospective analysis of 671 CS patients and discovered that the incidence of CSA-AKI was 24.3% (163/671).25 Similarly, another monocentric study of 1900 patients with CS also demonstrated that the postoperative AKI was 49.1%.26 The CSA-AKI in this study was 71.7%, which was higher and might at least partly be explained by differences in patient populations and severity of the disease. Cardiac surgery patients especially in ICU may experience postoperative hemodynamic instability, which may be another reason for the high AKI rate. Moreover, the incidence of CSA-AKI in our hospital was relatively lower than MIMIC database or eICU database, we might attribute this lower rate to the types of cardiac surgery and the severity of the disease.
Plenty of previous studies have indicated that serum albumin may be closely associated with inflammation.27,28 In addition, PAR, which is calculated by the ratio of platelet and serum albumin, has recently been advocated as an exquisite and reliable index for systemic inflammation and the condition of immune nutrition.14 This is mainly because the PAR is more stable in varieties of physiological and/or diseases than platelet and serum albumin components individually. Moreover, PAR, which is a combination of platelet and serum albumin, could more exactly behalf of the condition of the inflammation and nutrition, all of them may play an important role in the initiation, development, and prognosis of AKI.15 Guo et al investigated the connection between preoperative PAR and the outcomes of 198 non-small-cell lung cancer who underwent primary resection and concluded that preoperative PAR was a useful prognostic biomarker for poor overall survival.29 Another study also demonstrated that PAR was a significant marker of lymph node metastasis for gastric cancer patients.16 Despite the prognostic value for cancer patients, Gui et al also concluded that PAR played an important role in thrombocytopenia syndrome patients.30 In the current study, we firstly applied PAR for AKI and obtained great diagnostic correlations. Moreover, platelet and serum albumin are easily accessible and inexpensive in clinical practice. We combined platelet and serum albumin for the first time and found that the C-index of PAR was better than platelet or serum albumin in all sets. More importantly, the measurements of platelet and serum albumin were easily accessible at admission, enabling clinicians to promptly determine patients at high risk of AKI and thus intervene earlier to improve clinical outcomes.
Considering the easily accessible benefit of nomogram, which might be more commodious for physicians to determine the diagnosis or prognosis of the specific patient,31 we constructed a nomogram that combines the PAR and the clinical features of pretreatment factors to make the prediction of CSA-AKI more precise, and then, doctors can judge whether and when the prevention might be conducted for high risk of CSA-AKI patients. Happily, in the present investigation, our nomogram displayed high predictive value for CSA-AKI in all cohorts.
However, there were significant limitations in this retrospective investigation. Firstly, this retrospective analysis was retrieved from public databases, which may result in many inherent or selective biases. Secondly, only the PAR value before surgery was included in this research and we did not analyze changes of them throughout their hospital hospitalization. Thirdly, there were several relevant variables, such as cardiopulmonary bypass time, embolism, nephrotoxins, and so on, were omitted in this investigation owing to the constraint of the database. Moreover, several inflammatory indicators, procalcitonin, interleukin, and so on, did not include in the database; therefore we did not assess the association between PAR and inflammatory indicators. Finally, this was a retrospective research and additional investigations are needed to corroborate our results.
Conclusions
In the present research, we firstly revealed that the PAR, which is simple access and cost-effective parameter, might operate as a reliable marker for CSA-AKI and prognosis of patients who underwent CS. Moreover, the predictive nomogram generated by integrating the PAR and other beneficial clinical features could potentially be a convenient and effective method for identifying patients at high risk of AKI following CS.
Institutional Review Board Statement
The authors are accountable for all aspects of the work in ensuring that questions related to the accuracy or integrity of any part of the work are appropriately investigated and resolved. The study was conducted by the Declaration of Helsinki (as revised in 2013). All information from the MIMIC database is available and free for the public; this research was authorized by the Ethics Committee of the First People’s Hospital of Jiangxia district of Wuhan city, and the informed consent was waived.
Data Sharing Statement
All data used in this study are available from the corresponding author on a reasonable request.
Informed Consent Statement
Patient consent was waived due to the reason that this was a retrospective observational study and did not add any costs to patients or do any harm to them.
Author Contributions
All authors made substantial contributions to conception and design, acquisition of data, or analysis and interpretation of data; took part in drafting the article or revising it critically for important intellectual content; agreed to submit it to the current journal; gave final approval of the version to be published; and agreed to be accountable for all aspects of the work.
Disclosure
The authors declared that there is no conflicts of interest.
References
- 1.Harky A, Joshi M, Gupta S, Teoh WY, Gatta F, Snosi M. Acute kidney injury associated with cardiac surgery: a comprehensive literature review. Braz J Cardiovasc Surg. 2020;35:211–224. doi: 10.21470/1678-9741-2019-0122 [DOI] [PMC free article] [PubMed] [Google Scholar]
- 2.Wang Y, Bellomo R. Cardiac surgery-associated acute kidney injury: risk factors, pathophysiology and treatment. Nat Rev Nephrol. 2017;13:697–711. doi: 10.1038/nrneph.2017.119 [DOI] [PubMed] [Google Scholar]
- 3.Kullmar M, Zarbock A, Engelman DT, Chatterjee S, Wagner NM. Prevention of acute kidney injury. Crit Care Clin. 2020;36:691–704. doi: 10.1016/j.ccc.2020.07.002 [DOI] [PubMed] [Google Scholar]
- 4.Hu Y, Liu H, Fu S, Wan J, Li X. Red blood cell distribution width is an independent predictor of AKI and mortality in patients in the coronary care unit. Kidney Blood Press Res. 2017;42:1193–1204. doi: 10.1159/000485866 [DOI] [PubMed] [Google Scholar]
- 5.Ostermann M, Liu K, Kashani K. Fluid management in acute kidney injury. Chest. 2019;156:594–603. doi: 10.1016/j.chest.2019.04.004 [DOI] [PubMed] [Google Scholar]
- 6.Finfer S, Myburgh J, Bellomo R. Intravenous fluid therapy in critically ill adults. Nat Rev Nephrol. 2018;14:541–557. doi: 10.1038/s41581-018-0044-0 [DOI] [PubMed] [Google Scholar]
- 7.Hu Y, Zhou J, Cao Q, et al. Utilization of echocardiography after acute kidney injury was associated with improved outcomes in patients in intensive care unit. Int J Gen Med. 2021;14:2205–2213. doi: 10.2147/IJGM.S310445 [DOI] [PMC free article] [PubMed] [Google Scholar]
- 8.Poston JT, Koyner JL. Sepsis associated acute kidney injury. BMJ. 2019;364:k4891. doi: 10.1136/bmj.k4891 [DOI] [PMC free article] [PubMed] [Google Scholar]
- 9.Rabb H, Griffin MD, McKay DB, et al. Inflammation in AKI: current understanding, key questions, and knowledge gaps. J Am Soc Nephrol. 2016;27:371–379. doi: 10.1681/ASN.2015030261 [DOI] [PMC free article] [PubMed] [Google Scholar]
- 10.Hu Y, Cao Q, Wang H, et al. Prognostic nutritional index predicts acute kidney injury and mortality of patients in the coronary care unit. Exp Ther Med. 2021;21:123. doi: 10.3892/etm.2020.9555 [DOI] [PMC free article] [PubMed] [Google Scholar]
- 11.Andrade-Oliveira V, Foresto-Neto O, Watanabe I, Zatz R, Camara N. Inflammation in renal diseases: new and old players. Front Pharmacol. 2019;10:1192. doi: 10.3389/fphar.2019.01192 [DOI] [PMC free article] [PubMed] [Google Scholar]
- 12.Engin M. Are pre and postoperative platelet to lymphocyte ratio and neutrophil to lymphocyte ratio associated with early postoperative AKI following CABG? Braz J Cardiovasc Surg. 2020;35:239. doi: 10.21470/1678-9741-2019-0482 [DOI] [PMC free article] [PubMed] [Google Scholar]
- 13.Shen Y, Huang X, Zhang W. Platelet-to-lymphocyte ratio as a prognostic predictor of mortality for sepsis: interaction effect with disease severity-A retrospective study. BMJ Open. 2019;9:e22896. doi: 10.1136/bmjopen-2018-022896 [DOI] [PMC free article] [PubMed] [Google Scholar]
- 14.Shirai Y, Shiba H, Haruki K, et al. Preoperative platelet-to-albumin ratio predicts prognosis of patients with pancreatic ductal adenocarcinoma after pancreatic resection. Anticancer Res. 2017;37:787–793. doi: 10.21873/anticanres.11378 [DOI] [PubMed] [Google Scholar]
- 15.Haksoyler V, Topkan E. High pretreatment platelet-to-albumin ratio predicts poor survival results in locally advanced nasopharyngeal cancers treated with chemoradiotherapy. Ther Clin Risk Manag. 2021;17:691–700. doi: 10.2147/TCRM.S320145 [DOI] [PMC free article] [PubMed] [Google Scholar]
- 16.Huang C, Xia YQ, Xiao L, Huang J, Zhu ZM. Combining the platelet-to-albumin ratio with serum and pathologic variables to establish a risk assessment model for lymph node metastasis of gastric cancer. J Biol Regul Homeost Agents. 2021;35:811–817. doi: 10.23812/20-626-L [DOI] [PubMed] [Google Scholar]
- 17.Zhou S, Zeng Z, Wei H, Sha T, An S. Early combination of albumin with crystalloids administration might be beneficial for the survival of septic patients: a retrospective analysis from MIMIC-IV database. Ann Intensive Care. 2021;11:42. doi: 10.1186/s13613-021-00830-8 [DOI] [PMC free article] [PubMed] [Google Scholar]
- 18.Pollard TJ, Johnson A, Raffa JD, Celi LA, Mark RG, Badawi O. The eICU Collaborative Research Database, a freely available multi-center database for critical care research. Sci Data. 2018;5:180178. doi: 10.1038/sdata.2018.178 [DOI] [PMC free article] [PubMed] [Google Scholar]
- 19.Li L, Zou G, Liu J. Preoperative glucose-to-lymphocyte ratio is an independent predictor for acute kidney injury after cardiac surgery in patients in intensive care unit. Int J Gen Med. 2021;14:6529–6537. doi: 10.2147/IJGM.S335896 [DOI] [PMC free article] [PubMed] [Google Scholar]
- 20.Kellum JA, Lameire N. Diagnosis, evaluation, and management of acute kidney injury: a KDIGO summary (Part 1). Crit Care. 2013;17:204. doi: 10.1186/cc11454 [DOI] [PMC free article] [PubMed] [Google Scholar]
- 21.Hu JY, Wang Y, Tong XM, Yang T. When to consider logistic LASSO regression in multivariate analysis? Eur J Surg Oncol. 2021;47:2206. doi: 10.1016/j.ejso.2021.04.011 [DOI] [PubMed] [Google Scholar]
- 22.Lin X, Li C, Zhang Y, Su B, Fan M, Wei H. Selecting Feature Subsets Based on SVM-RFE and the Overlapping Ratio with Applications in Bioinformatics. Molecules. 2017;23:5. [DOI] [PMC free article] [PubMed] [Google Scholar]
- 23.Ishikawa M, Iwasaki M, Namizato D, et al. The neutrophil to lymphocyte ratio and serum albumin as predictors of acute kidney injury after coronary artery bypass grafting. Sci Rep. 2022;12:15438. [DOI] [PMC free article] [PubMed] [Google Scholar]
- 24.Chen JJ, Kuo G, Fan PC, et al. Neutrophil-to-lymphocyte ratio is a marker for acute kidney injury progression and mortality in critically ill populations: a population-based, multi-institutional study. J Nephrol. 2022;35:911–920. doi: 10.1007/s40620-021-01162-3 [DOI] [PMC free article] [PubMed] [Google Scholar]
- 25.Tseng PY, Chen YT, Wang CH, et al. Prediction of the development of acute kidney injury following cardiac surgery by machine learning. Crit Care. 2020;24:478. doi: 10.1186/s13054-020-03179-9 [DOI] [PMC free article] [PubMed] [Google Scholar]
- 26.Guan C, Li C, Xu L, et al. Risk factors of cardiac surgery-associated acute kidney injury: development and validation of a perioperative predictive nomogram. J Nephrol. 2019;32:937–945. doi: 10.1007/s40620-019-00624-z [DOI] [PubMed] [Google Scholar]
- 27.Arroyo V, Garcia-Martinez R, Salvatella X. Human serum albumin, systemic inflammation, and cirrhosis. J Hepatol. 2014;61:396–407. doi: 10.1016/j.jhep.2014.04.012 [DOI] [PubMed] [Google Scholar]
- 28.Li T, Li X, Wei Y, et al. Predictive value of c-reactive protein-to-albumin ratio for neonatal sepsis. J Inflamm Res. 2021;14:3207–3215. doi: 10.2147/JIR.S321074 [DOI] [PMC free article] [PubMed] [Google Scholar]
- 29.Guo M, Sun T, Zhao Z, Ming L. Preoperative platelet to albumin ratio predicts outcome of patients with non-small-cell lung cancer. Ann Thorac Cardiovasc Surg. 2021;27:84–90. doi: 10.5761/atcs.oa.20-00090 [DOI] [PMC free article] [PubMed] [Google Scholar]
- 30.Gui Y, Xu Y, Yang P. Predictive value of the Platelet-to-Albumin Ratio (PAR) on the risk of death at admission in patients suffering from severe fever with thrombocytopenia syndrome. J Inflamm Res. 2021;14:5647–5652. doi: 10.2147/JIR.S335727 [DOI] [PMC free article] [PubMed] [Google Scholar]
- 31.Balachandran VP, Gonen M, Smith JJ, DeMatteo RP. Nomograms in oncology: more than meets the eye. Lancet Oncol. 2015;16:e173–e180. doi: 10.1016/S1470-2045(14)71116-7 [DOI] [PMC free article] [PubMed] [Google Scholar]


