

Abstract
Uncovering genotype-phenotype relationships is a fundamental challenge in genomics. Gene prioritization is an important step for this endeavor to make a short manageable list from a list of thousands of genes coming from high-throughput studies. Network propagation methods are promising and state of the art methods for gene prioritization based on the premise that functionally related genes tend to be close to each other in the biological networks. Recently, we introduced PhenoGeneRanker, a network-propagation algorithm for multiplex heterogeneous networks. PhenoGeneRanker allows multi-layer gene and phenotype networks. It also calculates empirical p values of gene and phenotype ranks using random stratified sampling of seeds of genes and phenotypes based on their connectivity degree in the network. In this study, we introduce the PhenoGeneRanker Bioconductor package and its application to multi-omics rat genome datasets to rank hypertension disease-related genes and strains. We showed that PhenoGeneRanker performed better to rank hypertension disease-related genes using multiplex gene networks than aggregated gene networks. We also showed that PhenoGeneRanker performed better to rank hypertension disease-related strains using multiplex phenotype network than single or aggregated phenotype networks. We performed a rigorous hyperparameter analysis and, finally showed that Gene Ontology (GO) enrichment of statistically significant top-ranked genes resulted in hypertension disease-related GO terms.
Index Terms—: Bioinformatics, genetic networks, complex networks, random walk with restart, hypertension, rat model
1. Introduction
Identifying the causal relationship between a gene and complex trait is a challenging problem in functional genomics as their relationship relies on complex and nonlinear interactions of molecular entities [1]. The phenotypic outcome of the genotypic effect is the result of biological activities that involve the coordinated expression and interaction of proteins or nucleic acids [2]. There are multiple layers of biological processes between genotypic effects to phenotypic outcomes, such as epigenome, transcriptome, proteome, and metabolome that could alter the genotypic effects in many ways.
To represent the multilayered molecular basis of complex traits, biological networks have been utilized extensively [3]. These networks also facilitate data integration, which is a useful technique to capture the nonlinear interactions of molecular variations from different layers of biological processes while avoiding the limitations and biases of single data types [4], [5]. Each interactome data type could represent a different aspect of the genotype-phenotype relationship. For instance, physical interactome data such as protein-protein interactions (PPI) might have many non-functional and missing true interactions, therefore they are usually complemented by functional interactions [6]. Integrative network models can incorporate datasets from multiple modalities to provide a more comprehensive framework to capture the underlying biology. Analysis of such networks is a powerful approach to demystify the complexity of multilayered molecular interactions and elucidate the genotype-phenotype relationship.
Thousands of candidate genes are usually reported to be potentially related to a complex trait by using high-through-put experimental studies such as genome-wide association studies (GWAS). Gene prioritization is essential to shorten a list of thousands of candidate genes into a smaller most probable gene list to facilitate experimental testing [7]. Network propagation methods are promising and state of the art methods for gene prioritization based on the premise that functionally related genes tend to be close to each other in biological networks such as co-expression, PPI and biological pathways [8].
A number of network propagation-based gene prioritization algorithms were previously developed [9], [10], [11], [12], [13], [14], [15], [16]. Among those, random walk with restart (RWR) algorithms are known to utilize both underlying global network topology and closeness to the known nodes in the network with its restarting property [8].
Recently, a new random walk algorithm called Random Walk with Restart on Multiplex Heterogeneous Networks (RWR-MH) has been developed [17] as an extension to RWR in heterogeneous networks [18]. RWR-MH performs RWR on a multilayered gene network, which is connected to a single-layer disease similarity network and ranks disease-associated genes based on a set of known disease-associated genes.
Although RWR-MH can utilize multiple gene layers, it can utilize only one layer of phenotype network. Furthermore, bias toward highly connected nodes in the network is a known artifact of the RWR algorithm [8], [10].
To address these limitations, we recently developed PhenoGeneRanker, an RWR algorithm to rank genes and phenotypes using multiple layers of both genes and phenotypes (Fig. 1) [19]. PhenoGeneRanker generates empirical p values for gene and phenotype rankings to account for the bias of the RWR algorithm toward high-degree nodes. In this study, we developed a Bioconductor package for PhenoGeneRanker, and to assess the performance of PhenoGeneRanker we applied it to multidimensional rat (Rattus norvegicus) datasets of genes and phenotypes to prioritize the hypertension disease-related rat genes. Also, we rigorously analyzed the effects of its hyperparameters on gene and phenotype prioritization performance.
Fig. 1.
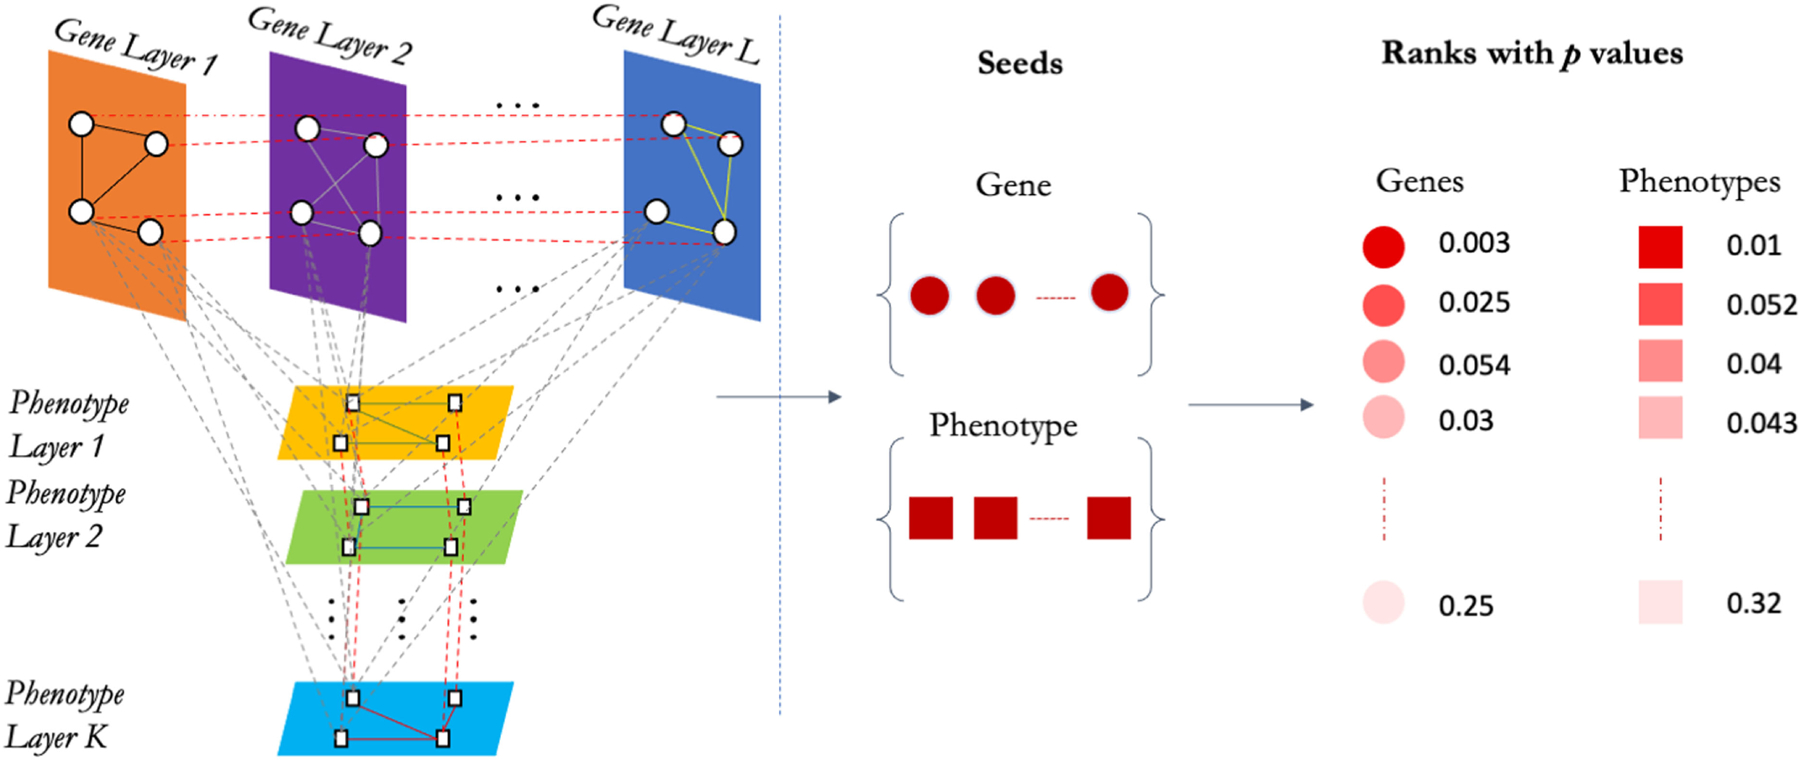
Framework of PhenoGeneRanker. First, PhenoGeneRanker creates the transition matrix of multiplex heterogeneous network using L gene layers and K phenotype layers. In the second step, PhenoGeneRanker ranks the genes and phenotypes using the provided seed genes and phenotypes by running RWR on multiplex heterogeneous network of genes and phenotypes. Then, PhenoGeneRanker generates p values of the ranks by using random gene and phenotype seeds generated via stratified random sampling based on the degree of gene and phenotype nodes.
PhenoGeneRanker Bioconductor package can be accessed on https://bioconductor.org/packages/PhenoGeneRanker/
2. Methods
2.1. PhenoGeneRanker
PhenoGeneRanker is a computational tool that utilizes an RWR algorithm on multiplex heterogeneous networks to rank disease-specific genes and phenotypes. RWR is a type of network propagation algorithm where the information from pre-specified seed node(s) diffuses through the edges of the nodes on the underlying network. RWR on a heterogeneous network was developed to enable random walk by connecting two types of networks, namely disease and protein networks, by establishing bipartite relations between diseases and proteins using disease-associated gene mutations [18].
Li and Patra proposed an RWR approach for heterogeneous networks where they connected a gene network to a phenotype network with a bipartite network of genes and phenotypes [20]. They represent gene, phenotype and bipartite networks with adjacency matrices AG, AP and B, respectively. The adjacency matrix of the heterogeneous network is then represented as matrix A.
| (1) |
B and its transpose BT represents the bipartite connections between gene-phenotype and phenotype-gene networks, respectively. The matrix A is then normalized to create a transition matrix (walk matrix) W.
| (2) |
In Eq. (2), WG and WP represent the transition matrices within gene and phenotype networks, respectively, and WPG and WGP represents transition matrices between phenotype to gene and gene to phenotype networks, respectively.
The transition probability of a gene gi to a gene gj in the network with n genes and m phenotypes can be calculated using.
| (3) |
In Eq. (3), λ is the probability of jumping between gene and phenotype networks with a default value of 0.5. Similarly, the transition probability of a phenotype hi to a phenotype hj in the network is calculated by replacing the gene adjacency matrix AG with phenotype adjacency matrix AP, and gene to phenotype bipartite connections B with phenotype to gene bipartite connections BT in Eq. (3). The transition probability for a gene gi to a phenotype hj in the network can be calculated using.
| (4) |
Equivalently, phenotype transition matrix WPG is created using Eq. (4) by replacing the gene to phenotype bipartite connections B with phenotype to gene bipartite connections BT. Eqs. (3) and (4) imply that higher values of λ increases the utilization of bipartite relations instead of gene and phenotype networks.
RWR can run on the heterogeneous network of genes and phenotypes utilizing the transition matrix W. Let p0 and pt be state vectors that represent the probability distribution of genes and phenotypes in the network at step 0 and t, respectively, and r represents the restart probability of random walk to specified seed nodes. pt+1 is computed using.
| (5) |
RWR-MH was developed to extend this approach by combining multiple gene networks into a multiplex gene network and utilizing the heterogeneous network consisting of gene-disease connections and a single-layer disease network [17]. They generated a multiplex gene network by combining L undirected gene networks that share a set of n genes. If a gene exists in only some of the gene layers, then it is added to the multiplex gene network with nonzero edge weights in these layers only, and with 0 edge weight in the other layers. The single network of genes and phenotypes is called as layer in the rest of the paper.
Multiplex gene network is represented as nL x nL size square matrix as in Eq. (6) where n is the number of genes, L is the number of gene layers and δ is the jumping probability of random walk to other gene layers.
| (6) |
In Eq. (6), Ai represents the adjacency matrix of the ith gene layer, and I is the identity matrix. Main diagonal elements of AMG matrix represent transitions within a single layer and other elements of the matrix represent the transitions between different layers of the multiplex gene network. The default value of δ = 0.5, giving equal weight to either to stay in the current gene layer or jump to another gene layer.
We extend RWR-MH algorithm by making it compatible with multiplex phenotype networks. We create multiplex phenotype adjacency matrix, AMP represented in Eq. (7), by combining K undirected weighted phenotype layers with m phenotype nodes. AMP is mK x mK size square matrix, and ζ is the jumping probability of random walk to other phenotype layers within the multiplex phenotype network
| (7) |
In Eq. (7), Ai. represents the adjacency matrix of the ith phenotype layer and I is the identity matrix. Like AMG, diagonal elements of AMP matrix represent transitions within the single phenotype layer and other elements of the matrix represent the transitions between different layers of the multiplex phenotype network. The default value of ζ is set to 0.5, giving equal weight to either to stay in the current phenotype layer or jump to another phenotype layer. To connect the multiplex gene and phenotype networks we integrate identical bipartite adjacency matrices. Bipartite adjacency matrix BMGMP, which has a size of nL x mK is created as in Eq. (8). Within BMGMP bipartite matrix, bipartite matrix represents the connections for the ith gene layer to the jth phenotype layer.
| (8) |
In PhenoGeneRanker, the column-normalized transition matrix of multiplex heterogeneous network is encoded by a matrix WPhenoGeneRanker as in Eq. (9).
| (9) |
In Eq. (9), WMG is the transition matrix of the multiplex gene network, WMP is the transition matrix of the multiplex phenotype network, WMPMG is the transition matrix of the multiplex phenotype-multiplex gene bipartite network, and WMGMP is the transition matrix of the multiplex gene-multiplex phenotype bipartite network (i.e., the transpose of WMPMG). WMG is calculated using Eq. (3) by replacing the AG with AMG and B with BMGMP matrices. Equivalently, WMP is calculated using the same equation by replacing the AG with AMP and B with BMPMG matrices. WMGMP and WMPMG are calculated using Eq. (4) by replacing the matrix B with BMGMP and BMPMG, respectively. The whole algorithm is shown in Algorithm 1.
2.2. Running RWR on PhenoGeneRanker Transition Matrix
To apply RWR using Eq. (5) to PhenoGeneRanker transition matrix we need to modify the vectors pt+1, pt and p0 in the equation for multiplex heterogeneous network structure. WPhenoGeneRanker is (nL + mK) x (nL + mK) square matrix, and the dimension of the state vectors is nL + mK. Therefore, we modify the state vectors to hold the state for n genes from each L gene layer and m phenotypes from each K phenotype layer.
p0 state vector holds the initial states of the nodes, which correspond to the seeds used for RWR. p0 is initialized using τ, ϕ and η parameters to control the restart probabilities to each gene, phenotype layer and multiplex network, respectively. τ is defined as τ = [ τ1 … τL ] for gene layers [17] where τi is n size vector for n genes. We introduced ϕ as ϕ = [ ϕ1 … ϕK ] for restart probabilities to phenotype layers where ϕj is m size vector for m phenotype nodes. By default, we use equal restart probabilities to gene and phenotype layers using [τ, ϕ] vector. The importance of gene and phenotype layers can be adjusted by modifying τ and ϕ parameters.
The restart probability to multiplex gene and phenotype networks can be set by η. High η means that RWR will restart more likely to phenotype multiplex network. Initial state vector p0 is set by using.
| (10) |
In Eq. (10), u0 and v0 represent the probability distributions of genes and phenotypes, respectively, in p0 after applying [τ, ϕ] normalization;p0 = [τ, ϕ] · p0, where “·” is element-wise multiplication. Eq. (5) is run until pt reaches a stationary state distribution. Then random walk scores of genes and phenotypes are calculated by taking the geometric mean of L and K layer scores of genes and phenotypes, respectively.
2.3. Empirical p Value Calculation
Network propagation-based gene prioritization methods are known to be biased toward the high-degree nodes in the network [10]. The rank of a node is determined by two criteria: topology of the underlying network and closeness to the seed nodes used for the information propagation. To assess the degree bias of each node rank, PhenoGeneRanker employs an empirical p value calculation based on random seeds. A low p value suggests that the rank of the node is due to its closeness to the seed nodes and its degree together, whereas a high p value suggests that the rank of the node is due to its degree rather than its closeness to the seed nodes.
PhenoGeneRanker randomly samples seed nodes using stratified sampling based on the degree of the gene and the phenotype nodes in the network and performs gene and phenotype prioritization. The number of random seed nodes is set same as the number of actual gene and phenotype seeds. This process is repeated N times where N = 1000 by default. The p values are calculated based on:
| (11) |
In Eq. (11), rankf(i, j) is an indicator function, and rankf(i, j) = 1 if rank of gene i for jth iteration ranki,j ≤ (ranki, actual + offset), and 0 otherwise. ranki, actual is the rank of gene i using actual seeds and we set offset to 100 and 5 for gene and phenotype p value calculations, respectively, with the assumption that number of phenotype nodes is in the order of 100. Adding an offset value to the comparison ensures realistic p values particularly for the top-ranked nodes; otherwise, it would be biased to get extremely low p values for the top-ranked nodes. The calculation of p values is shown in Algorithm 2.
2.4. Complete Multiplex Heterogeneous Network for Rat Organism
To rank the rat genes to discover hypertension disease-related genes, we applied PhenoGeneRanker on a previously created multiplex heterogeneous rat network [21]. Below we briefly describe the generation of this multiplex heterogeneous network of rat genes and strains.
First, we created a three-layer gene interaction network, namely co-expression, PPI and pathway layers. We utilized the RNA-seq expression dataset from the Gene Expression Omnibus (GEO) [22] database (GSE50027) to create a liver gene co-expression layer from six Lyon Hypertensive (LH) and six Lyon Normotensive (LN) rats [23]. We downloaded rat PPI dataset from the STRING V11 database [62] and filtered the dataset to use only physical interactions. We created the pathway layer using the pathway annotation of genes and the pathway ontology tree from the Rat Genome Database (RGD) [24]. We calculated the semantic similarity scores of genes using the ontologyX R package [25]. Ontology-based semantic similarity measures the degree of relatedness between two entities by the similarity in meaning of their annotations over a set of ontology terms by utilizing the graph representation of the terms [26].
Next, we created a three-layer phenotype network for rat strains, utilizing RGD annotation data of mammalian phenotype ontology (MPO) term-based similarity, disease ontology (DO) term-based similarity and quantitative phenotype (ǪP) measurements-based similarity of strains [27]. All strain layers were created based on their similarity to each other in the hypertension disease context. We computed a vector of semantic similarity scores of each strain that represents its similarity to the set of hypertension disease-related MPO terms (Supplementary Table 1, which can be found on the Computer Society Digital Library at http://doi.ieeecomputersociety.org/10.1109/TCBB.2021.3098278.) and DO terms (Supplementary Table 2, available online). Then, we calculated the similarity of strains based on DO and MPO by dot-product of those semantic similarity vectors. We used the quantitative phenotype measurements, namely systolic blood pressure, heart rate and heart weight annotated to the samples for various strains in RGD to create the ǪP measurements-based strain similarity layer by calculating Euclidean distance of those measurements.
2.4.1. Gene-Strain Bipartite Layer
The gene-strain bipartite layer connects the multiplex gene and strain networks based on their semantic similarity of MPO annotations. To make the gene-strain bipartite layer context specific, similar to MPO and DO-based strain similarity layers, we calculated a semantic similarity vector for each gene and strain that represents their similarity to the set of hypertension disease-related MPO terms. In order to include more genes into the bipartite layer, we downloaded MPO annotations of mouse orthologs of rat genes from Mouse Genome Informatics [28].
All the layers were composed of undirected and weighted edges. Edge weights for all networks were scaled to [0.001, 1] interval.
2.5. Seeds and Restart Probabilities
Seeds are used as information sources for the RWR algorithm. The RWR algorithm restarts to the seed genes and strains at each restart based on the probability value set by the parameter η, τ and ϕ. Lower η means RWR is more likely to restart to gene seeds. We set η = 0.5 for our performance analysis. τ and ϕ vector parameters are used to give different weights to individual gene and phenotype layers, respectively. PhenoGeneRanker sets the default values to give equal weights to the individual layers.
2.6. Ranking Hypertension Disease-Related Genes and Strains
To determine the ground truth hypertension disease-related genes, we used the rat gene disease annotations in RGD. We included hypertension disease-annotated genes with experimental evidence codes only, then excluded the genes having only expression-based experimental evidence codes (Supplementary Table 3, available online). We used 167 hypertension disease-related rat genes in our experiments. To evaluate the performance of PhenoGeneRanker, iteratively we used one hypertension disease-related gene as seed gene with one fixed strain seed and measured the rank of the remaining genes. To determine the fixed strain seed, we selected strains that had DO and MPO annotations and ǪP measurements at the same time to be able to utilize all the phenotype layers effectively. Then, we ranked the strains by their measurement values of systolic blood pressure, heart rate, and heart weight, and picked the top strain according to this rank as the seed strain for each run. We used only statistically significant ranks based on their corresponding empirical p value for the performance evaluations of the ranks (p ≤ 0.05).
To determine the set of hypertension disease-related strains, we used the hypertension disease-related DO annotations of strains in RGD. We labeled strains that are annotated with these terms as hypertension disease-related strains. There were 78 hypertension disease-related strains in our experiments. Similar to evaluation of gene ranks, we iterated the set of hypertension disease-related strains. At each iteration we used one hypertension disease-related strain as seed strain with one fixed gene seed and measured the rank of the remaining strains. We selected the fixed gene seed from the set of hypertension disease-related genes having the most diverse and highest number of experimental annotations. Since we used the DO annotations to determine the set of hypertension disease-related strains, we did not use the DO-based strain similarity layer in the network combinations to rank the strains. To determine the statistically significant strain ranks, we used p ≤ 0.1 as opposed to p ≤ 0.05 threshold because the number of statistically significant ranks at p ≤ 0.05 was only 12.
3. Results
We developed PhenoGeneRanker as a Bioconductor package to rank genes and phenotypes using the RWR algorithm on a multiplex heterogeneous network of genes and phenotypes. PhenoGeneRanker integrates multiplex gene and phenotype networks and computes the empirical p values of the ranks to prevent the bias inherent in RWR.
To evaluate the performance of PhenoGeneRanker, we applied it to rat model organism datasets to rank the hypertension disease-related rat genes and strains. To assess the impact of multiplexity on the performance, we generated different combinations of gene and phenotype networks. We generated heterogeneous networks involving single gene and phenotype layers, and multiplex and aggregated gene and phenotype networks. We created aggregated networks by taking the union of the single layers and calculating the geometric means of weights of common edges across layers. We conducted GO enrichment analyses for the top- and bottom-ranked genes. Finally, we investigated the effects of PhenoGeneRanker hyperparameters on the gene and strain ranks. To measure the performance of PhenoGeneRanker, we used cumulative distribution function (CDF) plots of statistically significant gene and phenotype ranks. For a fair comparison, we used the intersection of the statistically significant gene and strain ranks in the compared combinations when generating the CDF plots. We used the Kolmogorov-Smirnov test implementation in R [29] to generate p values for the comparisons of the CDFs. To ensure statistical power in comparing CDFs, we only plotted a pair of CDFs if they have rankings of at least 30 genes/phenotypes in common.
3.1. PhenoGeneRanker Was More Efficient on Multiplex Phenotype Network Than on Aggregated and Single Layer Phenotype Networks on Strain Ranking
Unlike the previous RWR algorithms PhenoGeneRanker can utilize a multiplex phenotype network as well as a multiplex gene network. To evaluate the impact of phenotype network multiplexity on the performance of PhenoGeneRanker based on strain ranking, we used MPO and ǪP layers to create multiplex, single, and aggregated phenotype networks. PhenoGeneRanker performed significantly better on multiplex phenotype network than on the aggregated phenotype network on strain ranking (p < 0.001) (Fig. 2A). The performance difference of PhenoGeneRanker on multiplex phenotype network and network of single MPO layer was even higher than the difference compared to aggregated network (p < 0.001) (Fig. 2B). We could not compare the performance of PhenoGeneRanker on multiplex network with network of the single ǪP layer, as the number of common strain ranks was only two between the two results. Further, we analyzed the effect of the multiplex gene network on the phenotype ranks by comparing it to the aggregated gene network. We observed that usage of a multiplex gene network slightly improved the hypertension disease-related strain ranks, but the difference was not significant (Fig. 2C).
Fig. 2.

Effects of different combinations of phenotype and gene layers on the CDF of hypertension disease-related strains ranks. A) Multiplex phenotype network vs aggregated phenotype network. B) Multiplex phenotype networks vs. phenotype network of single layer. Multiplex network of PPI, PWY, EXPR were used in A and B. C) Multiplex gene network vs. aggregated gene network, multiplex network of MPO and QP were used in C. Mx: Multiplex; Agg.: Aggregated.; PPI: Protein-protein Interaction; PWY: Pathway; EXPR: Co-expression.
3.2. PhenoGeneRanker Was More Efficient on Multiplex Gene Networks Than on Aggregated Gene Networks on Gene Ranking
To evaluate the impact of gene network multiplexity on the performance of PhenoGeneRanker based on gene rankings, we compared the performance of PhenoGeneRanker on different combinations of multiplex and aggregated gene networks We observed that PhenoGeneRanker performed significantly better on each multiplex gene network than on its aggregated counterpart (Fig. 3).
Fig. 3.

Effect of multiplex and aggregated gene networks on the CDF of hypertension disease-related gene ranks. For all configurations three phenotype layers are used as multiplex phenotype network. Mx: Multiplex; Agg.: Aggregated. PPI: Protein-protein Interaction; PWY: Pathway; EXPR: Co-expression.
To assess the impact of individual gene layers on gene ranking, we computed the performance of PhenoGeneRanker when one or two of gene layers were eliminated (Fig. 4). For these comparisons, we used the multiplex phenotype network of three phenotype layers. We observed that the performance of PhenoGeneRanker based on gene ranking slightly but significantly dropped when co-expression (Fig. 4A) or PPI layer (Fig. 4C) was not utilized (p < 0.001). On the other hand, we did not observe a significant performance change when the pathway layer was not utilized (Fig. 4B). PhenoGeneRanker performed slightly better on multiplex network of PPI and pathway for the lower gene ranks than on multiplex network of three gene layers (Fig. 4A). Increased performance difference of PhenoGeneRanker utilizing multiplex gene network and PPI network was evident except for the gene ranks lower than 10 (Fig. 4D). Interestingly, PhenoGeneRanker utilizing the single PPI layer performed better for the top 10 gene ranks. PhenoGeneRanker performed better on the multiplex gene network compared to single pathway network for the gene ranks lower than 100 (Fig. 4E). Finally, PhenoGeneRanker performed better on the multiplex gene network compared to the single co-expression network for the gene ranks lower than 75 (Fig. 4F).
Fig. 4.
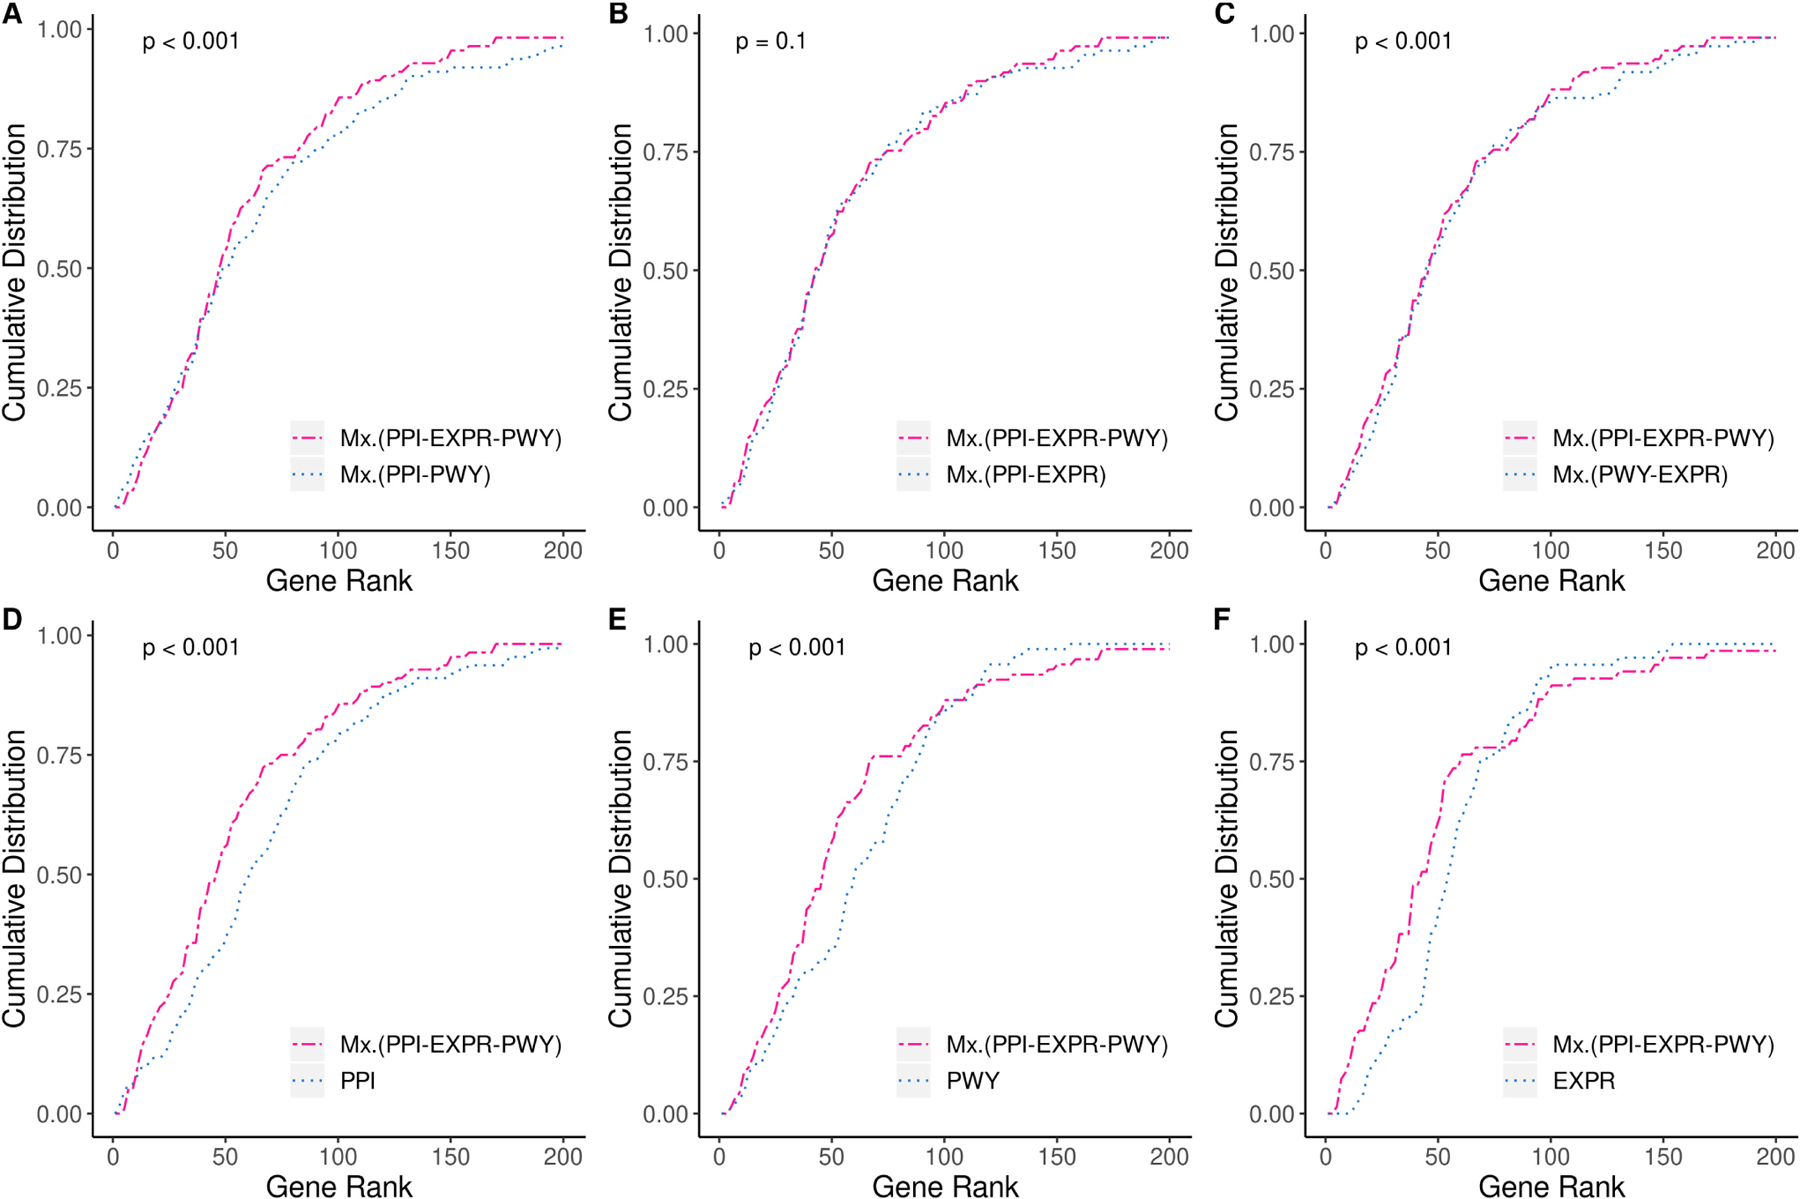
Effects of different multiplex combinations of gene layers on CDF of hypertension disease-related genes rank. Multiplex phenotype network of MPO, DO and QP layers were used for all network combinations. PPI: Protein-protein Interaction; PWY: Pathway; EXPR: Co-expression.
3.3. PhenoGeneRanker Top-Ranked Genes Were Enriched in Hypertension Disease-Related GO Terms
We performed a Gene Ontology (GO) enrichment analysis on the top-ranked genes predicted by PhenoGeneRanker to assess their role in hypertension-related biological processes. To do this, we used all the 167 hypertension disease-related genes as gene seeds and all the hypertension disease-related strains as strain seeds. We ran PhenoGeneRanker using multiplex gene network of three gene layers and multiplex phenotype network of three strain layers. The 185 top-ranked significant genes identified by PhenoGeneRanker were submitted to the Multi-Ontology Enrichment Tool (MOET) available at RGD1. GO: Biological Processes (BP) enrichment analysis identified 824 terms with Bonferroni Corrected enrichment p < 0.001 (Table 1). In comparison, the 185 genes with the lowest ranking had only two enriched terms with corrected p < 0.001. The hypertension-related terms ‘blood circulation (GO:0008015)’ and ‘circulatory system process (GO:0003013)’ were the top two most significant GO:BP in the top-ranked genes, whereas no hypertension- or cardiovascular-related terms were enriched in the bottom-ranked genes.
TABLE 1.
Enriched GO: BP Terms in Top- and Bottom-Ranked Genes From PhenoGeneRanker
| GO:Biological Process (BP) Term | Genes (#) | Corrected p value |
|---|---|---|
| Top-Ranked Gene Enrichment | ||
|
| ||
| blood circulation (GO:0008015) | 74 | 3.81E-62 |
| circulatory system process (GO:0003013) | 75 | 7.42E-62 |
| regulation of biological quality (GO:0065008) | 144 | 2.33E-57 |
| homeostatic process (GO:0042592) | 107 | 1.55E-54 |
| chemical homeostasis (GO:0048878) | 89 | 6.01E-50 |
| regulation of multicellular organismal process (GO:0051239) | 117 | 1.75E-47 |
| response to oxygen-containing compound (GO:1901700) | 106 | 4.61E-46 |
| regulation of system process (GO:0044057) | 66 | 5.08E-46 |
| cellular response to chemical stimulus (GO:0070887) | 124 | 1.89E-45 |
| response to endogenous stimulus (GO:0009719) | 97 | 9.45E-43 |
|
| ||
| Bottom-Ranked Gene Enrichment: | ||
|
| ||
| homophilic cell adhesion via plasma membrane adhesion molecules (GO:0007156) | 12 | 2.01E-07 |
| cell-cell adhesion via plasma-membrane adhesion molecules (GO:0098742) | 14 | 4.74E-07 |
Top 10 enriched terms from 824 terms with Bonferroni corrected p<0.001.
Further, we performed a deeper analysis using the enriched GO terms for hypertension disease-related genes. We chose the enriched GO:BP terms at Bonferroni corrected p value < 0.001 and compared their p values for the PhenoGeneRanker-ranked genes in different quartiles (Fig. 5). We observed a high concordance in GO:BP terms between the genes in the highest-ranked quartile and terms enriched in established hypertension disease-related genes.
Fig. 5.

Heatmap of the negative log of GO enrichment results for ranked gene sets from different quartile intervals. PhenoGeneRanker ranked genes using three-layer multiplex gene and phenotype networks with the hypertension disease-related genes and strains as seeds. Reference GO:BP terms are selected from the enriched terms for hypertension disease-related genes at Bonferroni corrected p < 0.001 significance level.
3.4. Hyperparameter Analysis
Hyperparameters of PhenoGeneRanker can be classified as transition matrix-related hyperparameters and RWR-related hyperparameters. Fig. 6 shows the effect of each hyperparameter perturbation on the CDF of statistically significant hypertension disease-related gene ranks. While one parameter was being perturbed, other parameters were fixed to their default values. We used the multiplex heterogeneous network of three gene layers and three phenotype layers for the hyperparameter analysis.
Fig. 6.

Effect of different hyperparameters on the CDF of statistically significant hypertension disease-related gene ranks. Panels A-C show the effects for transition matrix-related hyperparameters. Panels D-F show the effects for RWR related hyperparameters. All other parameters were fixed at default values while a hyperparameter was perturbed. Multiplex and heterogeneous networks of three gene layers and three phenotype layers were used. The order of gene layers for hyperparameter τ was PPI, pathway and co-expression. The order of phenotype layers for hyperparameter ϕ was DO, MPO and QP.
3.4.1. Transition Matrix Hyperparameters
Transition matrix-related hyperparameters of PhenoGeneRanker are λ, δ and ζ with default value of 0.5.
Parameter λ is the probability of jumping between multiplex networks of genes and phenotypes. By increasing λ, PhenoGeneRanker gives a higher weight to the bipartite relations between genes and phenotypes. We observed the highest and lowest gene ranking-based performance when λ = 0.9 and λ = 0.1, respectively (p < 0.001) (Fig. 6A). The performance of the high value of λ indicates the high contribution of the bipartite layer of genes and phenotypes to hypertension disease-related gene ranks. We could not analyze the effect of λ on strain ranks as the numbers of common strain ranks for the network combinations of different λ values were less than 30.
Parameter δ is the inter-layer jump probability within the multiplex gene network. High δ means high likelihood to jump to other gene layers within the multiplex gene network. Gene ranking-based performance was significantly better when δ = 0.1 or δ = 0.5 compared to δ = 0.9 (p < 0.01) (Fig. 6B). For the lower gene ranks, gene ranking-based performance was slightly but insignificantly better when δ = 0.1 compared to δ = 0.5 (p = 0.4). On the other hand, strain ranking performance was significantly better when δ = 0.9 compared to δ = 0.1 and δ = 0.5 (p < 0.001) (Fig. 7A).
Fig. 7.

Effect of different hyperparameters on the CDF of statistically significant hypertension disease-related strain ranks. Panels A-B show the effects for transition matrix-related hyperparameters. Panels C-D show the effects for RWR related hyperparameters. All other parameters were fixed at default values while a hyperparameter was perturbed. Multiplex and heterogeneous networks of three gene layers and two phenotype layers were used. The order of gene layers for hyperparameter τ was PPI, pathway and co-expression. The order of phenotype layers for hyperparameter ϕ was MPO and QP.
Parameter ζ is the inter-layer jump probability within the multiplex phenotype network. High ζ means high likelihood to jump to other phenotype layers within the multiplex phenotype network. There was no distinguishable effect of different ζ values on the performance of hypertension disease-related gene ranks (Fig. 6C). When ζ = 0.1, PhenoGeneRanker had a slightly but insignificantly higher strain ranking-based performance than cases when ζ = 0.5 and ζ = 0.9 (Fig. 7B).
3.4.2. RWR Hyperparameters
RWR-related hyperparameters of PhenoGeneRanker with default values are: r = 0.7, η = 0.5, τ = (1/L, 1/L,…1/L) and ϕ = (1/K, 1/K,…,1/K).
The global restart probability for RWR, r, controls the probability of jumping back to the seed nodes during the random walk. Fig. 8 shows the effects of different r values on the CDF of hypertension disease-related gene ranks. We observed that PhenoGeneRanker had a significantly higher gene ranking-based performance for r = 0.7 and r = 0.9 compared to r = 0.1 (p < 0.001). Overall, as the value of r increased, the performance got better. Larger r values cause RWR not to diffuse the information to the farther distances, rather it keeps the diffusion close to the seed node. Better performance of higher value of r indicates that the hypertension disease-related genes were close to each other in the network. We could not analyze the effect of r on strain ranks as the numbers of common strain ranks for the network combinations of different r values were less than 30.
Fig. 8.

Effect of different r values on statistically significant hypertension disease-related gene ranks.
Parameter η is the probability of restarting to a gene or phenotype seed in the network. High value of η means a high likelihood to restart to a phenotype seed. PhenoGeneRanker’s gene ranking-based performance was significantly better for η = 0.9 and η = 0.5 compared to η = 0.1 (p < 0.001) (Fig. 6D). This result suggests that strain network has more contribution on the ranks of hypertension disease-related genes than the gene network. This could be due to the high number of hypertension disease-related genes (161 out of 167) that have connections to all the strains in the bipartite layer. Utilization of strain layers has larger effect on hypertension disease-related gene ranks, because of the existing bipartite relations between hypertension disease genes and strains. This result was consistent with the perturbation of the λ, for higher values of which PhenoGeneRanker utilized the bipartite layer more and achieved higher gene ranking-based performance (Fig. 6A). We could not analyze the effect of η on strain ranks as the numbers of common strain ranks for the network combinations of different η values were less than 30.
Parameter τ is the restart probability vector for gene layers. Different weights to different gene layers can be given by changing the specific values in τ. We observed that the results from perturbation of τ (Fig. 6E) were consistent with the results generated by different multiplex gene networks combinations (Section 3.2). We observed that pathway layer was contributing more to the strain ranks, compared to the co-expression layer (Fig. 7C). All CDFs in Fig. 7C were significantly different from each other at p < 0.001 level except for the CDFs for τ = (1, 1, 1)/3 vs. τ = (0.1, 1, 1.9)/3.
Parameter ϕ is the restart probability vector for PhenoGeneRanker to different phenotype layers. Different weights to different phenotype layers can be given by changing specific values in ϕ. We observed that there was no discernable effect of ϕ on the gene rank performance of PhenoGeneRanker (Fig. 6F). On the other hand, giving higher weight to the ǪP layer generated significantly better strain ranks compared to giving higher weight to the MPO layer (p ≤ 0.001) (Fig. 7D), indicating a larger contribution of quantitative phenotype measurements on the strain ranks.
7. Discussion
In this study we developed PhenoGeneRanker, a Bioconductor package that ranks genes and phenotypes using the RWR algorithm on a multiplex heterogeneous network of genes and phenotypes. PhenoGeneRanker integrates multiplex gene and phenotype networks and computes the empirical p values of the ranks to prevent the bias inherent in RWR.
We applied PhenoGeneRanker on multidimensional rat genotype and phenotype datasets to prioritize hypertension disease-related rat genes and strains. To evaluate PhenoGeneRanker, we ran it using single gene and strain seeds, and ranked the remaining hypertension disease-related genes and strains. We plotted the rankings for each network/hyperparameter combination using empirical CDFs.
We showed that PhenoGeneRanker performed better on multiplex phenotype networks than on single and aggregated phenotype networks and ranked more hypertension disease-related strains in the lower ranks (Figs. 2A and 2B). PhenoGeneRanker also performed slightly but insignificantly better at ranking hypertension disease-related strains while utilizing multiplex gene networks compared to aggregated gene networks (Fig. 2C).
Furthermore, we compared the performance of PhenoGeneRanker using multiplex, aggregated and single gene layer network combinations on ranking hypertension disease-related genes. Overall, we showed that PhenoGeneRanker utilizing multiplex gene networks performed better in ranking hypertension disease-related genes than the aggregated networks as multiplex networks preserve the different topologies of individual layers [30] (Figs. 3 and 4).
We conducted a GO enrichment analysis of statistically significant genes within top 200 ranked genes, after running PhenoGeneRanker with all hypertension disease-related genes and strains as seeds. We then compared the overrepresented terms in each quartile of the ranked list with that of known hypertension-related genes. There was substantial enrichment in GO:BP terms related to hypertension with the strongest concordance in the highest ranked quartile, indicating that PhenoGeneRanker predicted hypertension-related genes with high confidence (Fig. 5). PhenoGeneRanker also identified genes that had not previously been annotated for hypertension-related disease at RGD. For example, Ptger1, ranked 10th by PhenoGeneRanker, has three publications indicating its involvement in hypertension disease [31], [32], [33]. Other examples include Gnaq [34], [35], ranked 40th, and Gna11 [36], ranked 42nd by PhenoGeneRanker.
PhenoGeneRanker has several hyperparameters that could be grouped into transition matrix- and RWR-related hyperparameters. We analyzed the effects of hyperparameters on gene and strain ranking-based performance. We observed that perturbation of λ, the jumping probability between multiplex gene and phenotype networks, and η, probability to restart to either a gene or phenotype seed showed substantial performance differences. This indicates that bipartite connections in heterogeneous networks have huge impact on the rankings of genes and phenotypes. Furthermore, perturbation of τ, the probability of restarting to single gene layers, and ϕ, the probability of restarting to single phenotype layers showed some performance differences in the gene and strain ranks. Those parameters can be tuned to get higher performance using the labeled data as we did in this study.
PhenoGeneRanker is a powerful network analysis tool as it enables the early integration of multiple gene and phenotype datasets. It addresses the high-degree node bias by generating empirical p values for the gene and phenotype ranks. It has some limitations; it cannot utilize directed networks, which could provide more fine-grained information. Moreover, available datasets might have patterns of missing data [5] and usually they are not specific for a particular complex trait in question [23]. Finally, it has recently been shown that mutated genes can cause rewiring of molecular interactions [37]. Since PhenoGeneRanker is an unsupervised network propagation tool, it cannot handle the non-condition specific datasets efficiently. Developing a supervised network propagation tool to prioritize genes and phenotypes could address those challenges.
In this study, we used PhenoGeneRanker for the prioritization of hypertension disease-related genes and strains. There are several other researches that investigate disease micro-RNA or lncRNA associations [38], [39], [40], [41]. PhenoGeneRanker can directly be applied for these research problems by utilizing relevant biological networks. Furthermore, it can also be utilized effectively with other research problems such as drug-gene interaction studies where the researcher is interested in prioritizing both type of nodes simultaneously.
Supplementary Material
Acknowledgments
This manuscript is dedicated to the memory of Prof. Mary Shimoyama who passed away on Feb. 19, 2020. Authors would like to thank to RGD team for their help in using the rat datasets, and to Jacob M. Petrie for his contributions to the development of the PhenoGeneRanker Bioconductor package. This work was funded by grant R01 HL064541 from the National Heart, Lung, and Blood Institute on behalf of the NIH (to RGD) and by grant R35GM133657 from National Institute of General Medical Sciences of the National Institutes of Health.
Biographies

Cagatay Dursun received the PhD degree from the joint Department of Biomedical Engineering, Medical College of Wisconsin-Marquette University. His concentration is computational biology and bioinformatics. He utilizes and develops machine learning algorithms for functional genomics. His research interests include issues motivated by network biology and complex traits/diseases, genomics, and health. He develops integrative network analysis methods to utilize interconnected rich genomics and phenotype data to uncover genotype-phenotype relationships.

Anne E. Kwitek received the PhD degree. She is an associate professor with the Department of Physiology, Medical College of Wisconsin and is the PI of RGD. Her research revolves around dissecting the genetic components of hypertension and the cardiometabolic syndrome. Her research integrates genetics, genomics and other ‘omics’ approaches with environmental stressors to identify genes leading to complex disease using rat models; she has also been involved in generating numerous rat genomic resources. She has more than 100 publications with nearly 9000 citations and has been funded by the NIH, VA, USDA, and the American Heart Association (AHA). She is an active teacher and has mentored more than 30 students ranging from high school students through junior faculty. She is a fellow of the AHA, has served on committees in the AHA and the American Physiological Society, on national and international advisory boards involving human and rat genomic resources, and has participated in NIH study sections as an ad hoc member and as a regular member of the NHLBI PPG Parent Committee (HLBP).

Serdar Bozdag received the BS degree in computer engineering from Marmara University, and the PhD degree in computer science from the University of California, Riverside. He is an associate professor with the Department of Computer Science and Engineering, University of North Texas. In 2008, he received a postdoctoral fellowship from the National Cancer Institute, National Institutes of Health. In 2019, he received the NIH’s prestigious Maximizing Investigators’ Research Activity (MIRA) award, a 5-year single-PI research grant. He has served as a Program Committee member in several bioinformatics conferences including ISMB, ACM-BCB, RECOMB/ISCB Conference on Regulatory & Systems Genomics and the Great Lakes Bioinformatics Conference. He is an editorial board member of PLOS ONE and Cancer Informatics journals. He is a member of Association for Computing Machinery (ACM) and International Society of Computational Biology (ISCB). His research goal is to develop open-source integrative computational tools to analyze high dimensional biological, clinical and environmental exposure datasets to infer context-specific gene regulatory interactions and modules, and to predict disease associated genes and patient-specific drug response.
Footnotes
Contributor Information
Cagatay Dursun, Department of Biomedical Engineering Medical College of Wisconsin, Marquette University, Milwaukee, WI 53226 USA..
Anne E. Kwitek, Department Physiology, Medical College of Wisconsin, Milwaukee, WI 53226 USA.
Serdar Bozdag, Department of Computer Science and Engineering, University of North Texas, Denton TX, 76203 USA..
References
- [1].Vidal M, Cusick ME, and Barabási A-L, “Interactome networks and human disease,” Cell, vol. 144, no. 6, pp. 986–998, Mar. 2011. [DOI] [PMC free article] [PubMed] [Google Scholar]
- [2].Carter H, Hofree M, and Ideker T, “Genotype to phenotype via network analysis,” Curr. Opin. Genet. Develop, vol. 23, no. 6, pp. 611–621, 2013. [DOI] [PMC free article] [PubMed] [Google Scholar]
- [3].Yan J, Risacher SL, Shen L, and Saykin AJ, “Network approaches to systems biology analysis of complex disease: Integrative methods for multi-omics data,” Brief Bioinf, vol. 19, no. 6, pp. 1370–1381, Nov. 2018. [DOI] [PMC free article] [PubMed] [Google Scholar]
- [4].Berger B, Peng J, and Singh M, “Computational solutions for omics data,” Nat. Rev. Genet, vol. 14, no. 5, pp. 333–346, 2013. [DOI] [PMC free article] [PubMed] [Google Scholar]
- [5].Ritchie MD, Holzinger ER, Li R, Pendergrass SA, and Kim D, “Methods of integrating data to uncover genotype-phenotype interactions,” Nat. Rev. Genet, vol. 16, no. 2, pp. 85–97, 2015. [DOI] [PubMed] [Google Scholar]
- [6].Cho D-Y, Kim Y-A, and Przytycka TM, “Chapter 5: Network biology approach to complex diseases,” PLoS Comput. Biol, vol. 8, no. 12, 2012, Art. no. e1002820. [DOI] [PMC free article] [PubMed] [Google Scholar]
- [7].Guala D and Sonnhammer ELL, “A large-scale benchmark of gene prioritization methods,” Sci. Rep, vol. 7, 2017, Art. no. 46598. [DOI] [PMC free article] [PubMed] [Google Scholar]
- [8].Cowen L, Ideker T, Raphael BJ, and Sharan R, “Network propagation: A universal amplifier of genetic associations,” Nat. Rev. Genet, vol. 18, no. 9, pp. 551–562, 2017. [DOI] [PubMed] [Google Scholar]
- [9].Chen J, Bardes EE, Aronow BJ, and Jegga AG, “ToppGene suite for gene list enrichment analysis and candidate gene prioritization,” Nucleic Acids Res, vol. 37, no. suppl_2, pp. W305–W311, Jul. 2009. [DOI] [PMC free article] [PubMed] [Google Scholar]
- [10].Erten S, Bebek G, Ewing RM, and Koyutürk M, “DADA: Degree-aware algorithms for network-based disease gene prioritization,” BioData Mining, vol. 4, no. 1, Jun. 2011, Art. no. 19. [DOI] [PMC free article] [PubMed] [Google Scholar]
- [11].Gottlieb A, Magger O, Berman I, Ruppin E, and Sharan R, “PRINCIPLE: A tool for associating genes with diseases via network propagation,” Bioinformatics, vol. 27, no. 23, pp. 3325–3326, Dec. 2011. [DOI] [PubMed] [Google Scholar]
- [12].Guney E and Oliva B, “Exploiting protein-protein interaction networks for genome-wide disease-gene prioritization,” PLoS One, vol. 7, no. 9, Sep. 2012, Art. no. e43557. [DOI] [PMC free article] [PubMed] [Google Scholar]
- [13].Kim Y-A, Wuchty S, and Przytycka TM, “Identifying causal genes and dysregulated pathways in complex diseases,” PLOS Comput. Biol, vol. 7, no. 3, Mar. 2011, Art. no. e1001095. [DOI] [PMC free article] [PubMed] [Google Scholar]
- [14].Singh-Blom UM, Natarajan N, Tewari A, Woods JO, Dhillon IS, and Marcotte EM, “Prediction and validation of gene-disease associations using methods inspired by social network analyses,” PLoS One, vol. 8, no. 5, 2013, Art. no. e58977. [DOI] [PMC free article] [PubMed] [Google Scholar]
- [15].Smedley D et al. , “Walking the interactome for candidate prioritization in exome sequencing studies of mendelian diseases,” Bioinformatics, vol. 30, no. 22, pp. 3215–3222, 2014. [DOI] [PMC free article] [PubMed] [Google Scholar]
- [16].Weston J, Elisseeff A, Zhou D, Leslie CS, and Noble WS, “Protein ranking: From local to global structure in the protein similarity network,” Proc. Nat. Acad. Sci. USA, vol. 101, no. 17, Apr. 2004, Art. no. 6559. [DOI] [PMC free article] [PubMed] [Google Scholar]
- [17].Valdeolivas A et al. , “Random walk with restart on multiplex and heterogeneous biological networks,” Bioinformatics, vol. 35, no. 3, pp. 497–505, Jul. 2018. [DOI] [PubMed] [Google Scholar]
- [18].Li Y and Patra JC, “Integration of multiple data sources to prioritize candidate genes using discounted rating system,” BMC Bioinf, vol. 11, no. S1, Jan. 2010, Art. no. S20. [DOI] [PMC free article] [PubMed] [Google Scholar]
- [19].Dursun C, Shimoyama N, Shimoyama M, Schläppi M, and Bozdag S, “PhenoGeneRanker: A tool for gene prioritization using complete multiplex heterogeneous networks,” in Proc. 10th ACM Int. Conf. Bioinf., Comput. Biol. Health Inform., 2019, pp. 279–288. [Google Scholar]
- [20].Li Y and Patra JC, “Genome-wide inferring gene-phenotype relationship by walking on the heterogeneous network,” Bioinformatics, vol. 26, no. 9, pp. 1219–1224, 2010. [DOI] [PubMed] [Google Scholar]
- [21].Dursun C, Smith JR, Hayman GT, Kwitek AE, and Bozdag S, “NECo: A node embedding algorithm for multiplex heterogeneous networks,” in Proc. IEEE Int. Conf. Bioinf. Biomed., 2020, pp. 146–149. [DOI] [PMC free article] [PubMed] [Google Scholar]
- [22].Barrett T et al. , “NCBI GEO: Archive for functional genomics data sets—Update,” Nucleic Acids Res, vol. 41, no. D1, pp. D991–D995, Jan. 2013. [DOI] [PMC free article] [PubMed] [Google Scholar]
- [23].Wang J et al. , “Systems biology with high-throughput sequencing reveals genetic mechanisms underlying the metabolic syndrome in the lyon hypertensive rat,” Circ. Cardiovas. Genet, vol. 8, no. 2, pp. 316–326, Apr. 2015. [DOI] [PMC free article] [PubMed] [Google Scholar]
- [24].Laulederkind SJF et al. , “A primer for the rat genome database (RGD),” Methods Mol. Biol, vol. 1757, pp. 163–209, 2018. [DOI] [PMC free article] [PubMed] [Google Scholar]
- [25].Greene D, Richardson S, and Turro E, “OntologyX: A suite of r packages for working with ontological data,” Bioinformatics, vol. 33, no. 7, pp. 1104–1106, Dec. 2016. [DOI] [PMC free article] [PubMed] [Google Scholar]
- [26].Pesquita C, Faria D, Falcão AO, Lord P, and Couto FM, “Semantic similarity in biomedical ontologies,” PLOS Comput. Biol, vol. 5, no. 7, Jul. 2009, Art. no. e1000443. [DOI] [PMC free article] [PubMed] [Google Scholar]
- [27].Smith JR et al. , “The year of the rat: The rat genome database at 20: A multi-species knowledgebase and analysis platform,” Nucleic Acids Res, vol. 48, no. D1, pp. D731–D742, Jan. 2020. [DOI] [PMC free article] [PubMed] [Google Scholar]
- [28].Smith CL and Eppig JT, “The mammalian phenotype ontology: Enabling robust annotation and comparative analysis,” Wiley Interdiscip. Rev. Syst. Biol. Med, vol. 1, no. 3, pp. 390–399, 2009. [DOI] [PMC free article] [PubMed] [Google Scholar]
- [29].R. Core Team, R: A Language and Environment for Statistical Computing Vienna, Austria: R Foundation for Statistical Computing, 2013. [Google Scholar]
- [30].Didier G, Brun C, and Baudot A, “Identifying communities from multiplex biological networks,” PeerJ, vol. 3, Dec. 2015, Art. no. e1525. [DOI] [PMC free article] [PubMed] [Google Scholar]
- [31].Bartlett CS, Boyd KL, Harris RC, Zent R, and Breyer RM, “EP1 disruption attenuates end-organ damage in a mouse model of hypertension,” Hypertension, vol. 60, no. 5, pp. 1184–1191, Nov. 2012. [DOI] [PMC free article] [PubMed] [Google Scholar]
- [32].Michel FS, Man RYK, and Vanhoutte PM, “Increased spontaneous tone in renal arteries of spontaneously hypertensive rats,” Amer. J. Physiol. Heart Circ. Physiol, vol. 293, no. 3, pp. H1673–H1681, Sep. 2007. [DOI] [PubMed] [Google Scholar]
- [33].Rutkai I et al. , “Activation of prostaglandin E2 EP1 receptor increases arteriolar tone and blood pressure in mice with type 2 diabetes,” Cardiovasc. Res, vol. 83, no. 1, pp. 148–154, Jul. 2009. [DOI] [PMC free article] [PubMed] [Google Scholar]
- [34].Wirth A et al. , “G12-G13-LARG-mediated signaling in vascular smooth muscle is required for salt-induced hypertension,” Nat. Med, vol. 14, no. 1, pp. 64–68, Jan. 2008. [DOI] [PubMed] [Google Scholar]
- [35].Yang D-L et al. , “Galphaq-protein carboxyl terminus imitation polypeptide (GCIP)-27 inhibits right ventricular hypertrophy induced by monocrotaline in rats,” Biol. Pharm. Bull, vol. 32, no. 3, pp. 376–381, Mar. 2009. [DOI] [PubMed] [Google Scholar]
- [36].Pandey P, Mohammad G, Singh Y, and Qadar Pasha MA, “ROCK2 and MYLK variants under hypobaric hypoxic environment of high altitude associate with high altitude pulmonary edema and adaptation,” Appl. Clin. Genet, vol. 8, pp. 257–267, 2015. [DOI] [PMC free article] [PubMed] [Google Scholar]
- [37].Yi S, Lin S, Li Y, Zhao W, Mills GB, and Sahni N, “Functional variomics and network perturbation: Connecting genotype to phenotype in cancer,” Nat. Rev. Genet, vol. 18, no. 7, pp. 395–410, Jul. 2017. [DOI] [PMC free article] [PubMed] [Google Scholar]
- [38].Chen X, Yin J, Ǫu J, and Huang L, “MDHGI: Matrix decomposition and heterogeneous graph inference for miRNA-disease association prediction,” PLoS Comput. Biol, vol. 14, no. 8, Aug. 2018, Art. no. e1006418. [DOI] [PMC free article] [PubMed] [Google Scholar]
- [39].Chen X, Xie D, Zhao Ǫ, and You Z-H, “MicroRNAs and complex diseases: From experimental results to computational models,” Brief. Bioinf, vol. 20, no. 2, pp. 515–539, Mar. 2019. [DOI] [PubMed] [Google Scholar]
- [40].Gao D, Zhang Y, Zhu M, Liu S, and Wang X, “miRNA expression profiles of HPV-infected patients with cervical cancer in the uyghur population in china,” PLoS One, vol. 11, no. 10, Oct. 2016, Art. no. e0164701. [DOI] [PMC free article] [PubMed] [Google Scholar]
- [41].Yu J, Ping P, Wang L, Kuang L, Li X, and Wu Z, “A novel probability model for lncrna–disease association prediction based on the näive Bayesian classifier,” Genes (Basel), vol. 20, no. 7, 2019, Art. no. 396. [DOI] [PMC free article] [PubMed] [Google Scholar]
Associated Data
This section collects any data citations, data availability statements, or supplementary materials included in this article.